🏠 Home Dashboard
The Home Dashboard is your command center in C360. It gives you a real-time overview of your business performance, alerts, and critical metrics the moment you log in.
🧰 Filters
- 📅 Date Range Filter
- 🎛️ Respective Filters
Date Range Filter – Selects a specific time period for analysis.
Respective Filters – Filters data by Country, Company and Users.
- User filters are dependent on the Country and Company filters (i.e., if you select a country, it will show only the users of that country, and if you select a company, it will show only the users of that company in the user dropdown).
- The Country or Company filter alone will not provide any results.
- The Users filter alone will provide results based on the selected users.
📊 Dashboard Widgets
📈 Campaign Pulse Summary
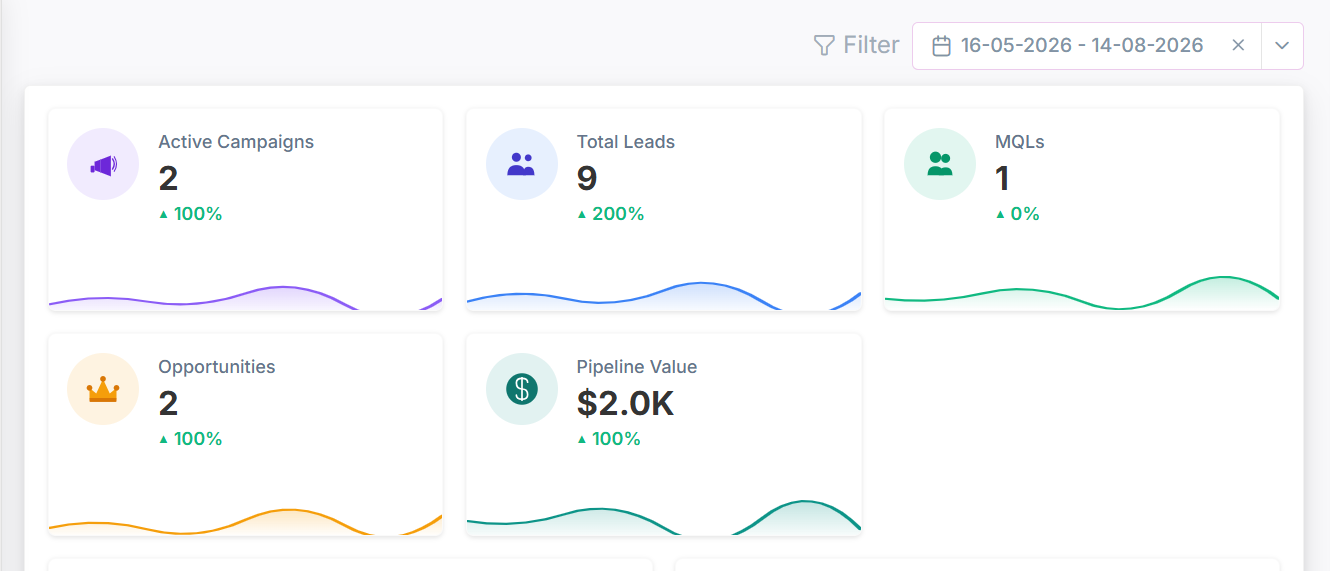
Track the performance of your recent marketing efforts.
- Active Campaign: Total number of active campaigns executed.
- Total Leads: Number of leads generated through a campaign which are in the sales and marketing stages.
- MQLs: Number of marketing qualified leads generated.
- Opportunity: Number of leads (must be part of any campaign) that are converted into opportunities.
- Pipeline Value: Total potential revenue value from all active opportunities generated by the campaign.
Ascending / Descending % = the percentage increase or decrease of a metric when compared to the previous equivalent time period.
- Formula Used : Percentage Change = ((Current Value - Previous Value) / Previous Value) * 100
Click to see quick actions
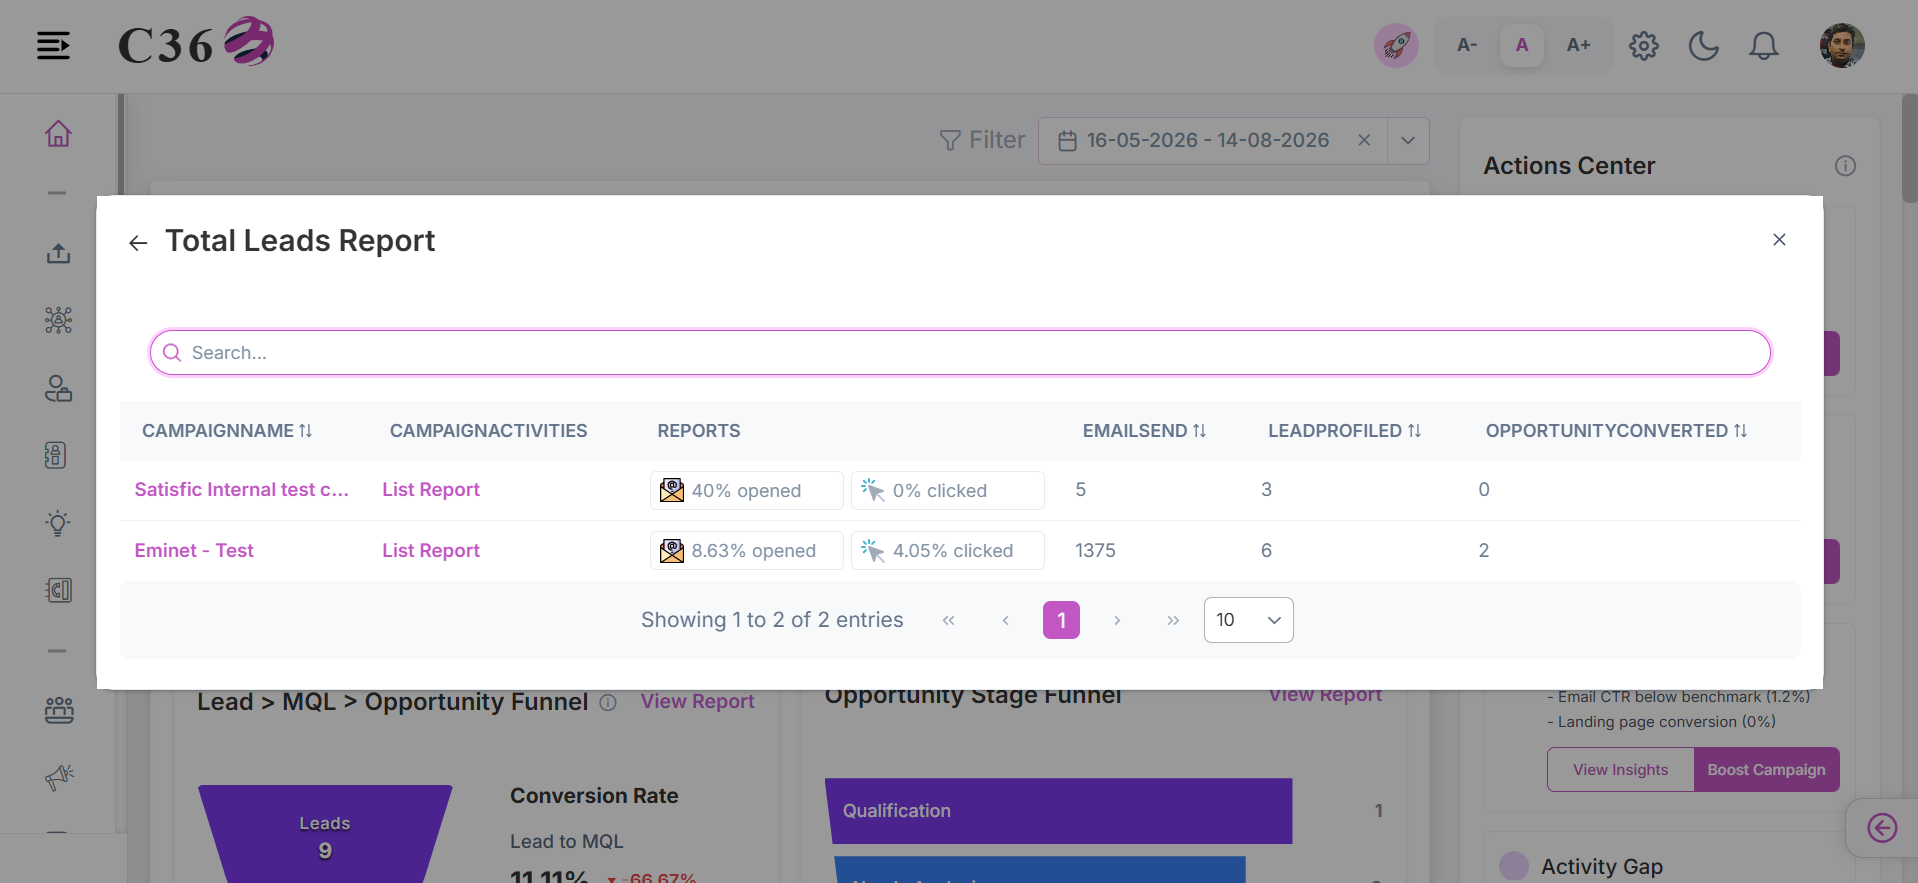
- Click on the individual blocks to see the respected report .
🔄 Lead Conversion Funnel
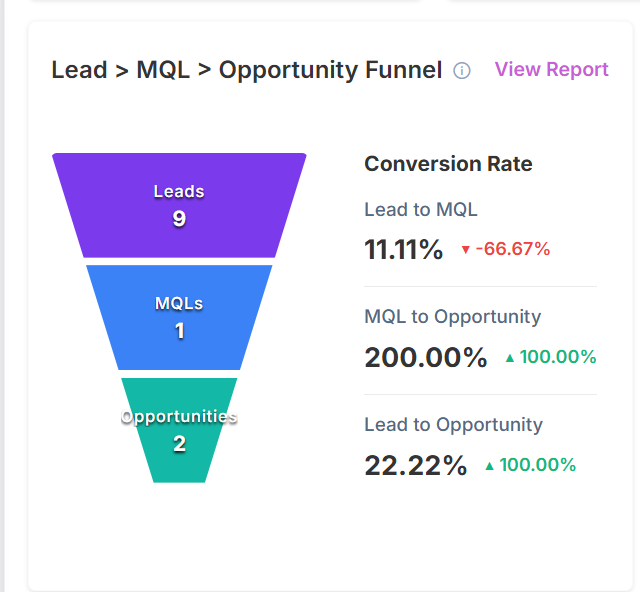
Measures the percentage of leads that successfully transition into the next stage or become closed-won deals.
- Leads: Number of leads generated through a campaign which are in the sales and marketing stages.
- MQLs: Number of marketing qualified leads generated from profiled leads.
- Opportunity: Number of MQLs that are converted into opportunities.
Funnel Data is the data that shows how many leads enter each stage (Lead → MQL → Opportunity) and how they convert from one stage to the next.
Example Funnel Data:
| Stage | Count | Conversion Rate |
|---|---|---|
| Leads | 1000 | — |
| MQL | 300 | 30% (Lead → MQL) |
| Opportunity | 90 | 30% (MQL → Opp) |
Click to see quick actions
- Click on the View Report inside the block to see the conversion report. - Can observe the chart to see the Overall Conversion.
🎯 Opportunity Stage Funnel
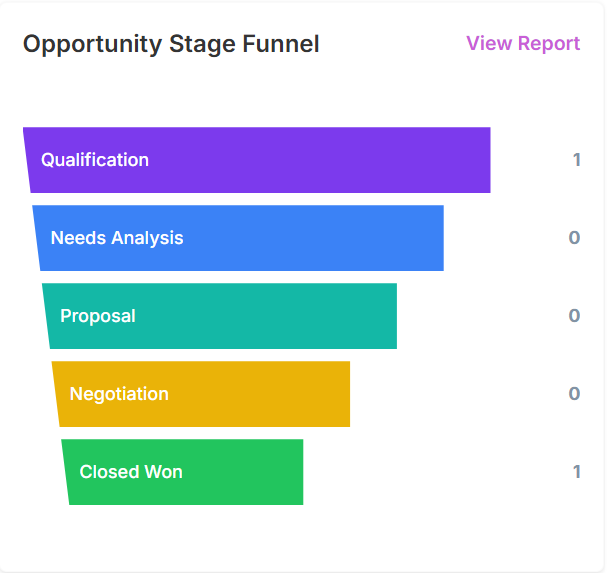
Tracks the journey of qualified opportunities through the sales cycle toward closing, helping accurately forecast expected revenue.
- Qualification: Number of qualified opportunities from leads.
- Needs Analysis: Number of needs analysis from qualified opportunities.
- Proposal and Price Quote: Number of proposals and price quotes from prospects.
- Negotiation: Number of negotiations from proposals and price quotes.
- Closed Won: Number of closed won opportunities from negotiations.
-Those opportunity will show which are part of any executed campaign and converted from the leads.
Click to see quick actions
- Click on the View Report inside the block to see the lead stage funnel report.
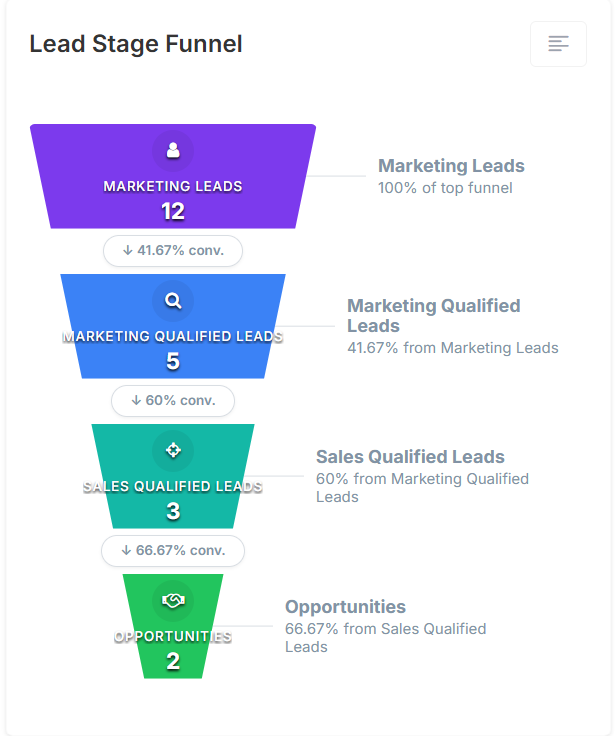
🧲 Lead Stage Funnel
Visualizes the progression of leads through various stages of the qualification process, highlighting drop-off points and conversion efficiency.
- Total Leads: Number of leads which are associated with any campaign.
- Marketing Leads: Number of marketing leads from total leads.
- MQL: Number of marketing qualified leads from marketing leads.
- Appointment: Number of appointments from MQLs.
- Opportunity: Number of opportunities from appointments.
Funnel Data is the data that shows how many leads enter each stage (Lead → Marketing Lead → MQL → Appointment → Opportunity) and how they convert from one stage to the next.
Example lead stage funnel:
| Stage | Count | Conversion % |
|---|---|---|
| Total Leads | 1000 | — |
| Marketing Leads | 700 | 70% |
| MQL | 300 | 42.8% |
| Appointments | 150 | 50% |
| Opportunities | 75 | 50% |
Click to see quick actions
- Click on the menu icon inside the block to see the lead stage funnel report.
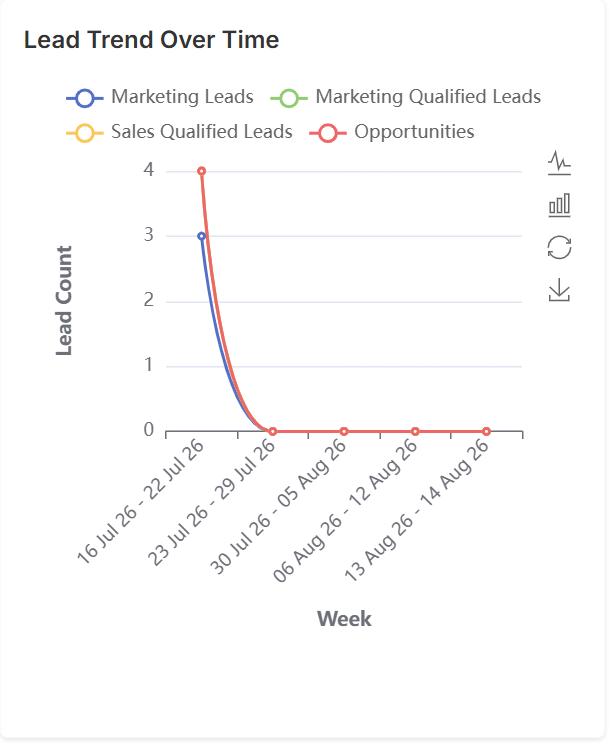
📈 Lead Trend Over Time
Displays the change in the number of leads over a selected period, helping users identify lead growth, decline, and overall acquisition trends.
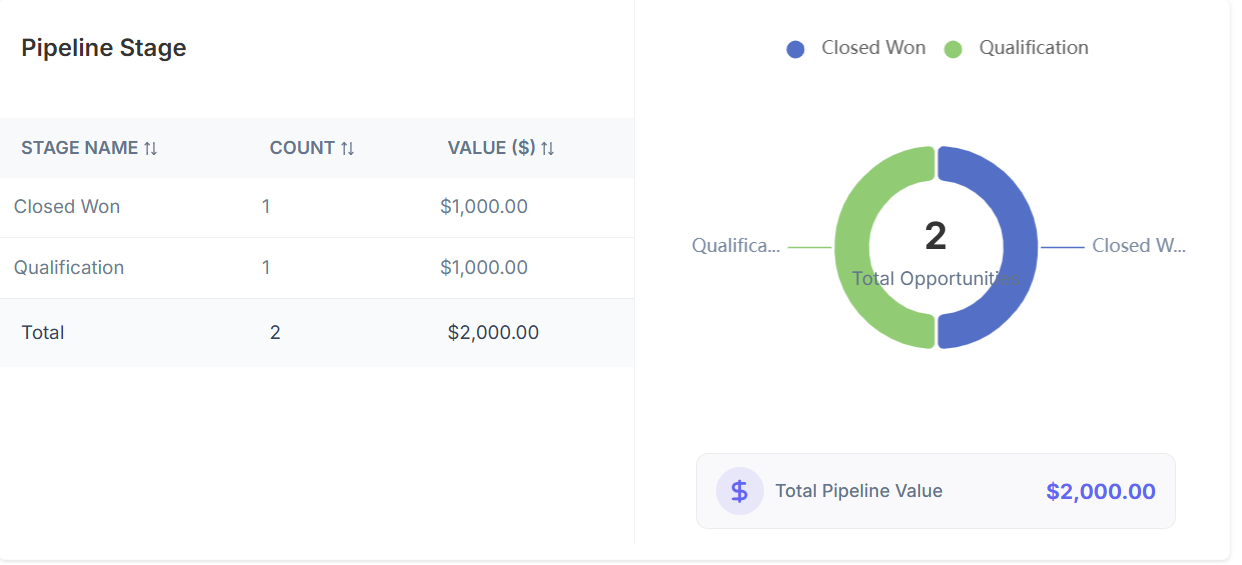
🛤️ Pipeline Stage
Details the current status and distribution of active deals across your defined sales pipeline stages.
Table includes
| Column Name | Description |
|---|---|
| Stage name | Name of the opportunity stage. |
| Count | How many opportunity records belong to a particular stage. |
| Value | Total amount of opportunity within the stage |
Click to see quick actions
- You can observe the data in pie chart view. - Can select and unselect the stage to match the pie chart data.
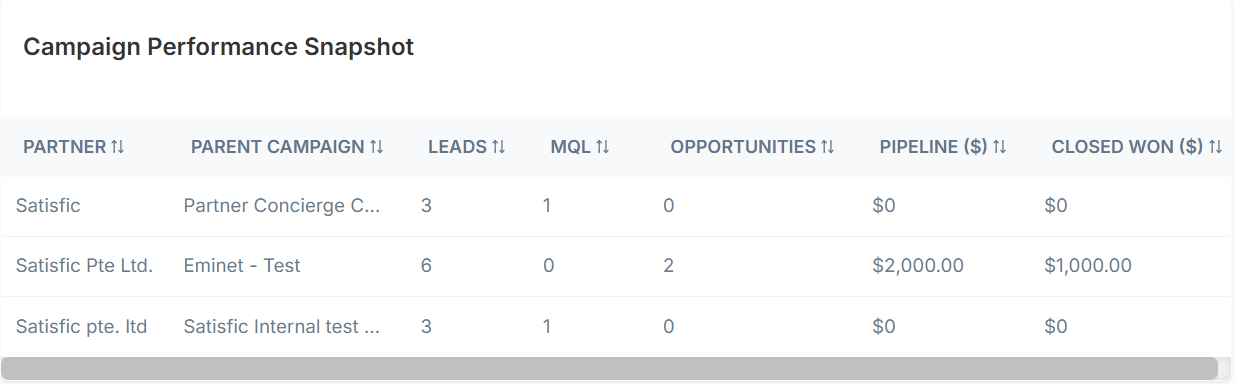
🚀 Campaign Performance
Evaluates the success of your marketing efforts by analyzing engagement, reach, and ROI for specific campaigns.
🧾 Columns included in the table view
| Field Name | Description |
|---|---|
| Partner | A third-party organization or affiliate contributing to lead generation through referrals or co-marketing efforts. |
| Campaign Name | The name of the marketing campaign used to generate leads (e.g., Summer Sale, Webinar 2026). |
| Leads | Number of leads generated through a campaign which are in the sales and marketing stages. |
| MQL | (Marketing Qualified Leads) Leads that meet predefined marketing criteria based on engagement and profile fit. |
| Opportunity | Number of qualified deals created from SQLs with defined business potential. |
| Pipeline | Total potential revenue value from all active opportunities generated by the campaign. |
| Closed Won | A sales opportunity that has successfully resulted in a confirmed sale or business deal. |
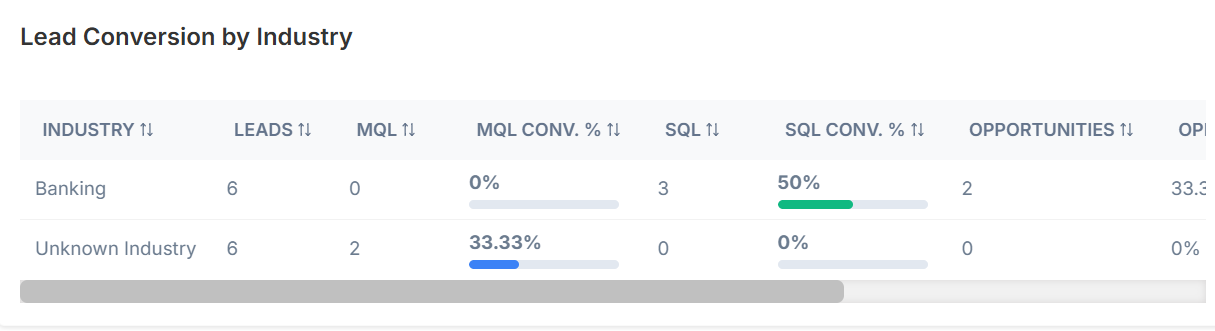
🏭 Lead Conversion by Industry
Displays the lead conversion performance across different industries, helping users identify which industries generate the highest number or percentage of converted leads.
📢 Channel Performance
Compares the effectiveness of different marketing and sales channels in driving traffic, engagement, and conversions.
🧾 Columns included in the table view
| Field Name | Description |
|---|---|
| Channel | The medium used to run marketing activities, such as Email, Social Media, Paid Ads, Events, or Organic Search. |
| Campaigns | Specific marketing initiatives executed within a channel to generate leads (e.g., Webinar, Ad Campaign, Email Blast). |
| Lead | Number of leads generated through a campaign which are in the sales and marketing stages. |
| MQL | (Marketing Qualified Leads) Leads that meet predefined marketing criteria based on engagement and profile fit. |
| Telephone Appointment | Leads who have scheduled or completed a call/meeting with the sales team via phone. |
| Opportunity | Qualified deals created from leads that show strong intent and business potential. |
| Pipeline | Total potential revenue value from all active opportunities. |
| Cost | Total amount spent on campaigns and channels to acquire leads and opportunities. |
| ROI | (Return on Investment) Measure of profitability calculated by comparing revenue generated against campaign cost. |

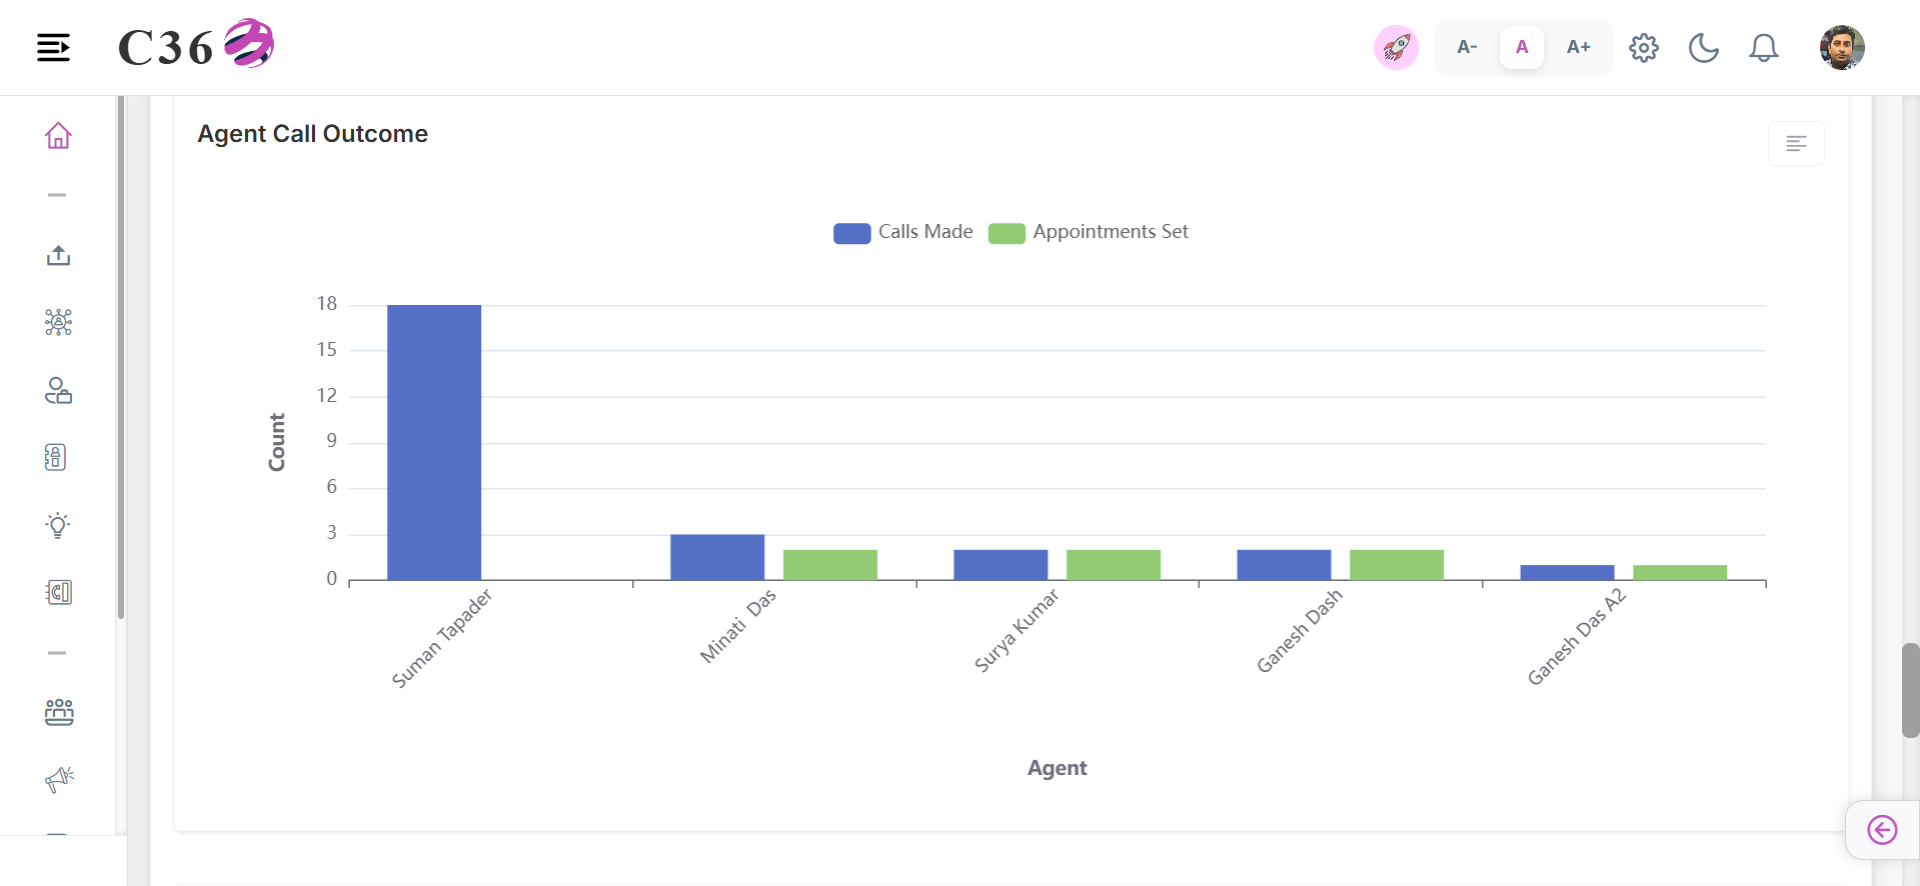
📞 Agent Call Outcome
Summarizes the results of calls made by individual sales agents, helping track productivity and communication success rates.
- Calls Made: Total number of outbound calls made by agents.
- Appointment Set: Number of outbound calls that resulted in setting an appointment.
Click to see quick actions
- Click on the menu icon inside the block to see the agent call outcome report.
🎧 Campaign Call Outcome
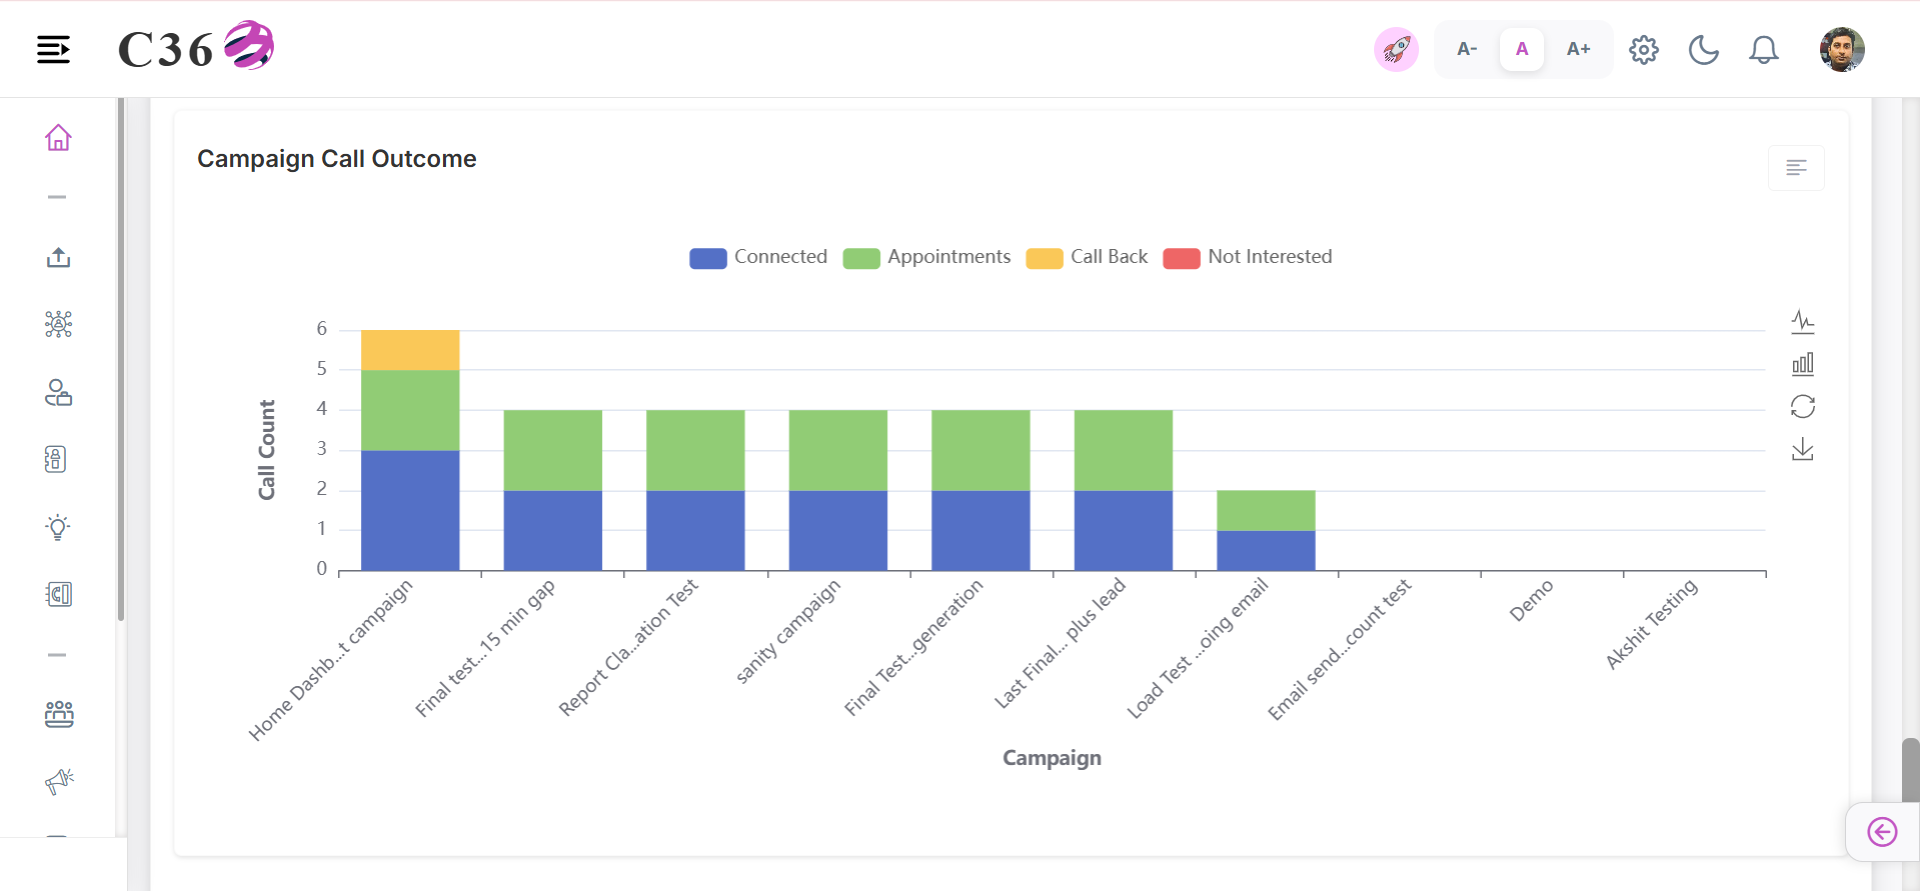
Aggregates the results of all calls executed as part of a specific telemarketing or outreach campaign.
- Connected: Number of calls connected to the intended recipient.
- Appointments: Number of calls that resulted in setting an appointment.
- Call Back: Number of calls that require a follow-up call.
- Not Interested: Number of calls where the recipient expressed no interest in the offer.
Click to see quick actions
- Click on the menu icon inside the block to see the campaign call outcome report.
📈 Top Performing Assets
Highlights the assets that have achieved the highest engagement or overall performance based on metrics.

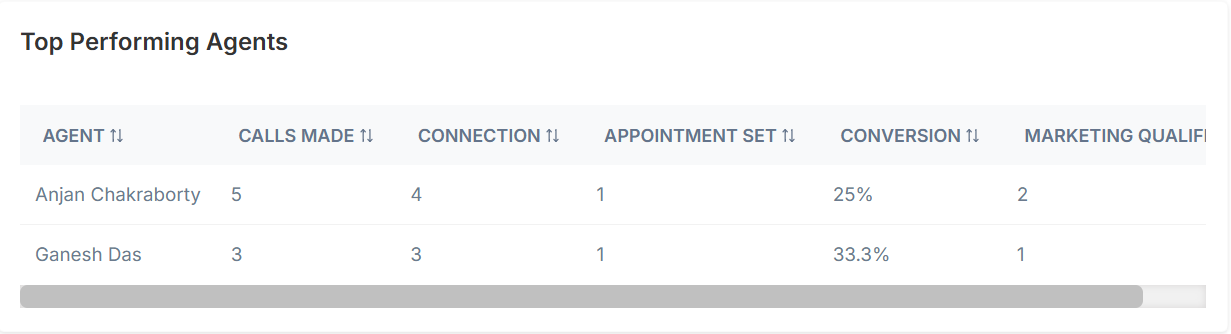
👨💼 Top Performing Agents
Displays the agents or sales representatives with the highest performance based on key metrics such as lead conversions, opportunities created, revenue generated, or activities completed.
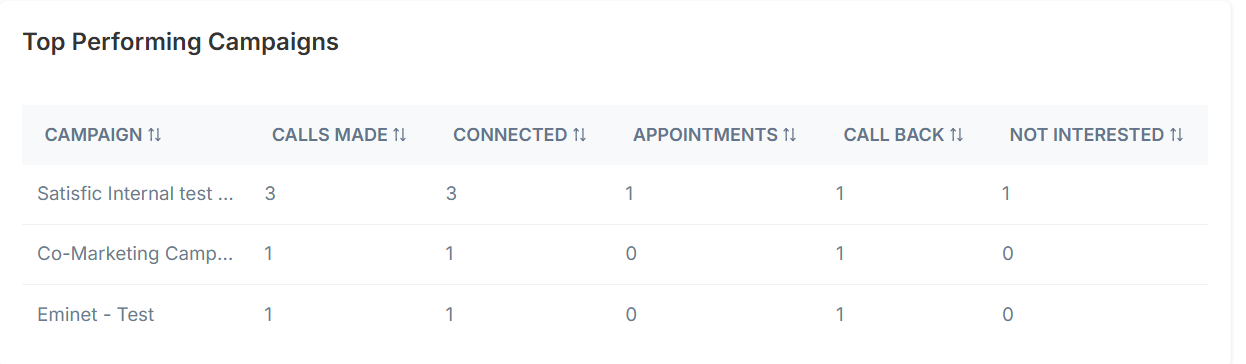
📣 Top Performing Campaigns
Identifies the campaigns that have delivered the best results based on metrics such as lead generation, engagement rates, conversions, opportunities created, or return on investment (ROI).
💻 Platform Adoption
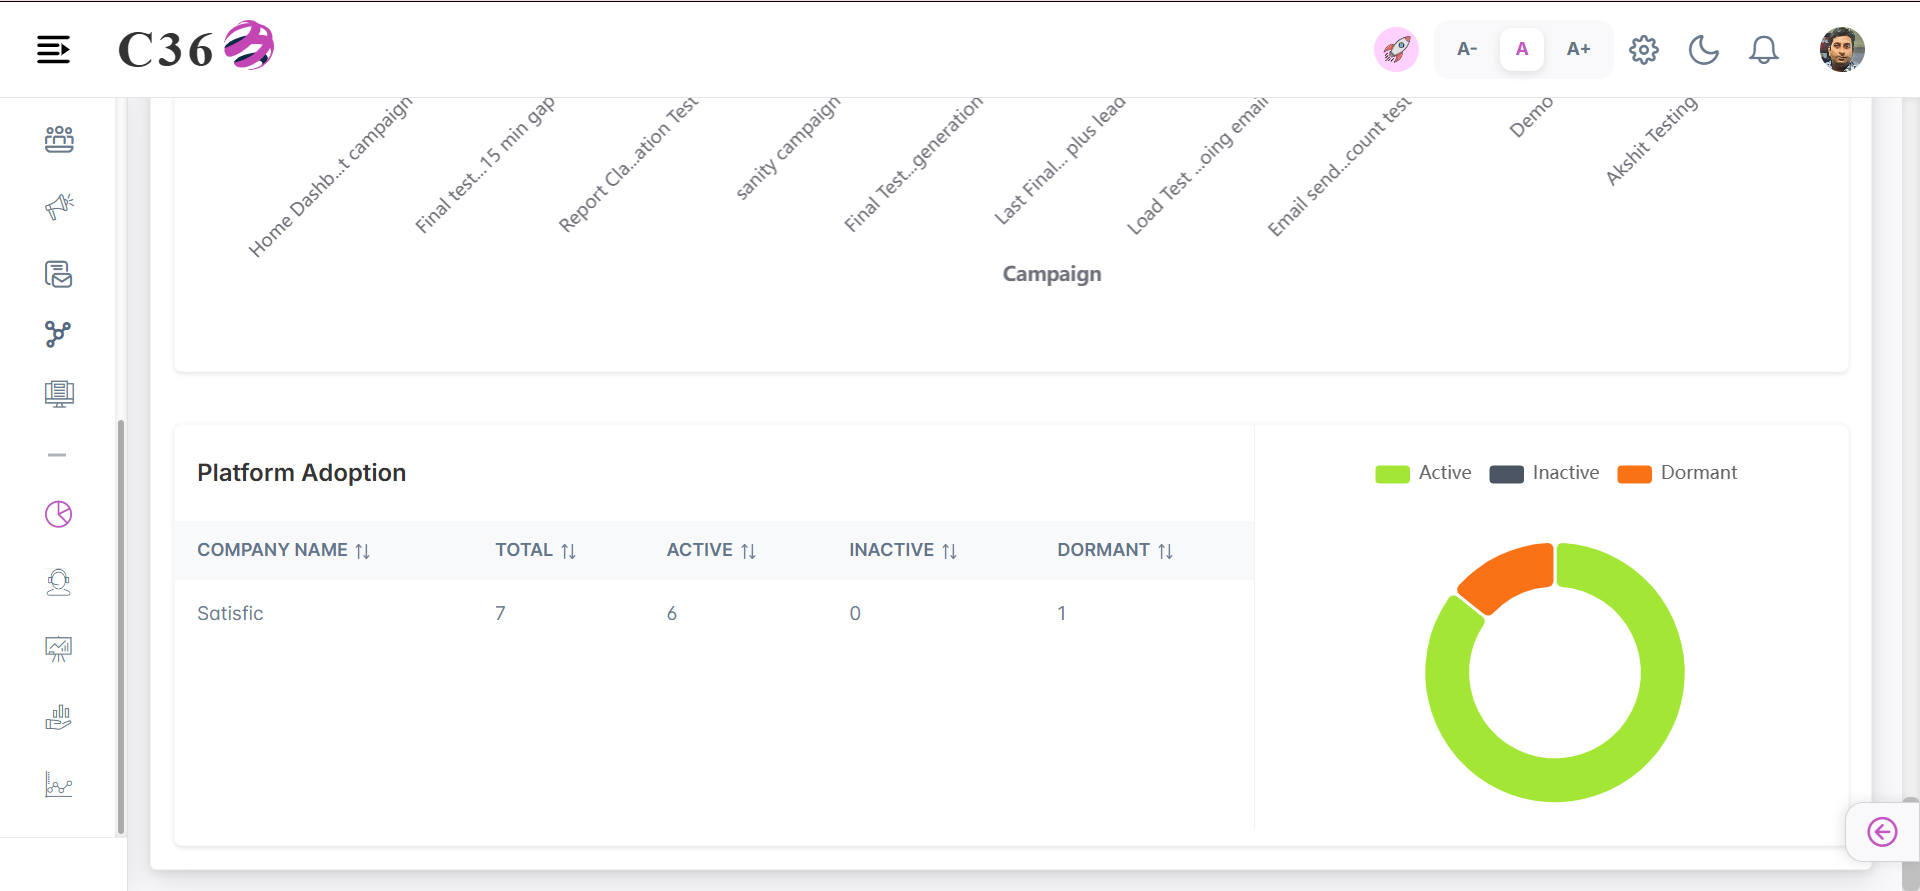
Track how well your team is utilizing the C360 platform.
- Company: Name of the company from which user belongs.
- Total: Total number of users in the company.
- Active: Number of active users in the company.
- InActive: Number of inactive users in the company.
- Dormant: Number of dormant users in the company.
- Active: Users who have logged in within the last 30 days.
- InActive: Users who have not logged in within the last 30 days but have logged in within the last 90 days.
- Dormant: Users who have not logged in within the last 90+ days.
Click to see quick actions
- You can observe the data in pie chart view. - Can select and unselect the options to match the pie chart data.
🛠️ Customizing Your View
The Home Dashboard is personalized based on your user role. Sales users see sales-centric widgets, while Marketing users see campaign performance.
- Clicking on the More will take you to the respective report section.