📢 Telemarketing Report
It provides a concise summary of telemarketing activities and outcomes, highlighting call performance, agent productivity, and conversion results.
To access it:
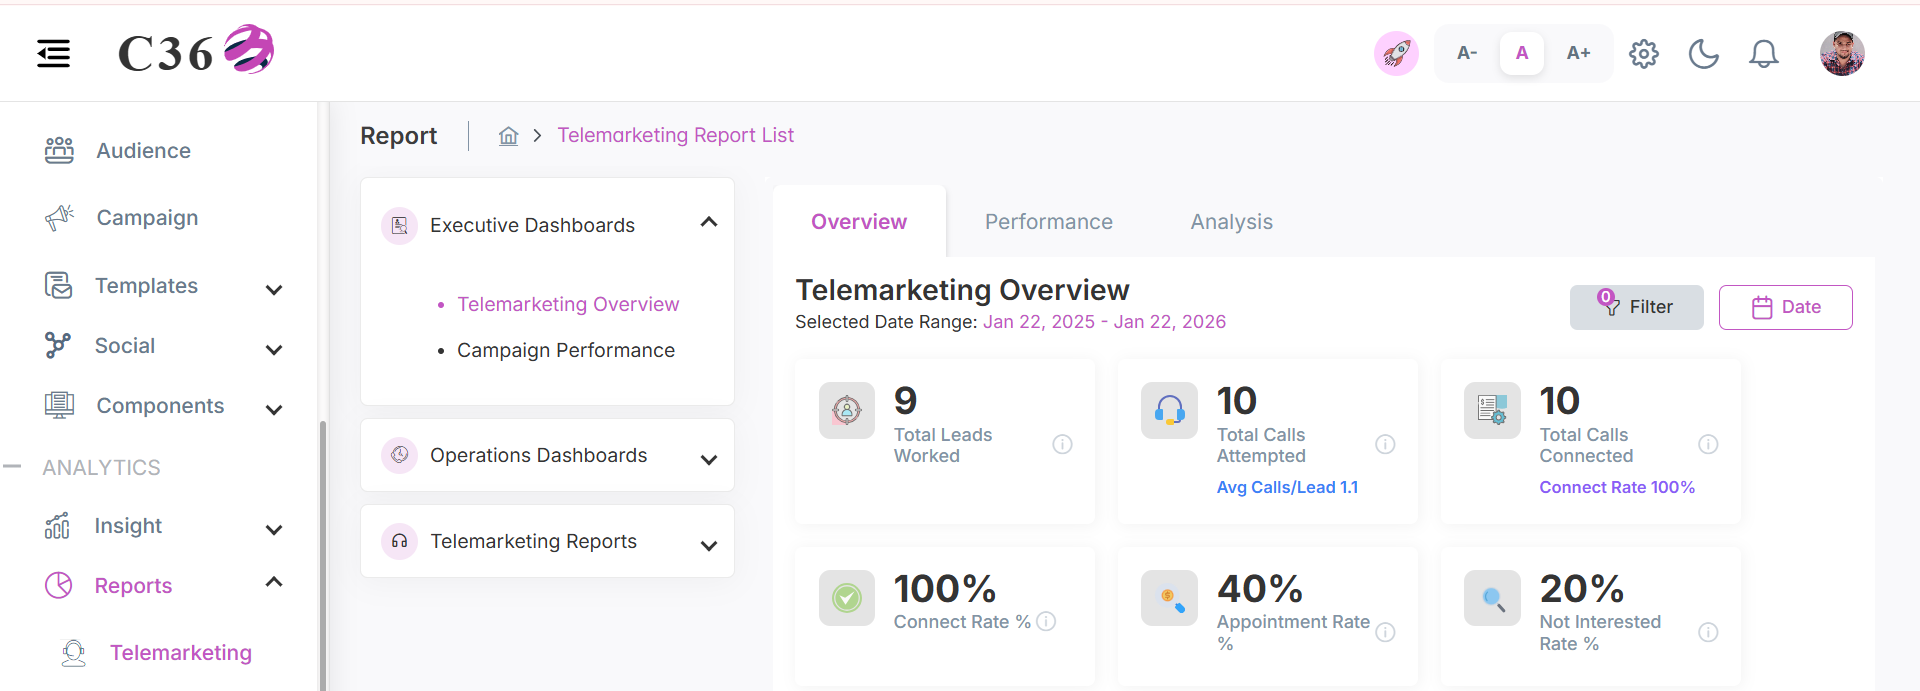
➡️ Go to Analytics → Reports → Telemarketing Report from the left-hand menu.
- By default, reports are displayed with a date range of one year back from today.
━━━━━━━━━━━━━━━━━━━━━━━━━━━━━━━━━━━━━━━━━━━━━━━━━━━━━━━━━━━━━━━━━━━━━━━━━━━━━━━━━━━━━
🧰 Filters
- 📅 Date Range Filter
- 🎛️ Respective Filters
Date Range Filter – Selects a specific time period for analysis.
Respective Filters – Filters data by Campaign and Users.
━━━━━━━━━━━━━━━━━━━━━━━━━━━━━━━━━━━━━━━━━━━━━━━━━━━━━━━━━━━━━━━━━━━━━━━━━━━━━━━━━━━━━
📊 Executive Dashboard
📞 Telemarketing Overview
- 📋 Overview
- 📈 Performance
- 📊 Analysis
- Total Leads Worked: The total number of unique leads that have been processed.
- Total Calls Attempted: Total number of outbound calls made.
- Total Calls Connected: The number of calls that were successfully answered.
- Connect Rate %: The overall percentage of attempts that resulted in a connection.
- Appointment Rate %: The percentage of calls that resulted in a scheduled appointment.
- Not Interested Rate %: The percentage of calls where the lead expressed no interest.
Click to see quick actions
- Hover on the "i" icon to see the tooltips. - Filter by Date Range. - Filter by Campaign and Users.
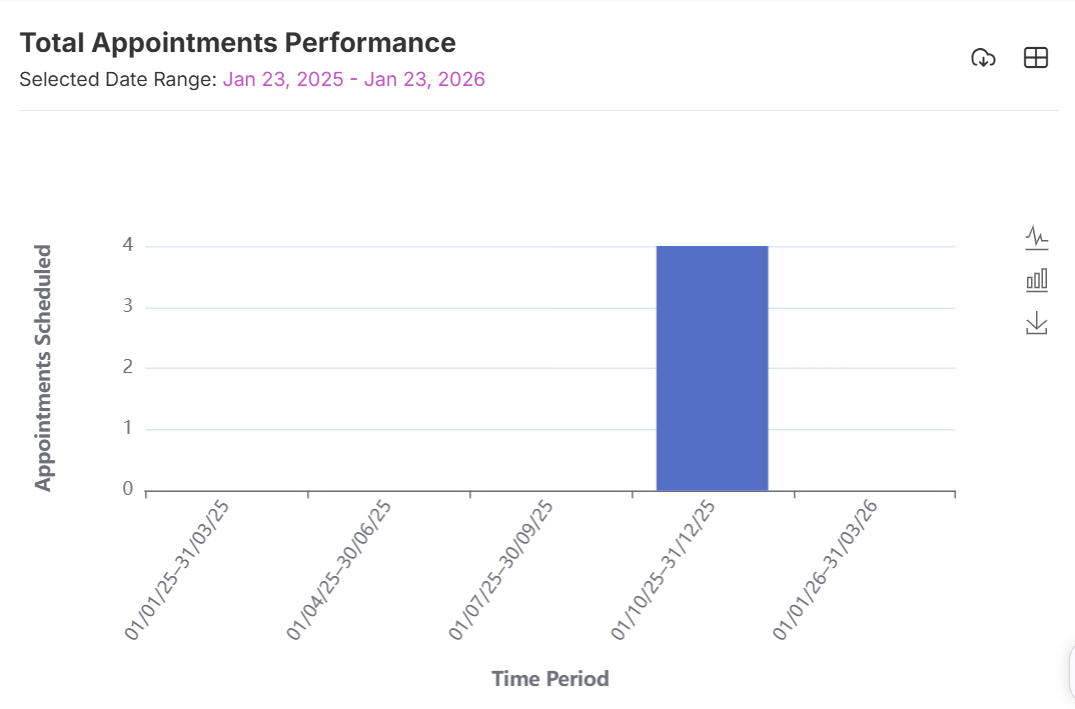
🗓️ Total Appointment Performance
A summary of appointment-related metrics, showing the total appointments scheduled, completed, and converted, to evaluate overall scheduling effectiveness and sales impact.Click to see quick actions
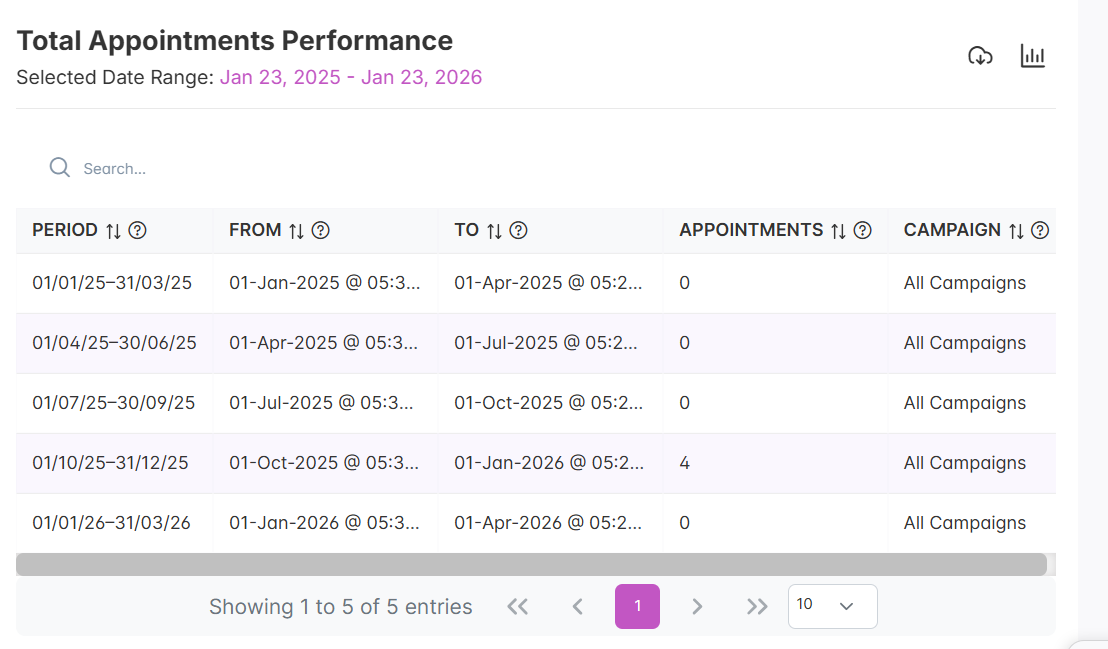
🧾 Columns included in the table view.
| Column | Description |
|---|---|
| Period | Time period bucketed based on the selected date range |
| From | Start date of the period |
| To | End date of the period |
| Appointments | Total number of appointments scheduled |
| Campaign | Campaign scope applied to the report (Selected campaigns or all campaigns) |
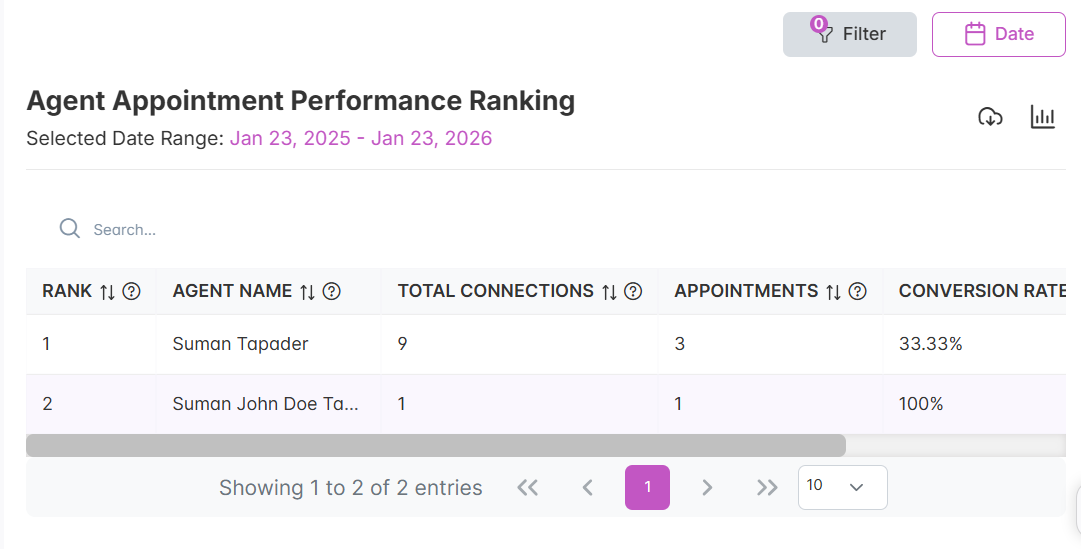
🏆 Agent Appointment Performance Ranking
A ranked view of agents based on their appointment performance, comparing scheduled, completed, and converted appointments to identify top performers and improvement areas.Click to see quick actions
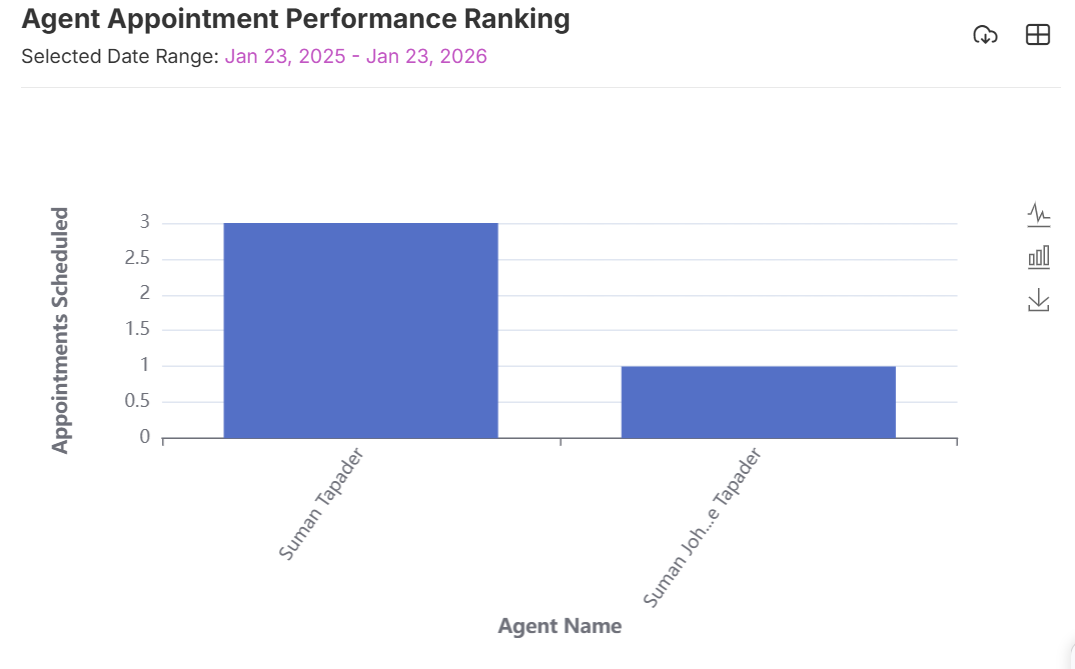
🧾 Columns included in the table view.
| Column | Description |
|---|---|
| Rank | Position of the agent based on total number of appointments scheduled (Higher is better). |
| Agent Name | Full name of the telemarketing agent. |
| Total Connection | Number of calls successfully connected by the agents. |
| Appointments | Total number of appointments scheduled by the agent. |
| Conversion Rate (%) | Percentage of connected calls that resulted in scheduled appointments. |
| Campaign | Campaign scope applied to the report (Selected campaigns or all campaigns). |
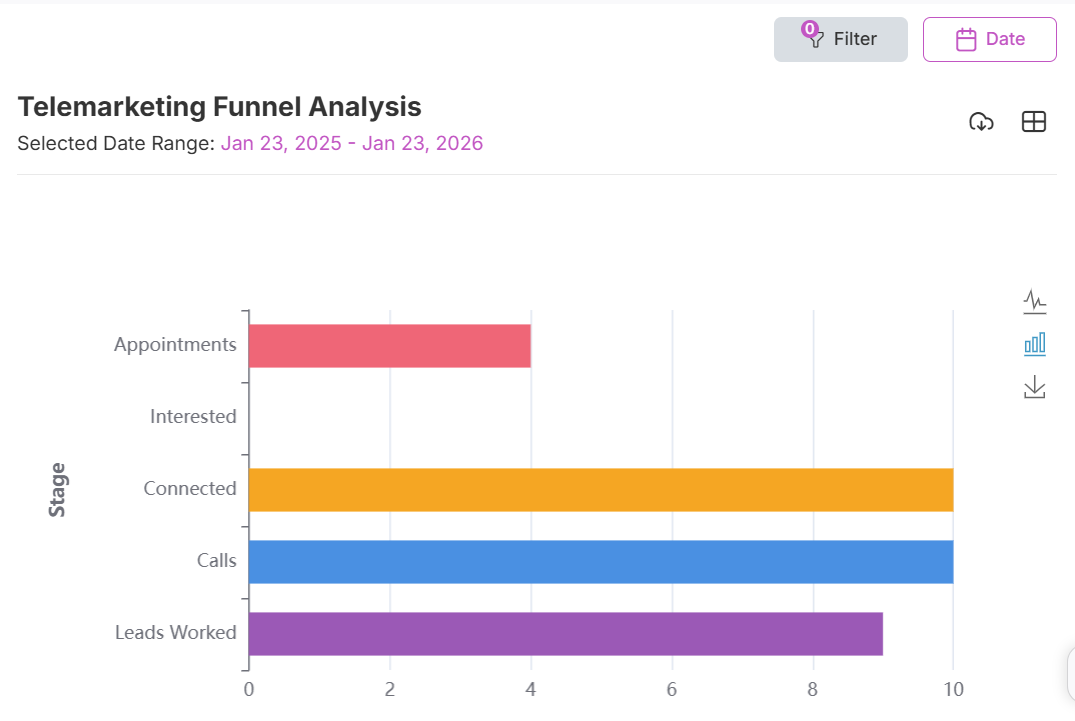
📉 Telemarketing Funnel Analysis
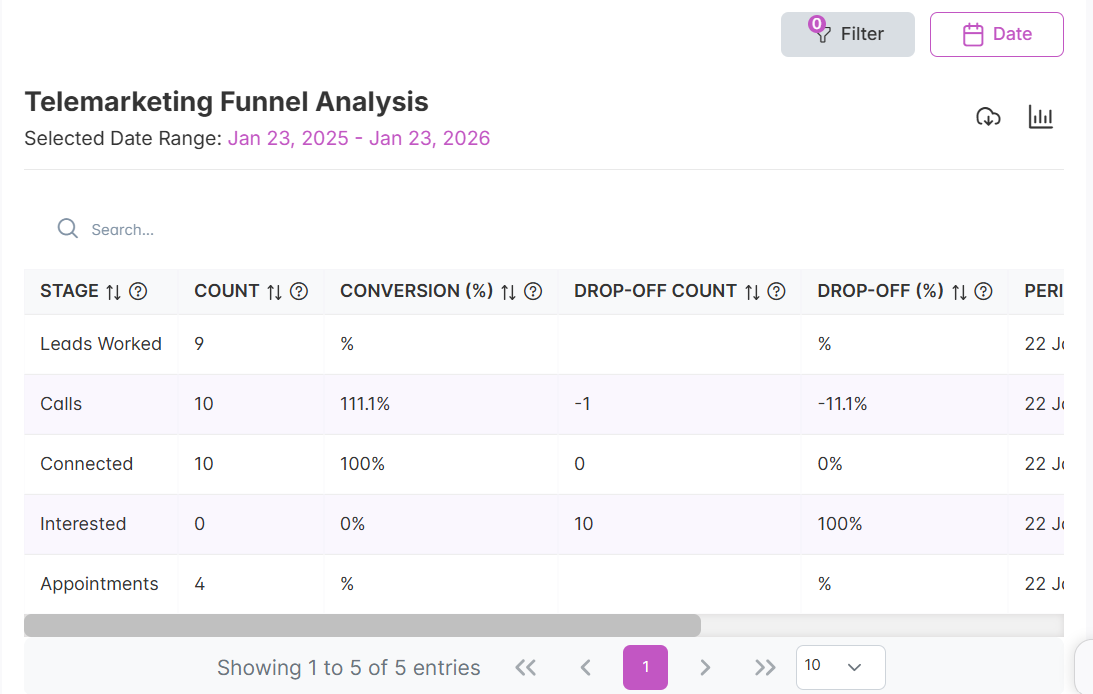
A visual representation of the telemarketing funnel, showing the flow of leads through each stage from initial contact to conversion, highlighting drop-off points and conversion rates to identify areas for improvement.Click to see quick actions
🧾 Columns included in the table view.
| Column | Description |
|---|---|
| Stage | Telemarketing funnel stage. |
| Count | Totals records at this stage. |
| Conversion (%) | Percentage conversion from the previous stage to current stage. |
| Drop-off-count | Number of records lost compared to the previous stage. |
| Drop off (%) | Percentage drop-off compared to the previous stage. |
| Period | Selected Reporting period. |
| Campaign | Campaign applied to the funnel analysis. |
| Agents/Team | Scope of agents included in the analysis (Selected agents or all agents). |
🎯 Campaign Performance
- 📋 Overview
- 📈 Performance
- 📊 Analysis
📈 Campaign Performance Overview
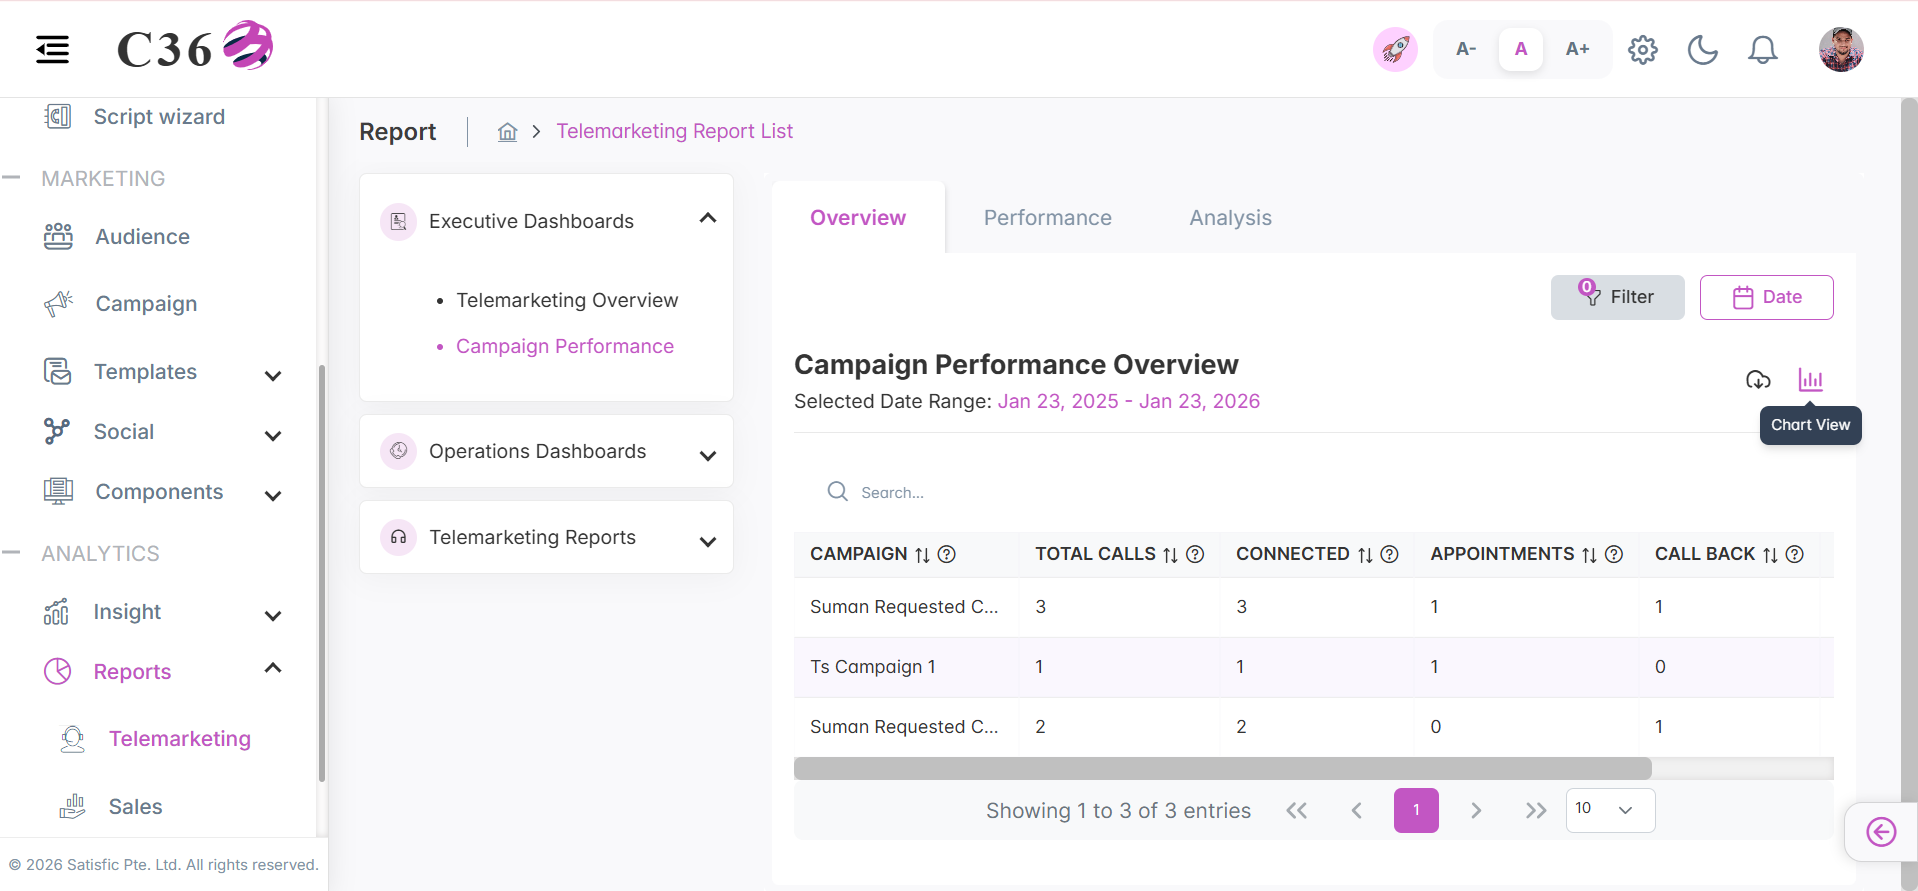
A high-level summary of campaign results, highlighting reach, engagement, and overall effectiveness.Click to see quick actions
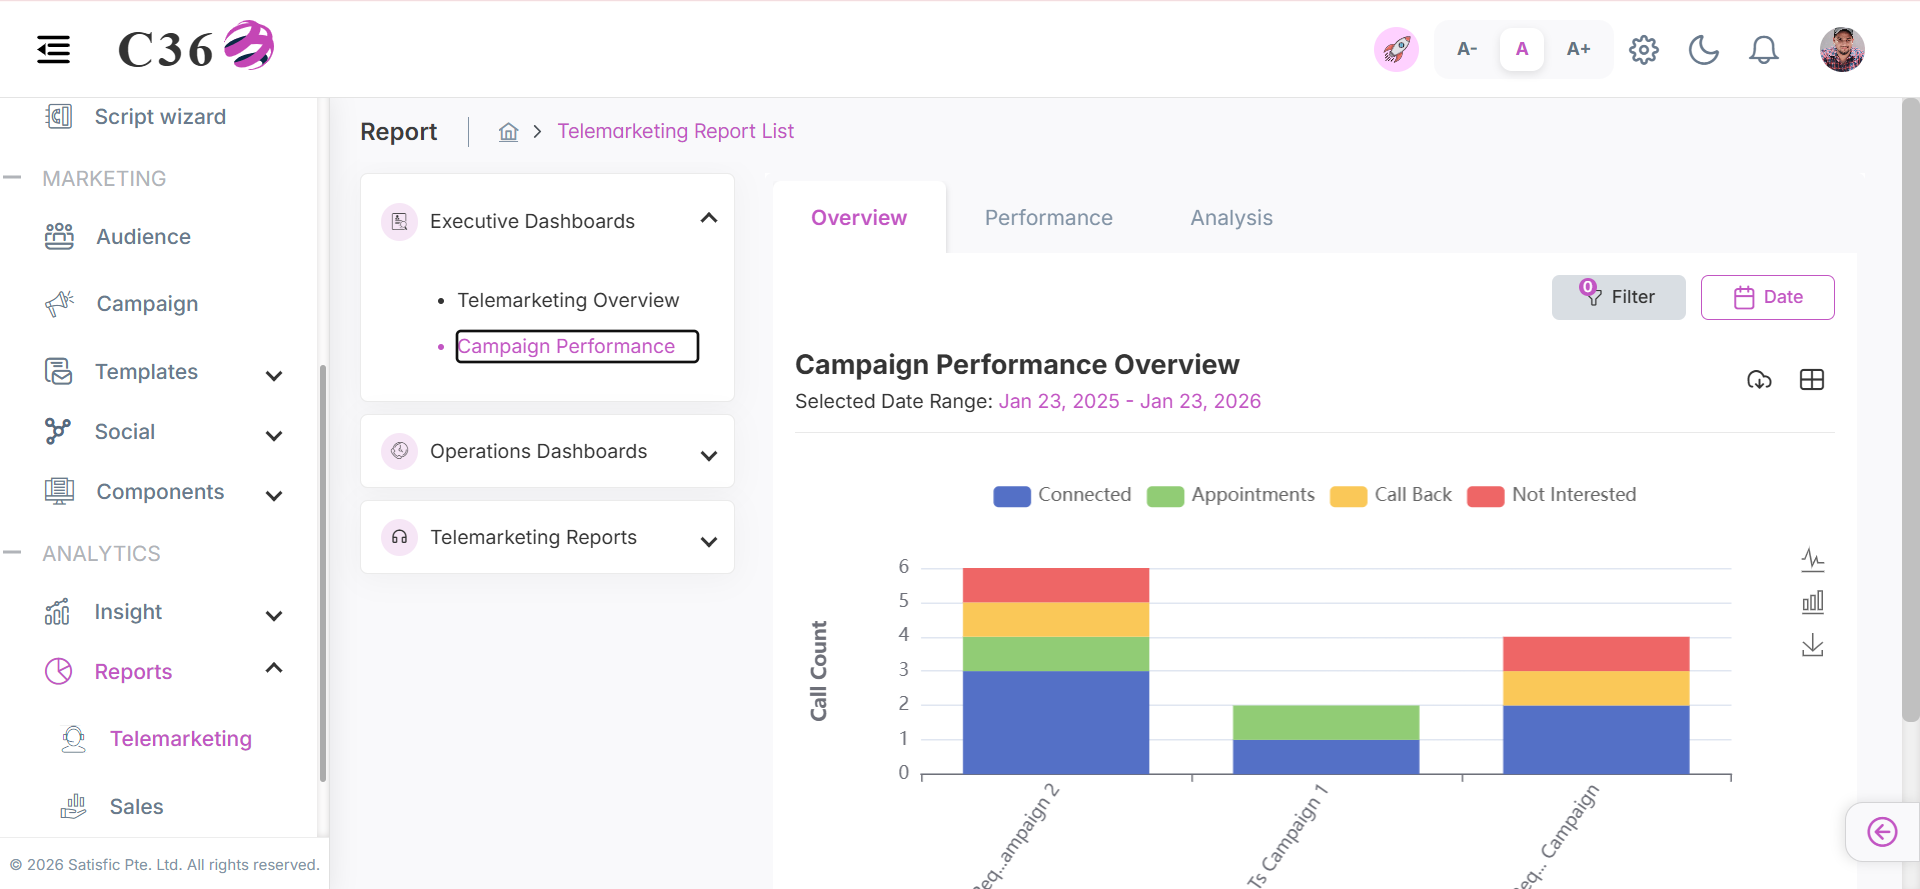
🧾 Columns included in the table view.
| Column | Description |
|---|---|
| Campaign | Name of the campaign. |
| Total Calls | Total number of calls made for the campaign. |
| Connected | Number of calls successfully connected. |
| Appointments | Total appointments scheduled for the campaign. |
| Call Back | Number of calls marked for callback. |
| Not Interested | Number of calls where lead was not interested. |
🔗 Campaign Connect Rate Performance
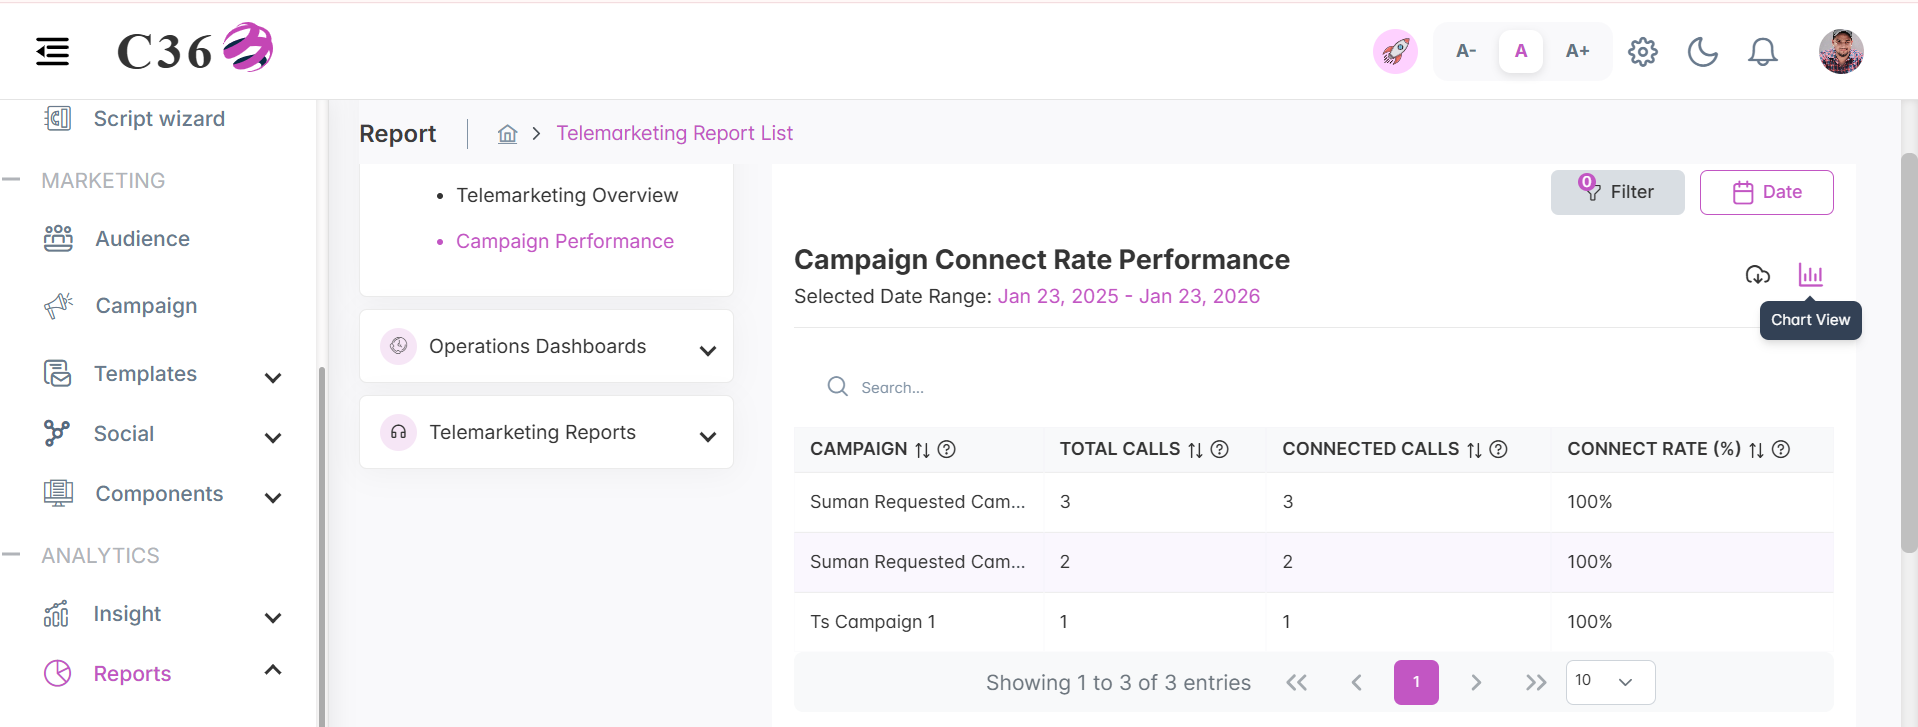
A concise view of call connection rates across campaigns, measuring reach efficiency and contact success.Click to see quick actions
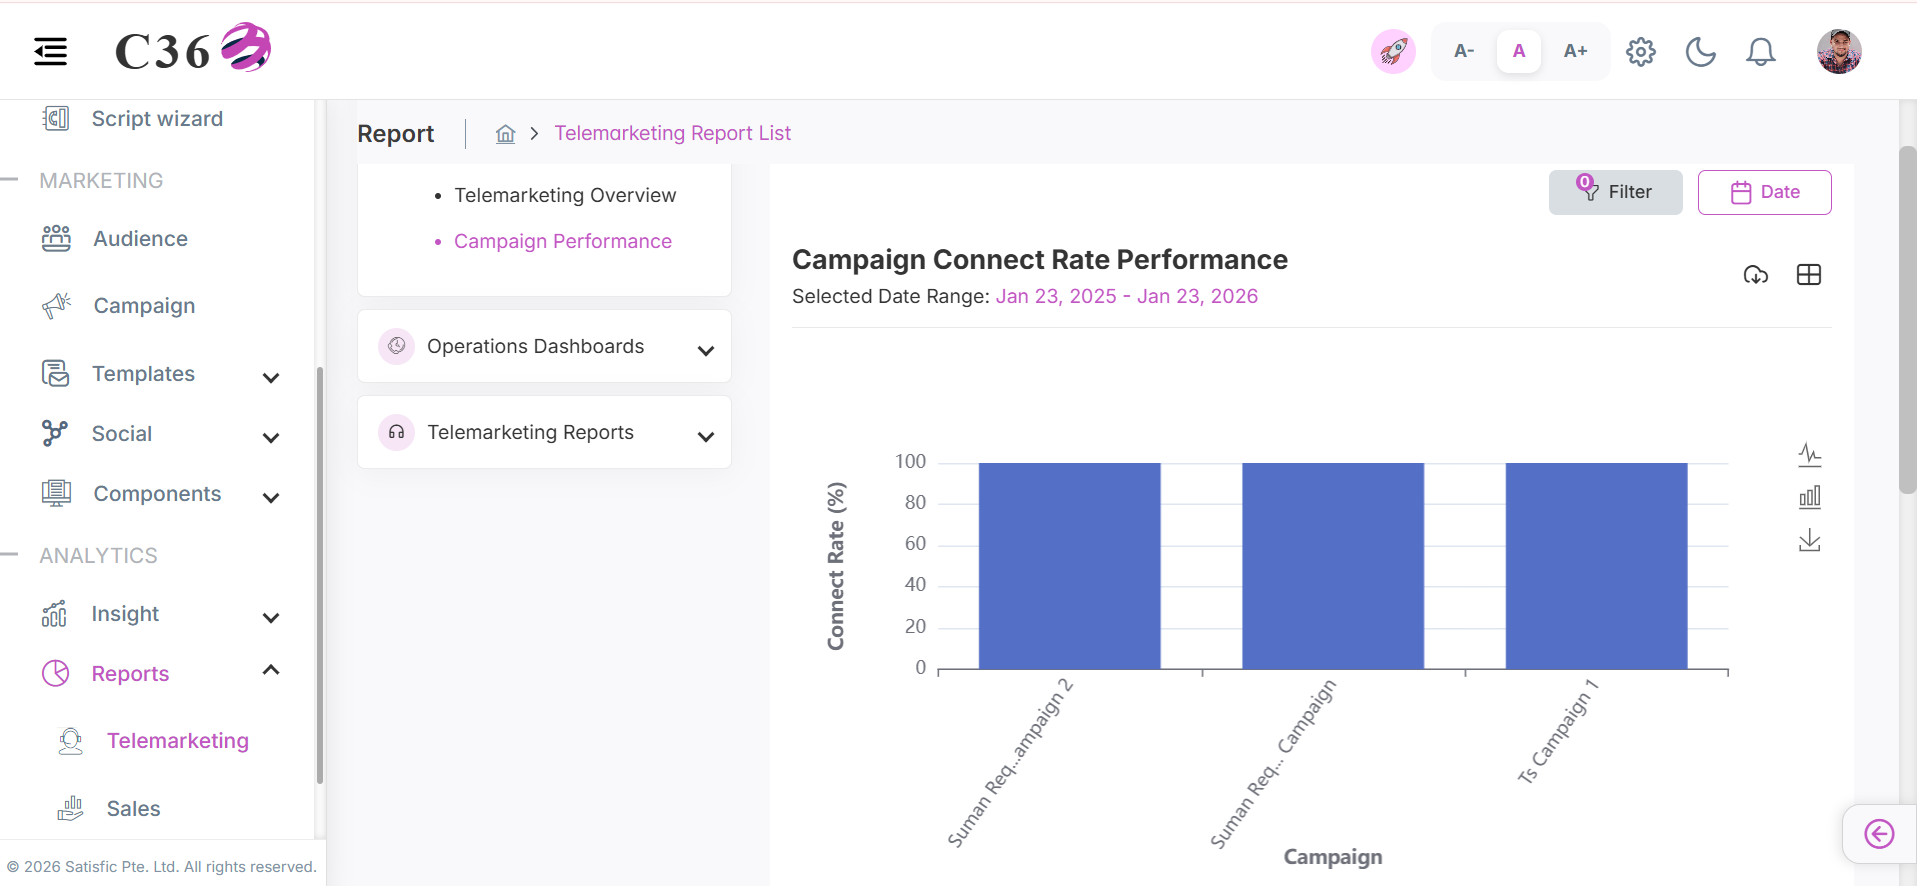
🧾 Columns included in the table view.
| Column | Description |
|---|---|
| Campaign | Name of the campaign. |
| Total Calls | Total number of calls made for the campaign. |
| Connected Calls | Number of calls successfully connected. |
| Connected Rate (%) | Percentage of total calls that were successfully connected. |
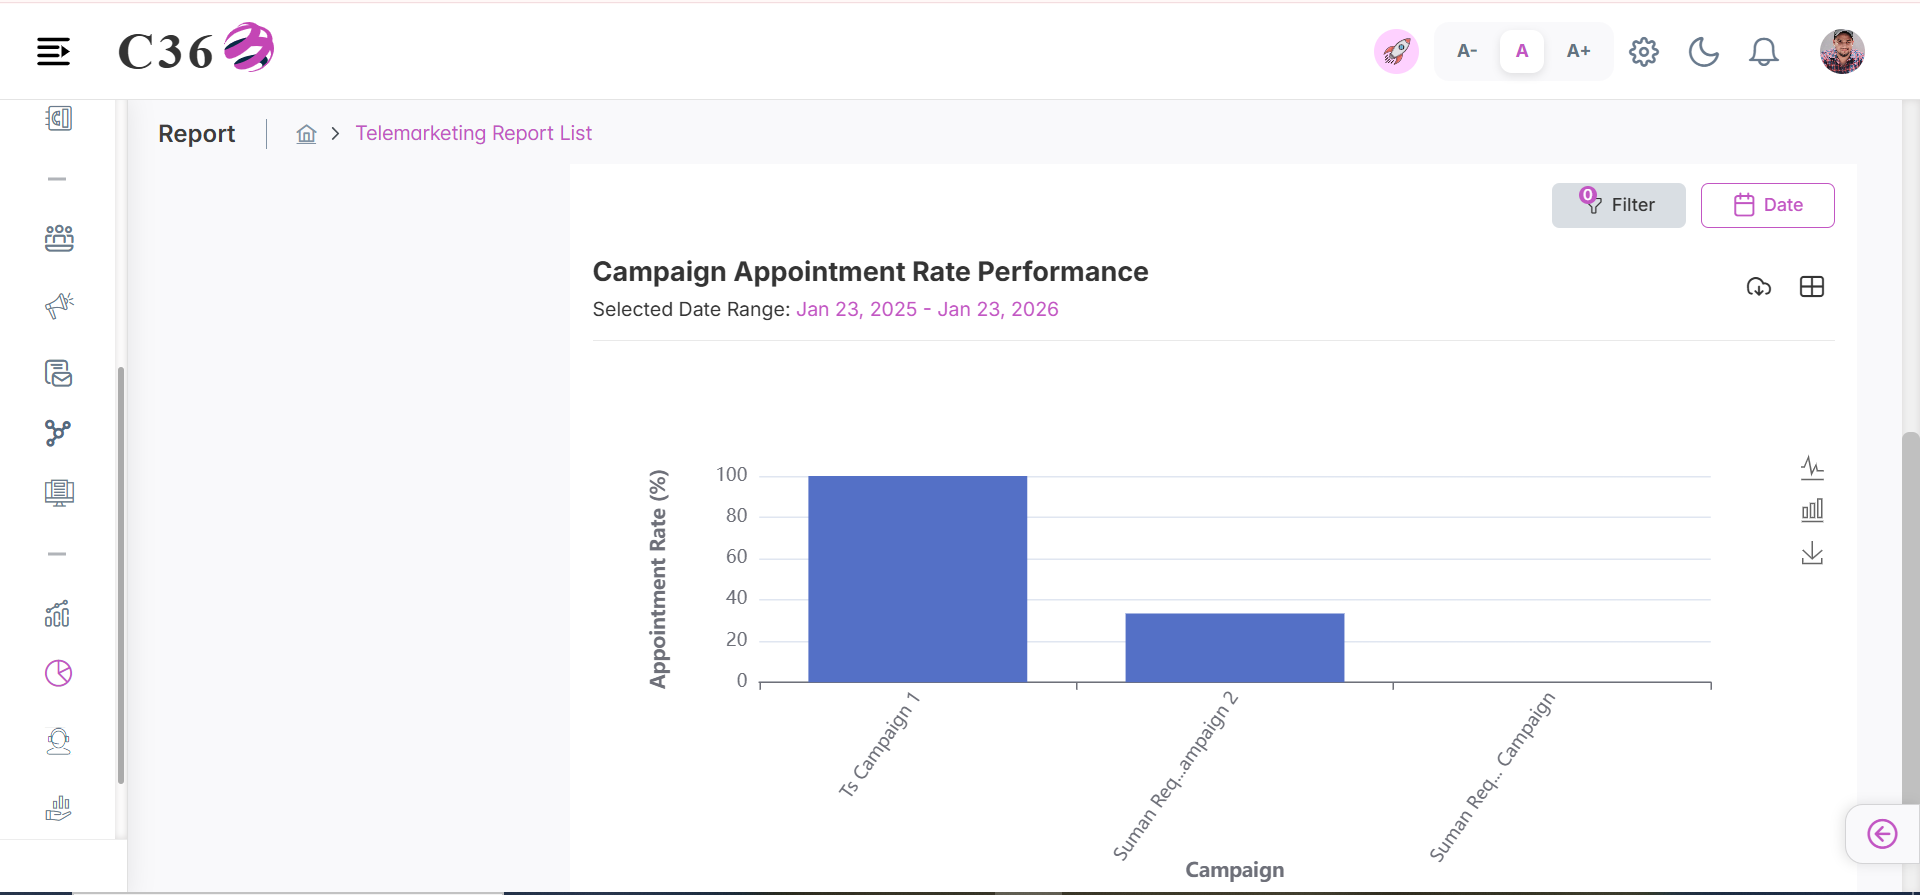
📝 Campaign Appointment Rate Performance
A summary of appointment conversion rates by campaign, measuring effectiveness in turning connected calls into scheduled appointments.Click to see quick actions
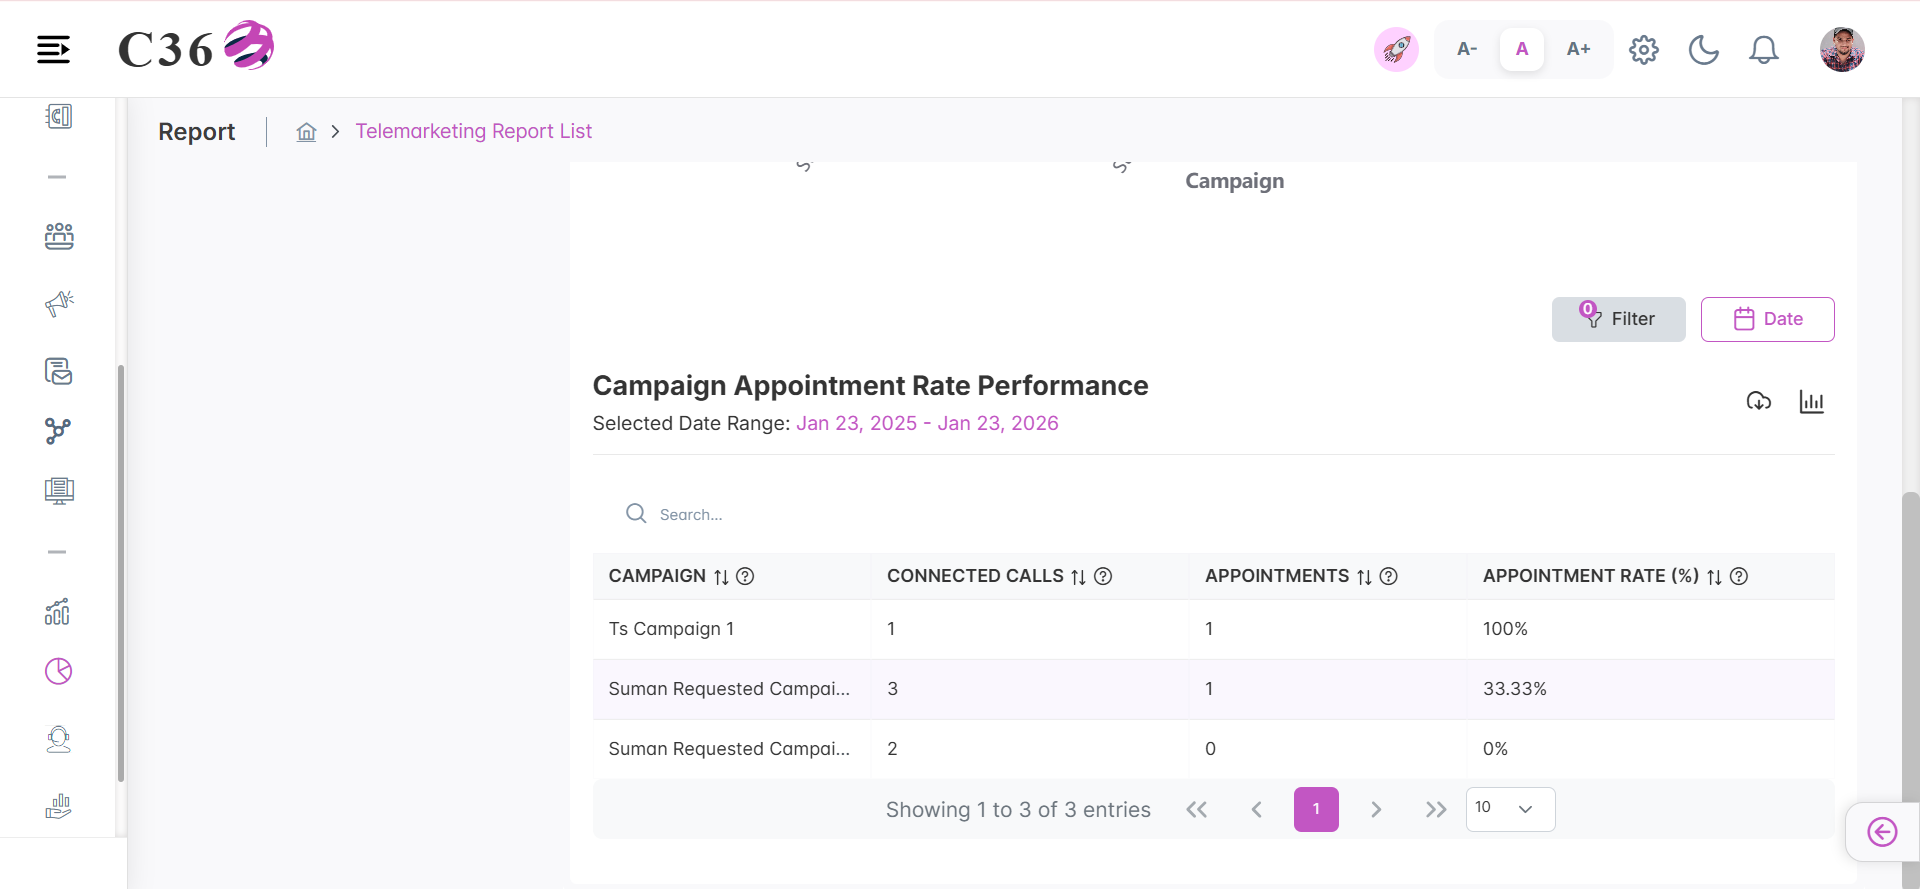
🧾 Columns included in the table view.
| Column | Description |
|---|---|
| Campaign | Name of the campaign. |
| Connected Calls | Number of calls successfully connected. |
| Appointments | Total number of appointments scheduled. |
| Appointment Rate (%) | Percentage of connected calls that resulted in scheduled appointments. |
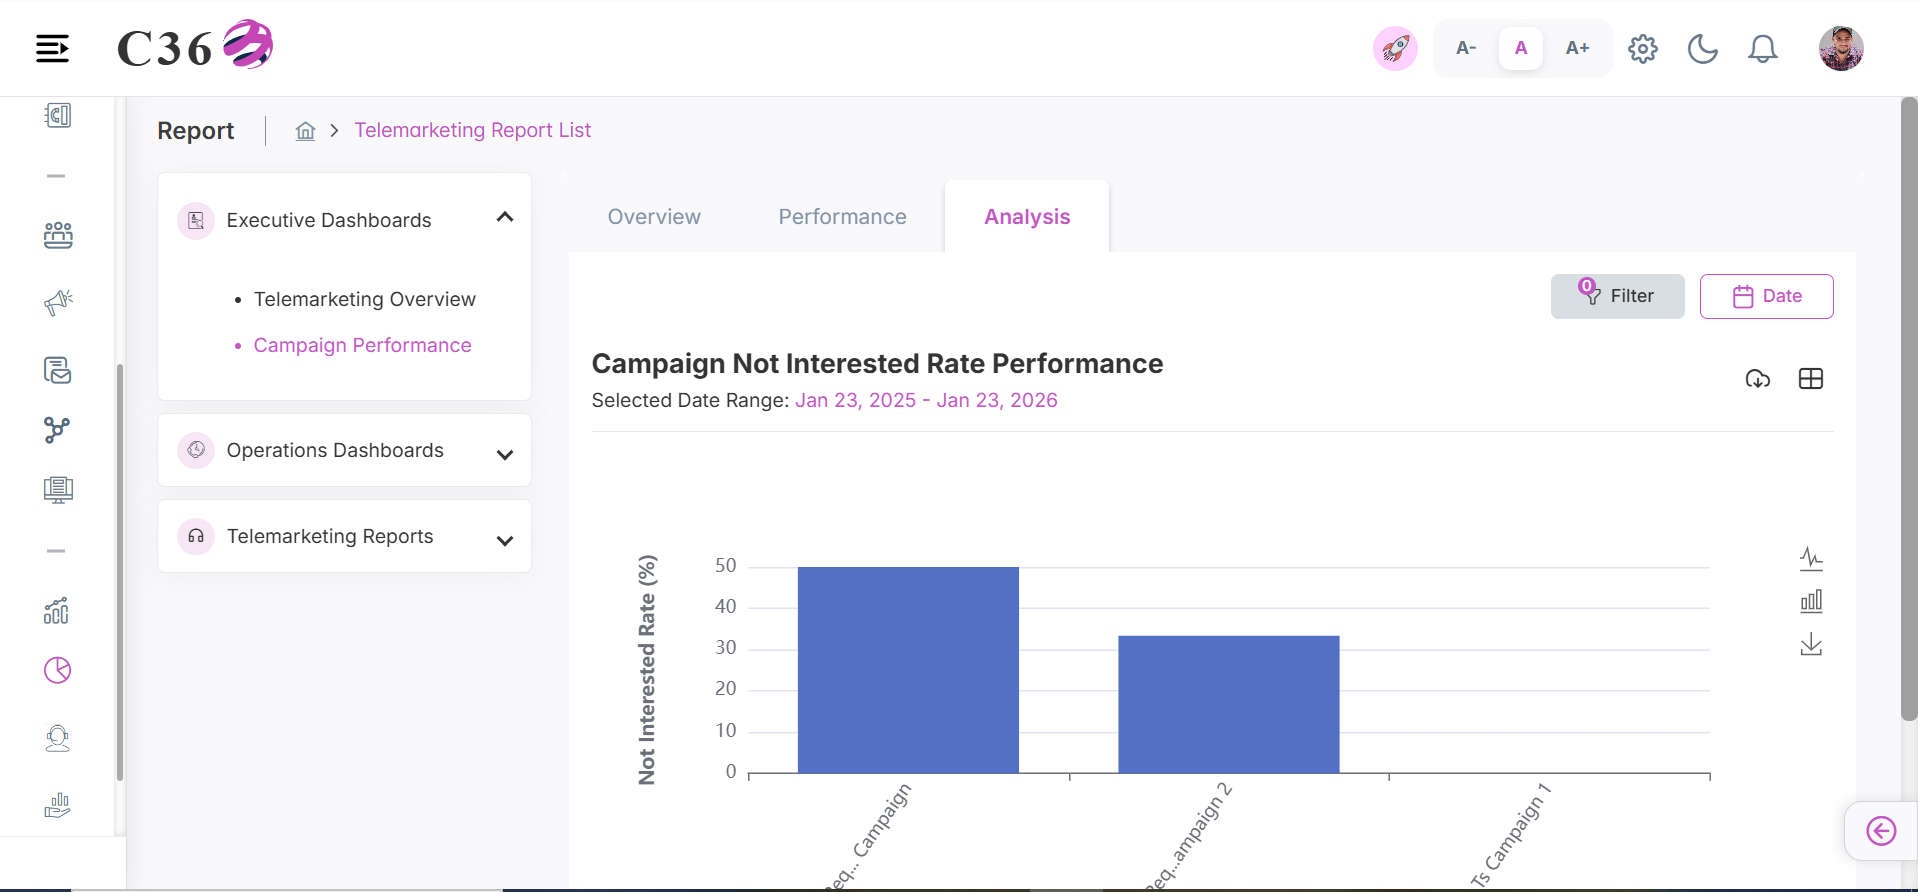
🙉 Campaign Not Interested Rate Performance
A summary of the percentage of contacts marked as not interested across campaigns, indicating lead quality and messaging effectiveness.Click to see quick actions
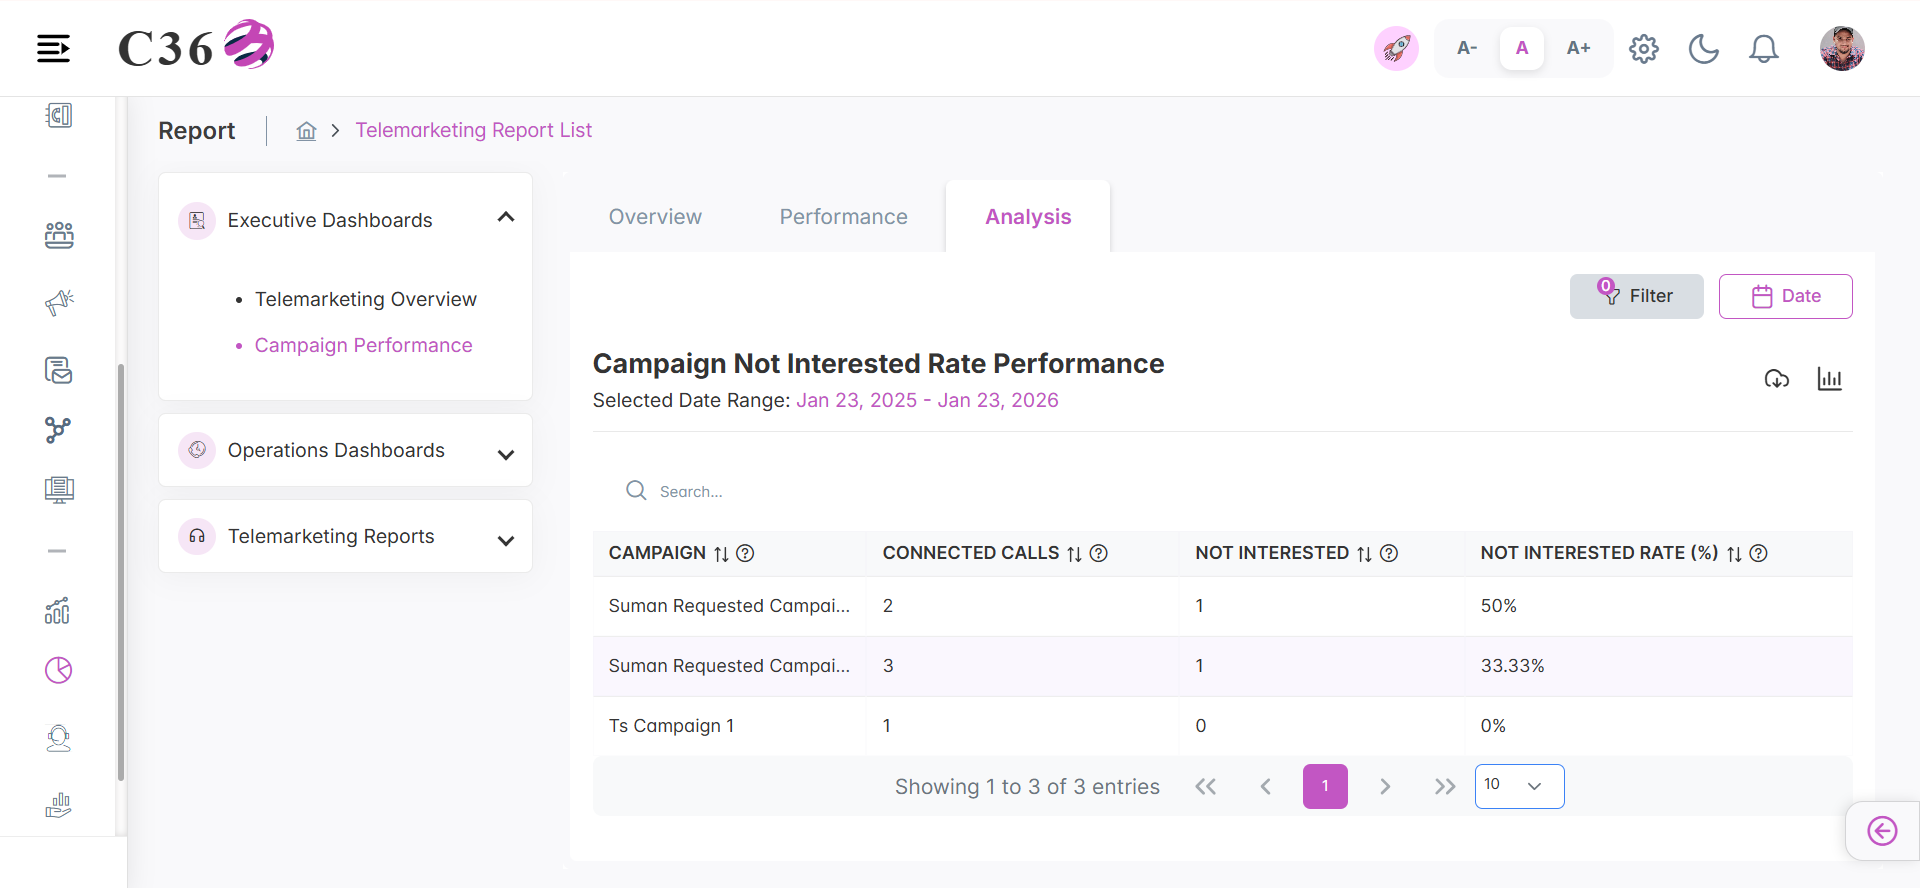
🧾 Columns included in the table view.
| Column | Description |
|---|---|
| Campaign | Name of the campaign. |
| Connected Calls | Number of calls successfully connected. |
| Not Interested | Number of calls marked as not interested. |
| Not Interested Rate (%) | Percentage of connected calls that resulted in a not interested outcome. |
━━━━━━━━━━━━━━━━━━━━━━━━━━━━━━━━━━━━━━━━━━━━━━━━━━━━━━━━━━━━━━━━━━━━━━━━━━━━━━━━━━━━━
⚙️ Operation Dashboard
👨💼 Agent Performance
- 📈 Overview
- 📊 Analysis
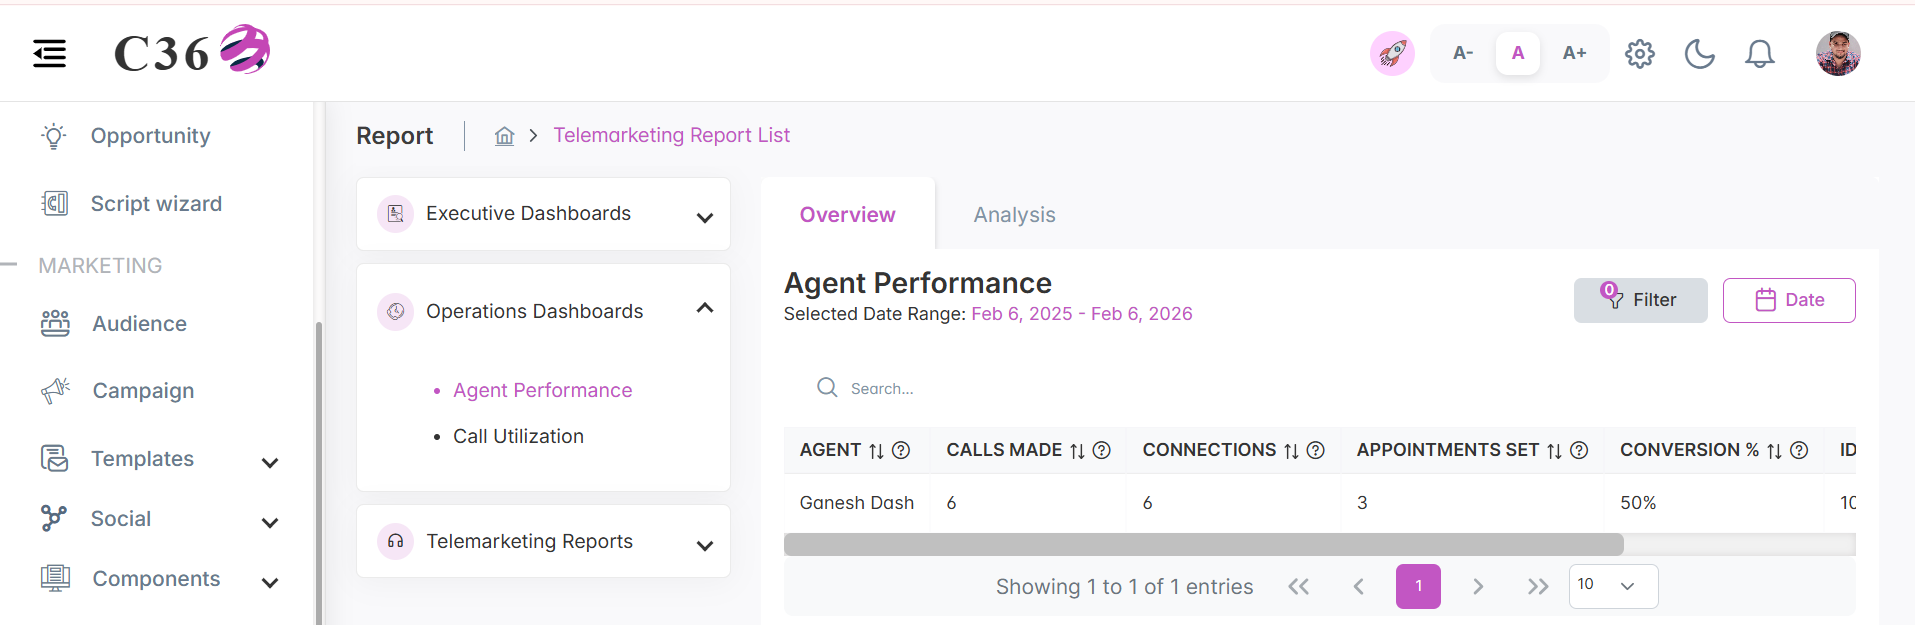
👥 Agent Performance Overview
An in-depth look at individual agent performance metrics, including call volume, connection success, and appointment generation.Click to see quick actions
🧾 Columns included in the table view.
| Column | Description |
|---|---|
| Agent | Full name of the telemarketing agent. |
| Calls Made | Total number of calls attempted by the agent. |
| Connections | Number of calls successfully connected. |
| Appointments Set | Total number of appointments scheduled. |
| Conversion (%) | Percentage of connections that resulted in appointments (appointments ÷ connections * 100) |
| IDLE/Under-Utilization (%) | Percentage of calling window time not utilized for calls(100-Utilization %). |
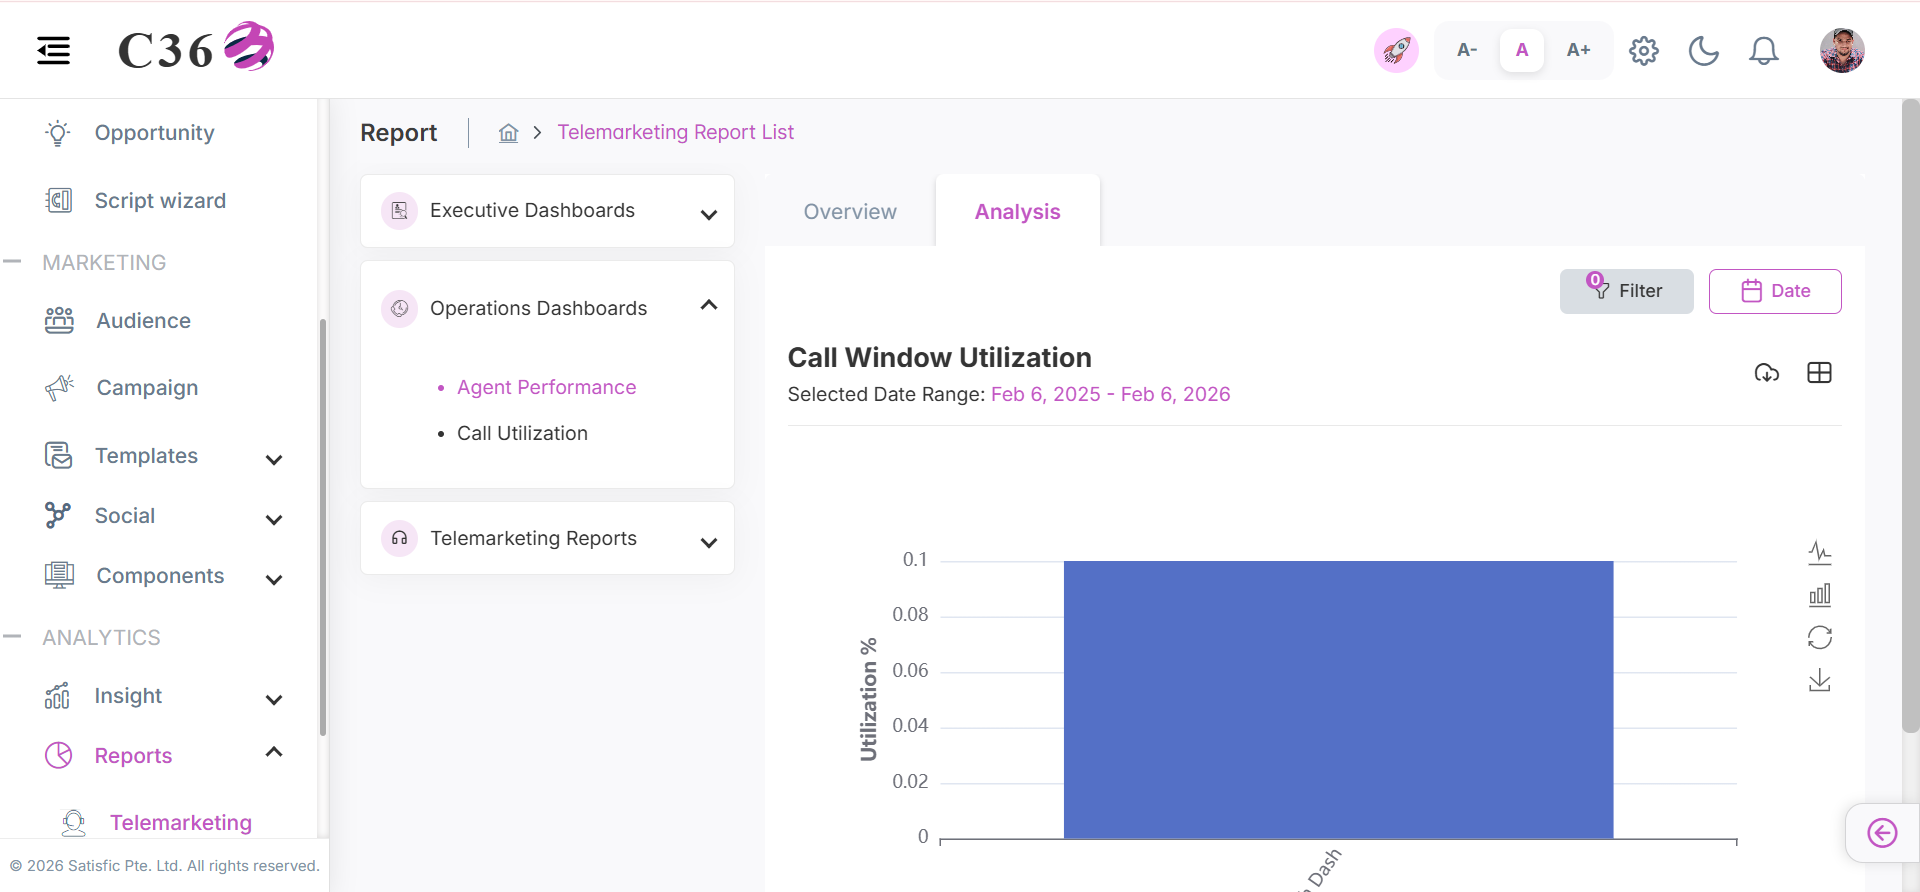
🖼️ Call Window Utilization
Analysis of call connectivity and success rates across different time windows to optimize calling schedules.Click to see quick actions
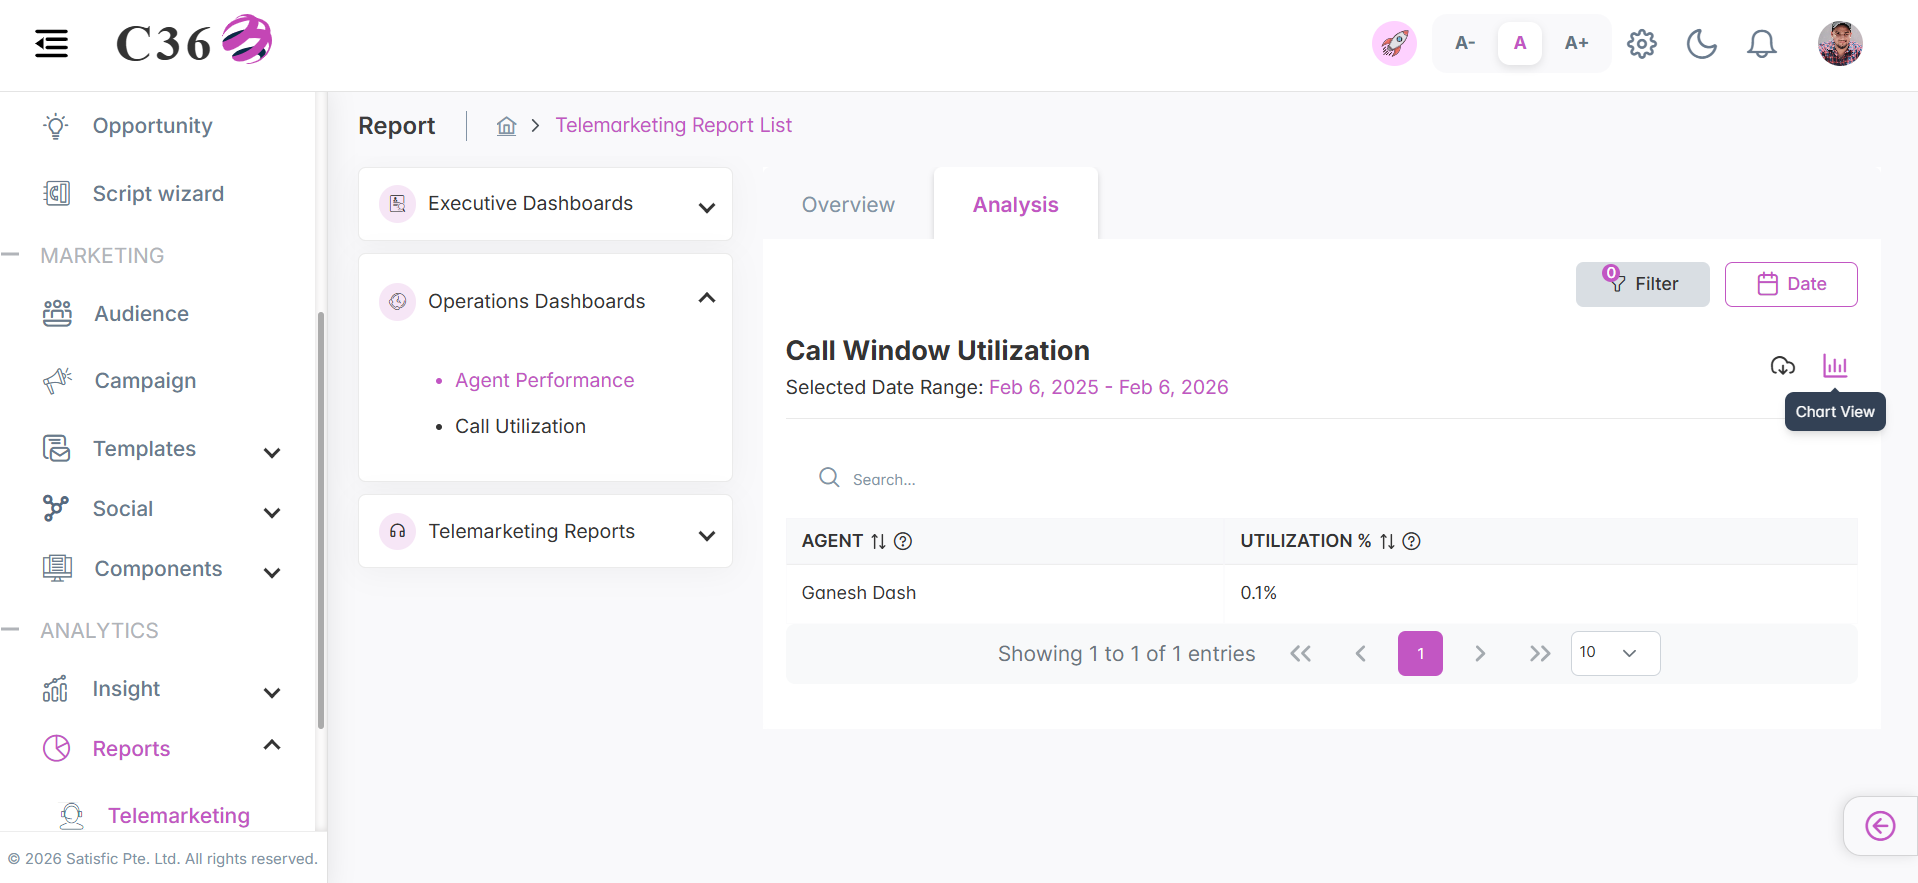
🧾 Columns included in the table view.
| Column | Description |
|---|---|
| Agent | Name of the telemarketing agent. |
| Utilization | Percentage of calling window time utilized for making calls. |
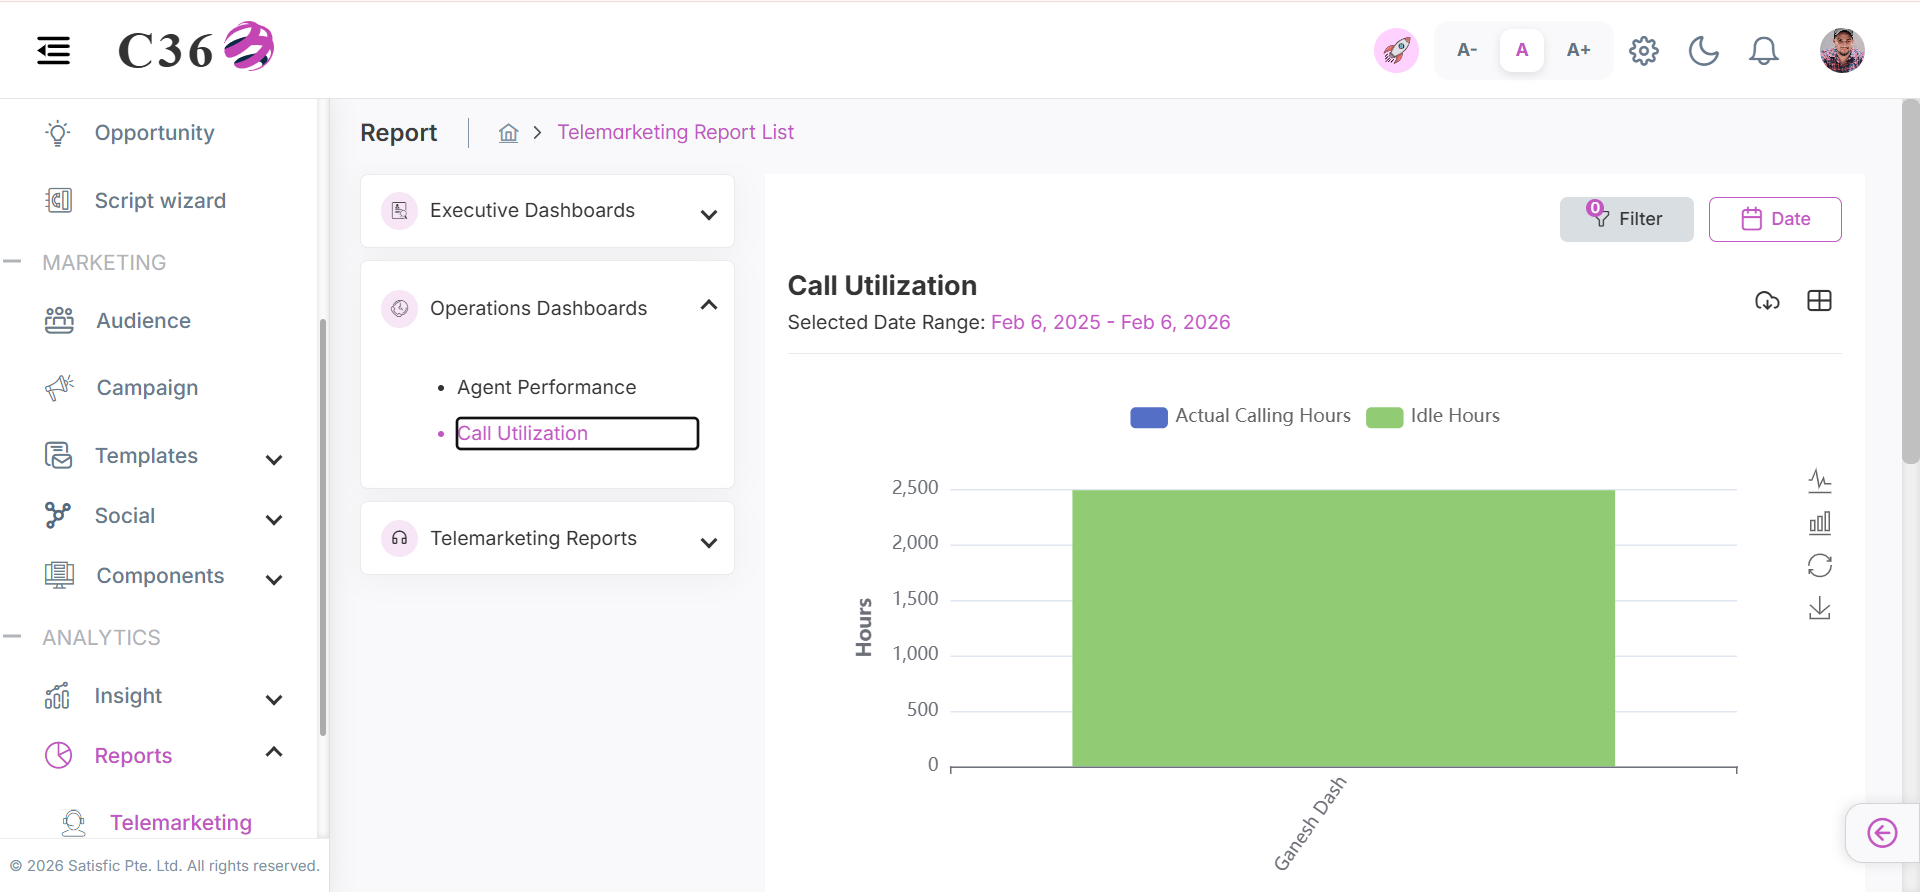
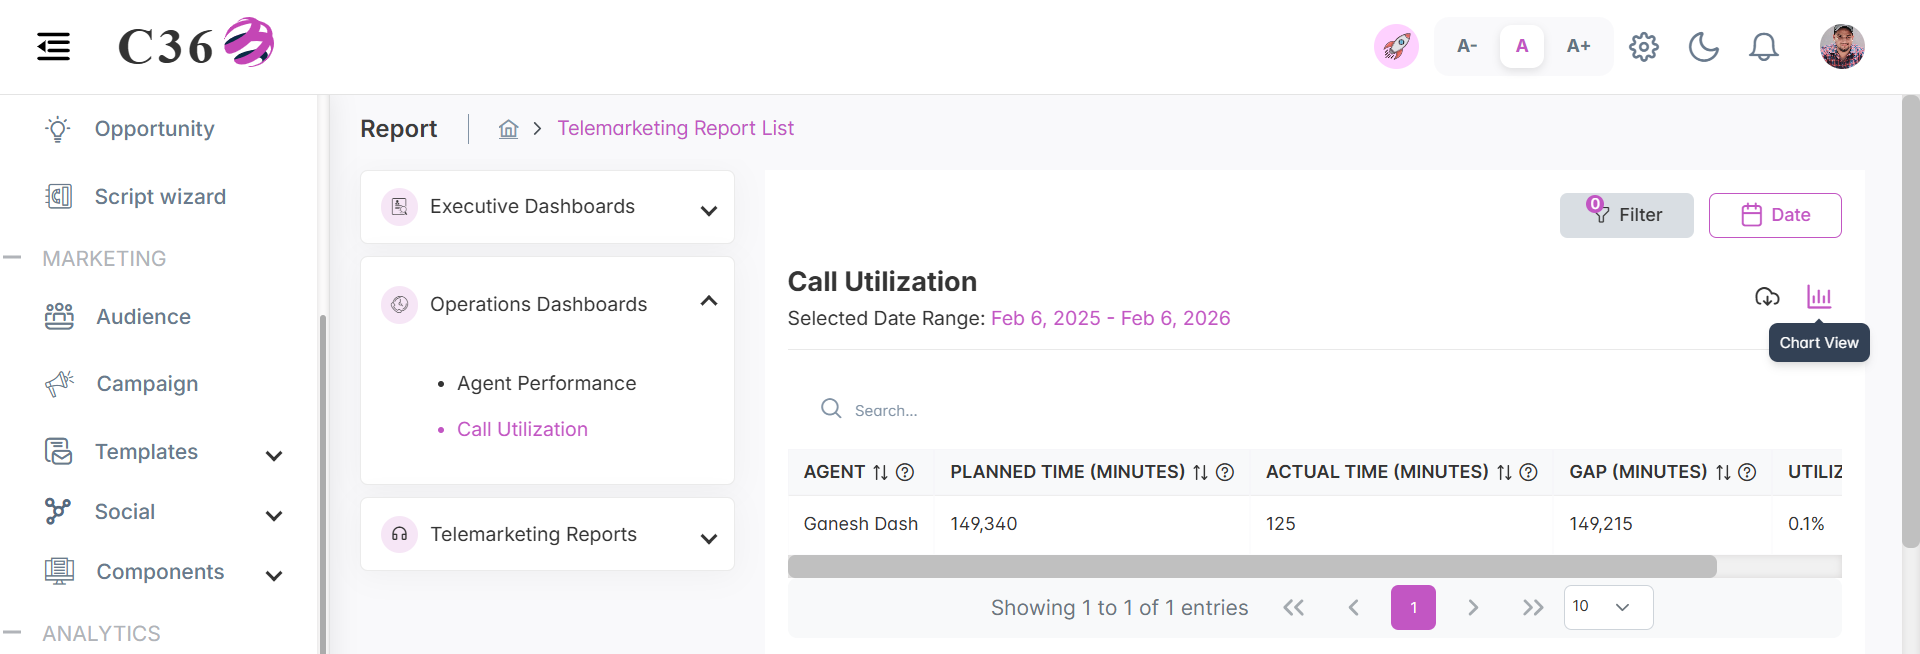
⏱️ Call Utilization
⏳ Call Utilization
A breakdown of how agents utilize their time during login sessions, categorizing time into working, talk, idle, and break states.
Click to see quick actions
- Can Toggle between Line chart and Bar chart. - Can Toggle between Table view and Chart view. - Can perform Search in table view. - Can Export/Download the report. - Can save the Chart as image. - Can Filter by Date Range. - Can Filter by Campaign and Users.
🧾 Columns included in the table view.
| Column | Description |
|---|---|
| Agent | Full name of the agent. |
| Planned Time (Minutes) | Total calling window time available based on agent schedule. |
| Actual Time (Minutes) | Actual times spent on calls based on call duration. |
| Gap Time (Minutes) | Difference between planned and actual calling time. |
| Utilization (%) | Percentage of planned calling time actually used (actual ÷ planned * 100). |
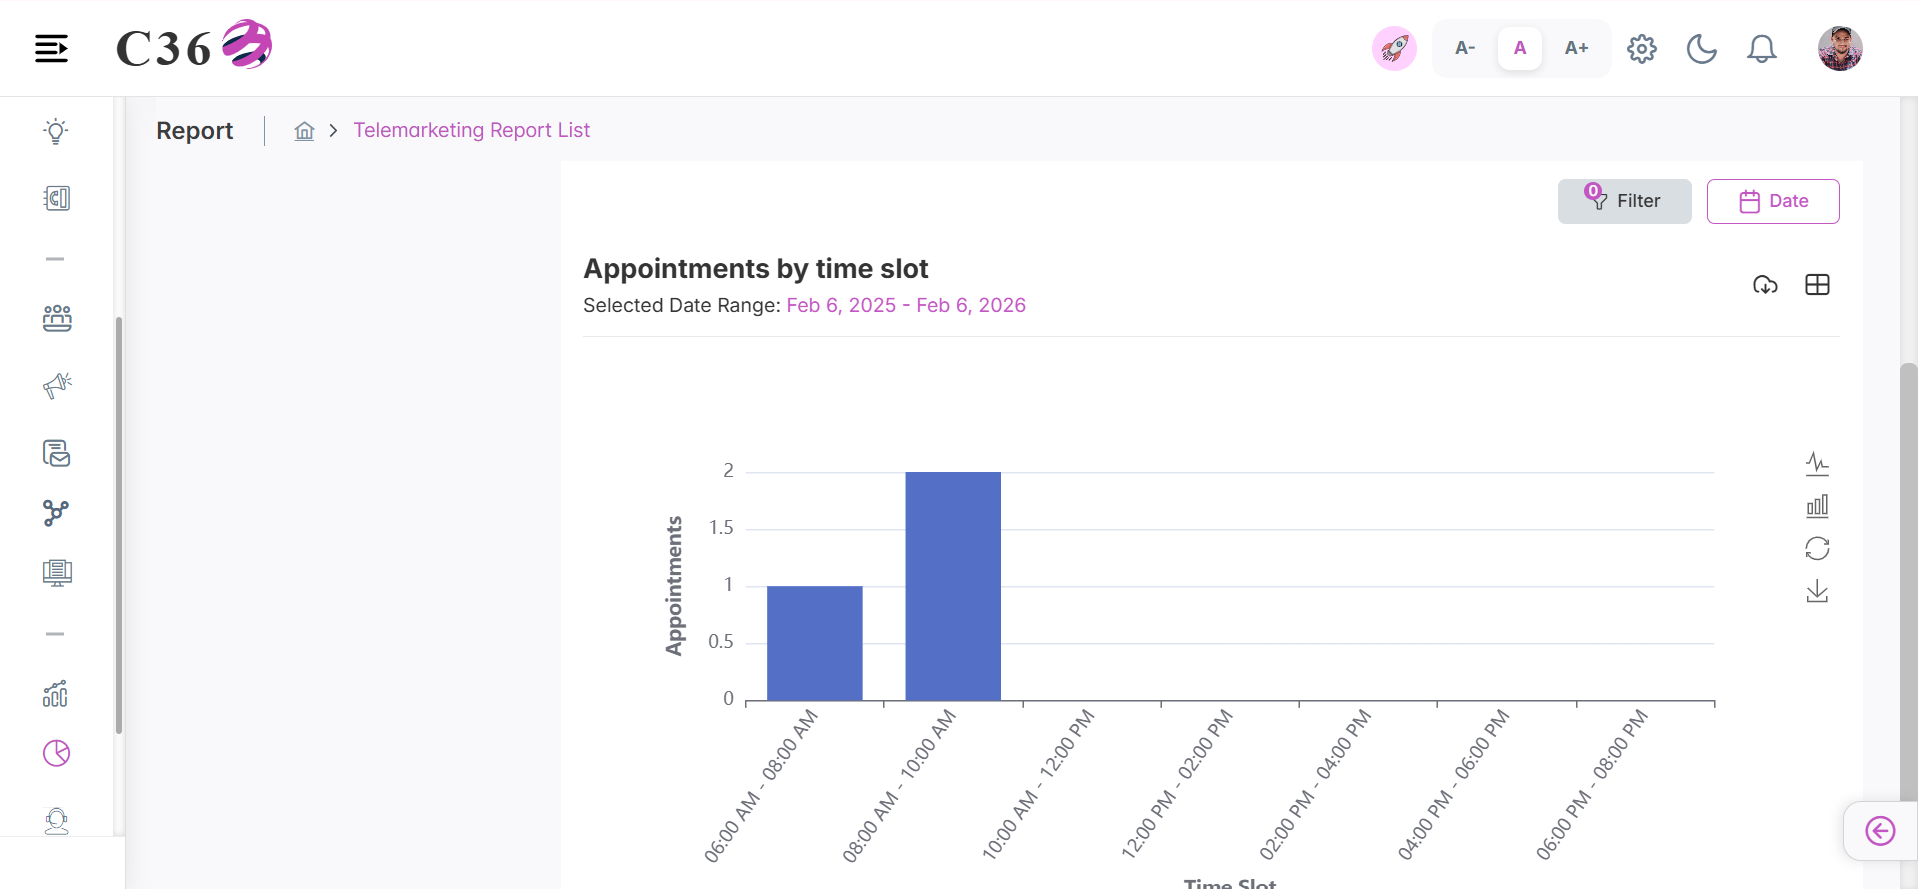
⏰ Appointments by time slot
Distribution of scheduled appointments across different time slots to identify peak booking times.
Click to see quick actions
- Can Toggle between Line chart and Bar chart. - Can Toggle between Table view and Chart view. - Can perform Search in table view. - Can Export/Download the report. - Can save the Chart as image. - Can Filter by Date Range. - Can Filter by Campaign and Users.
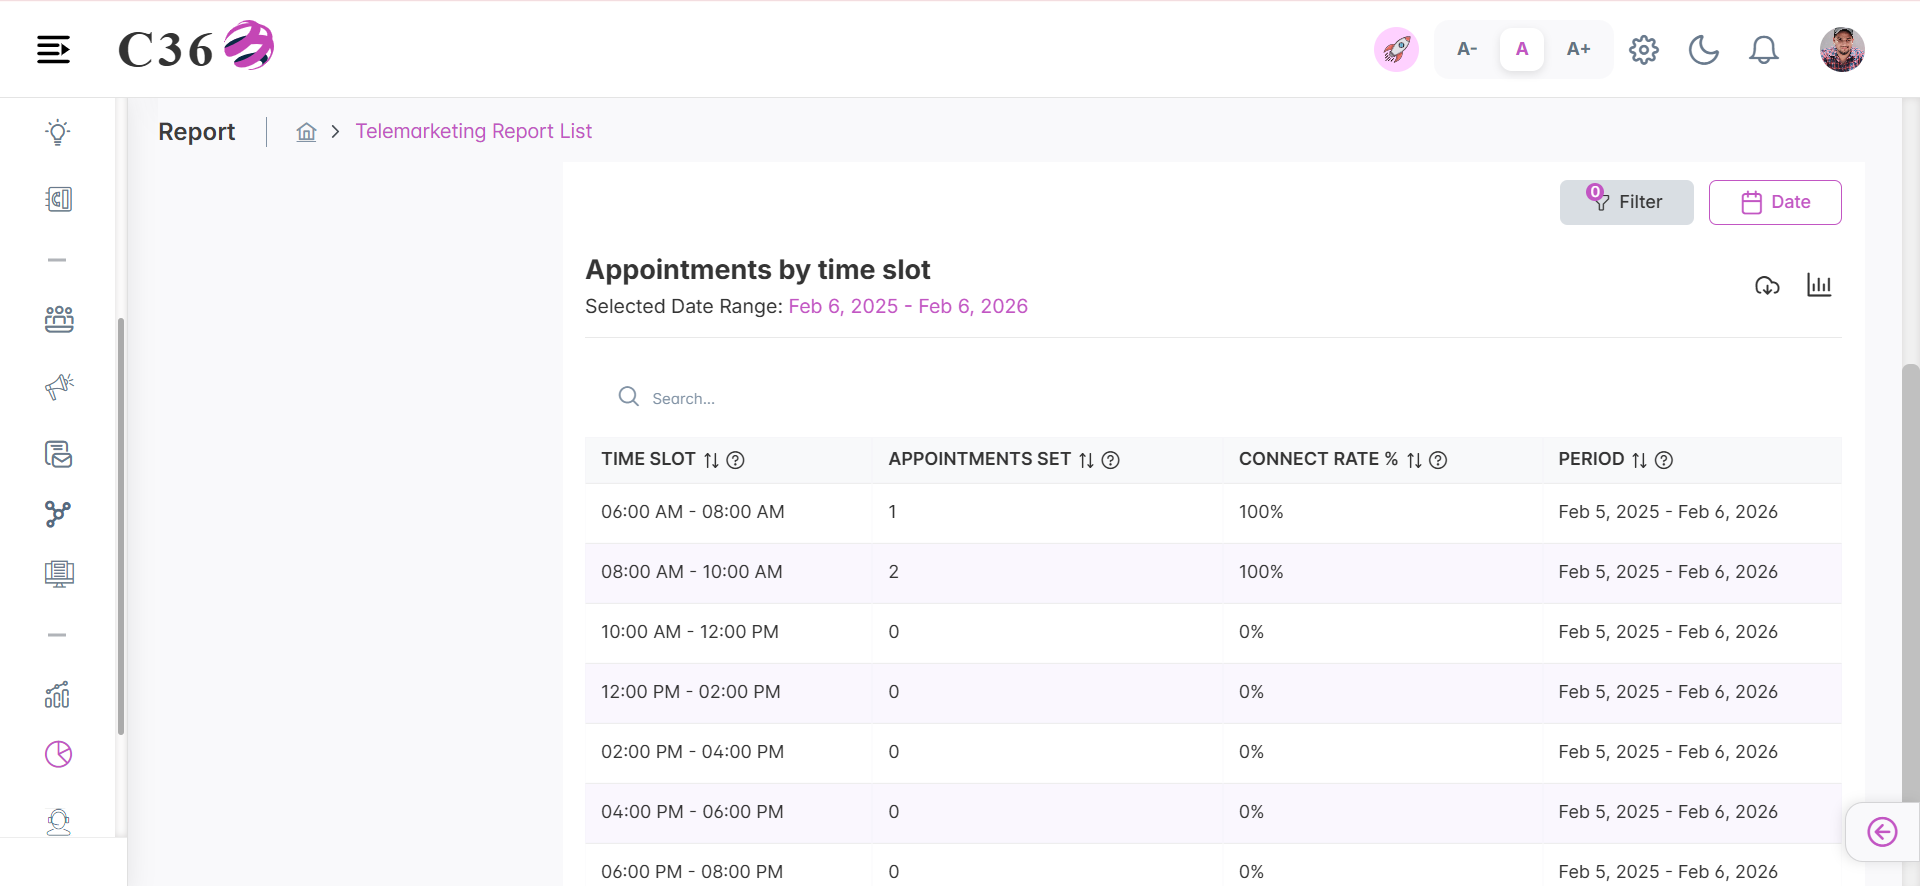
🧾 Columns included in the table view.
| Column | Description |
|---|---|
| Time Slot | 2-hour time block(e.g., 9-11, 11-13) |
| Appointments Set | Number of appointments scheduled during in this time slot. |
| Connect Rate (%) | Percentage of calls that connected during this timeslot. |
| Period | Date range of the report. |
━━━━━━━━━━━━━━━━━━━━━━━━━━━━━━━━━━━━━━━━━━━━━━━━━━━━━━━━━━━━━━━━━━━━━━━━━━━━━━━━━━━━━
📑 Telemarketing Reports
📞 Telemarketing Overview
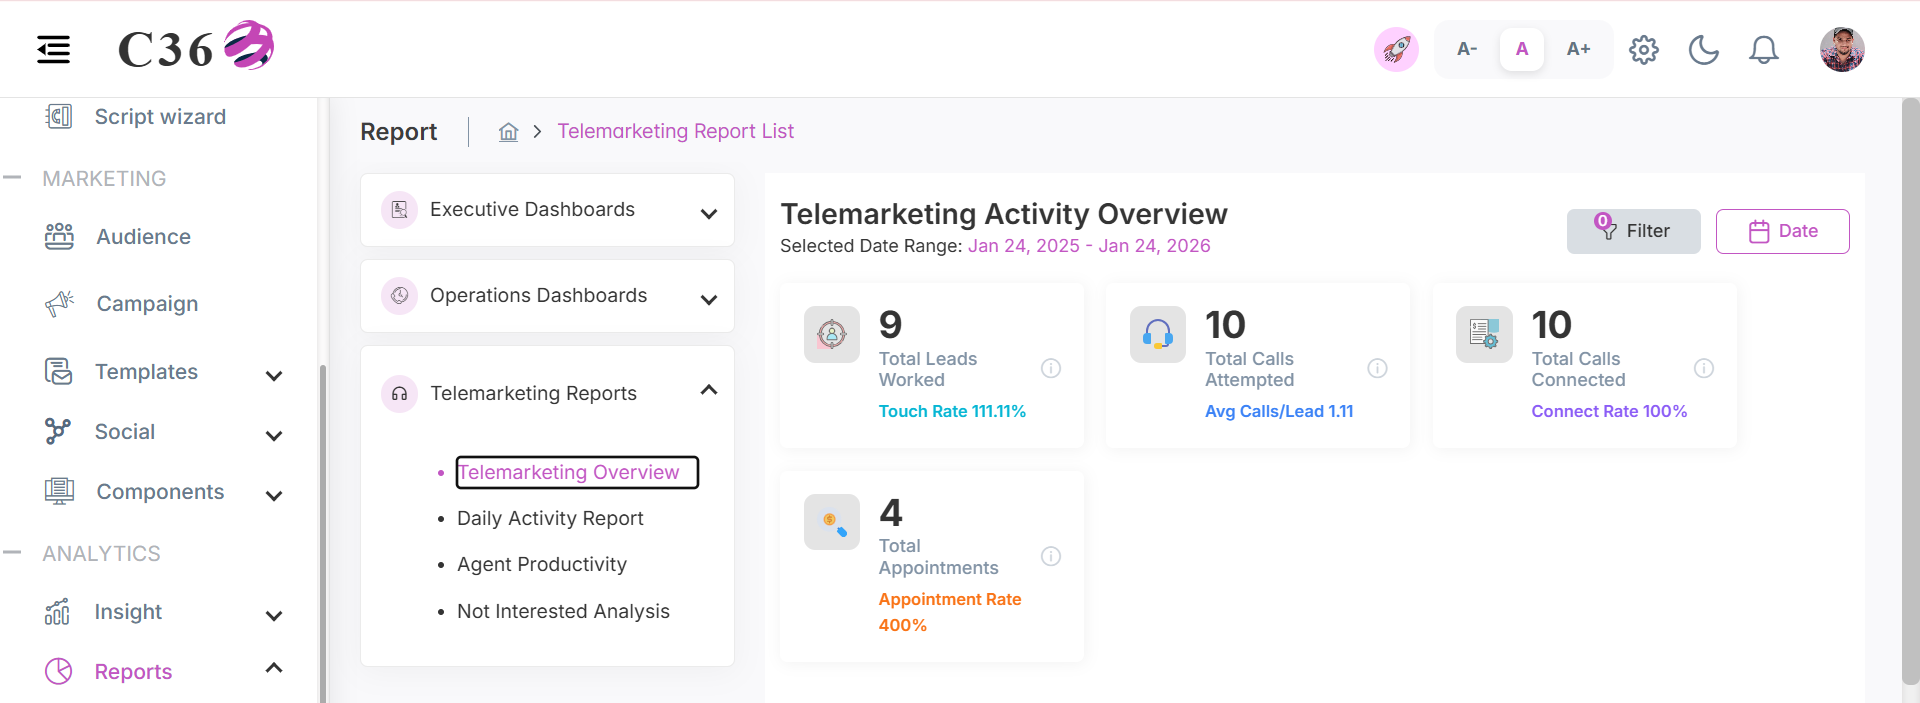
📋 Telemarketing Activity Overview
A snapshot of overall telemarketing activity, summarizing call volume, agent effort, and key operational metrics.
- Total Leads Worked: Total number of unique leads that agents have worked on.
- Total Calls Attempted: Total number of calls that agents have attempted to make.
- Total Calls Connected:Total number of calls that agents have successfully connected.
- Total Appointments: Total appointments scheduled by agents.
Click to see quick actions
- Hover on the "i" icon to see the tooltip. - Filter by Date Range. - Filter by Campaign and Users.
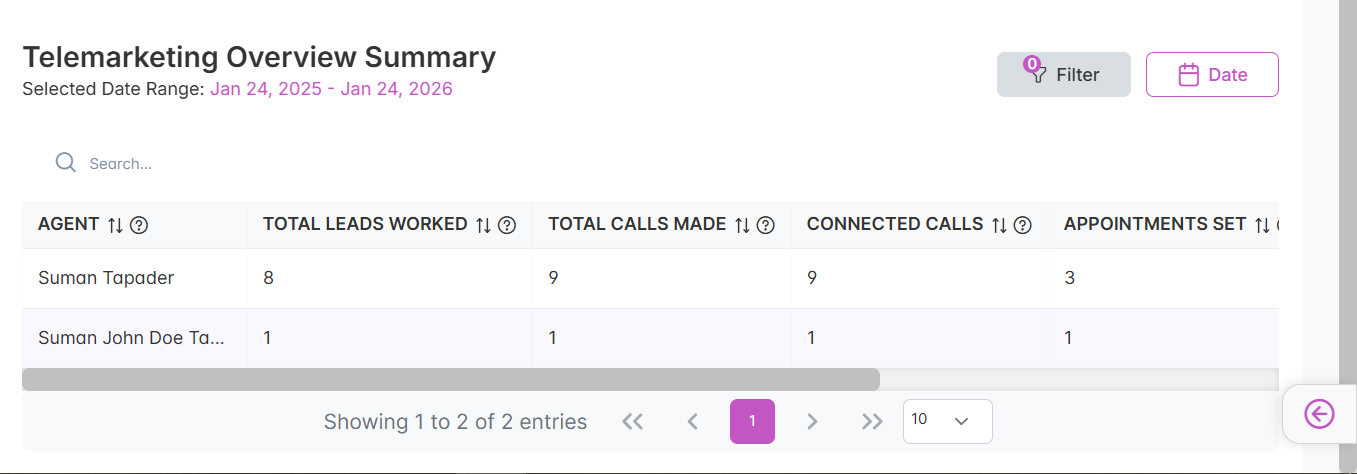
📝 Telemarketing Overview Summary
A brief summary of overall telemarketing performance, highlighting key activity metrics and outcome trends.
Click to see quick actions
- Hover on the Help icon to see the tooltip. - Perform the search. - Filter by Date Range. - Filter by Campaign and Users.
🧾 Columns included in the table view.
| Column | Description |
|---|---|
| Agents | Name of the telemarketing agent. |
| Total Lead Worked | Number of unique leads worked by the agent. |
| Total Calls Made | Total number of calls attempted by the agent. |
| Connected Calls | Number of calls successfully connected. |
| Appointments Set | Total number of appointments scheduled by the agent. |
| Connect Rate (%) | Percentage of attended calls that were successfully connected. |
| Appointment Rate (%) | Percentage of connected calls that resulted in scheduled appointments. |
📅 Daily Activity Report
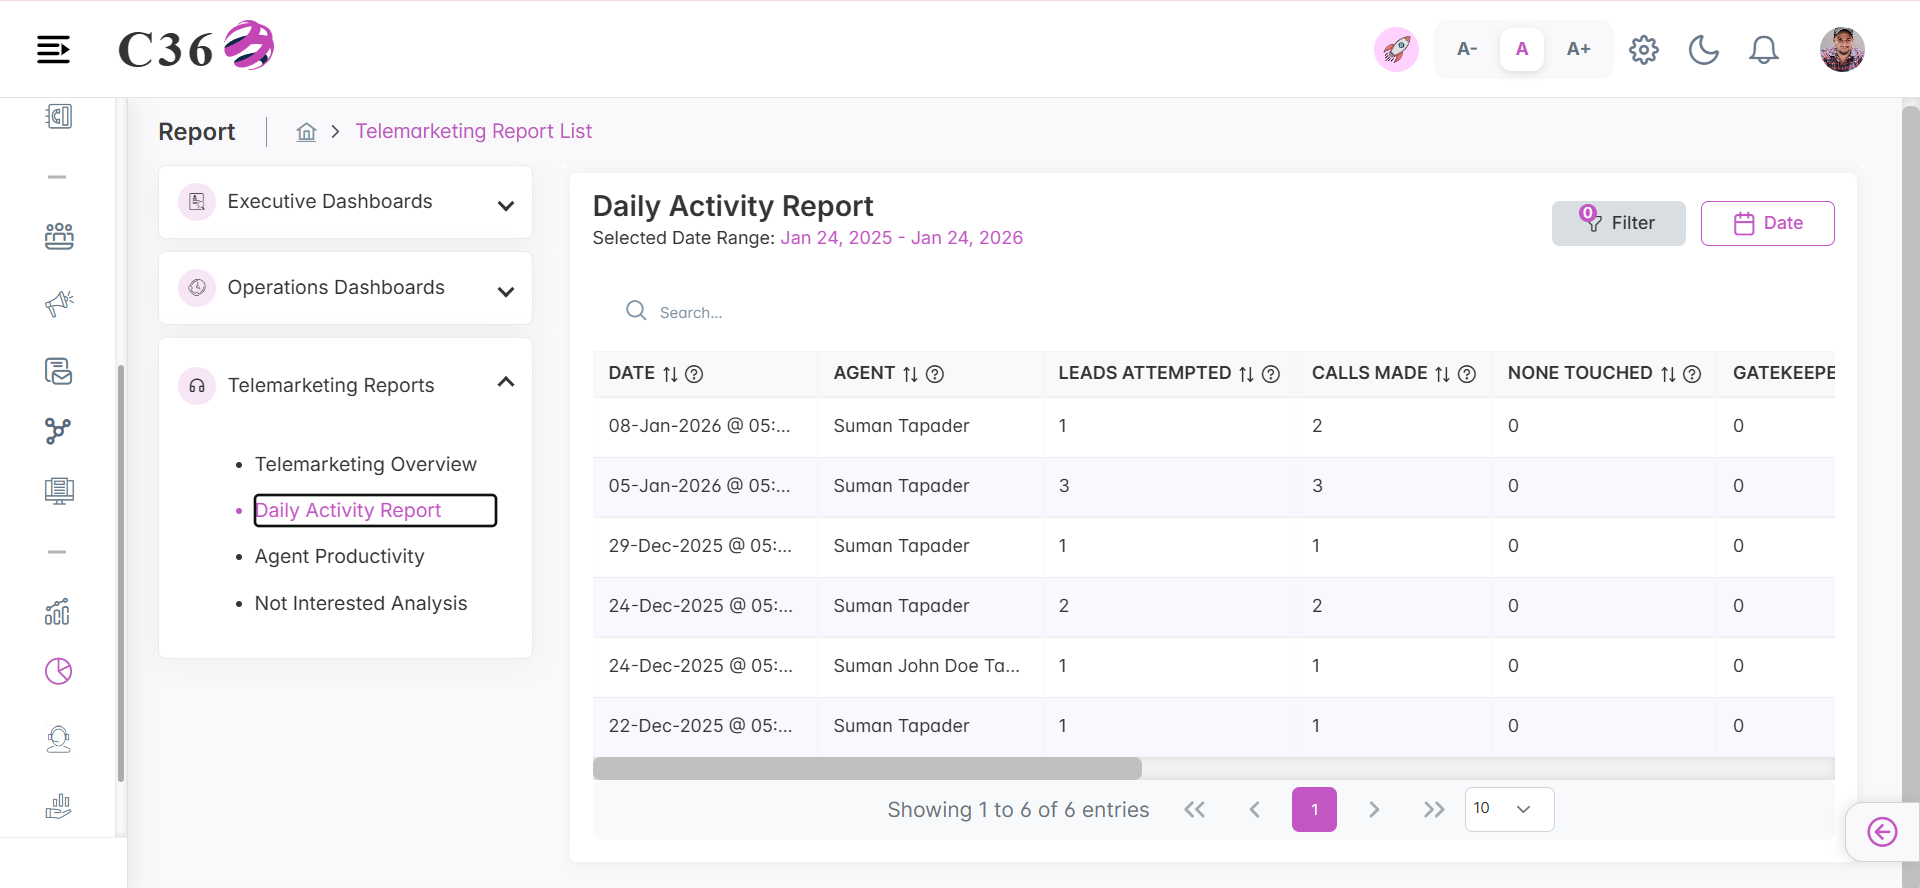
A concise summary of daily activities, highlighting key actions, productivity, and performance outcomes.
Click to see quick actions
- Hover on the Help icon to see the tooltip. - Perform the search. - Filter by Date Range. - Filter by Campaign and Users.
🧾 Columns included in the table view.
| Column | Description |
|---|---|
| Date | Date on which the telemarketing activity was performed. |
| Agent | Name of the agent. |
| Leads Attempted | Number of unique leads attempted by the agent. |
| Calls Made | Total number of calls made by the agent. |
| None Touched | Calls where no meaningful interaction occurred. |
| Gatekeeper Touched | Calls where gatekeeper was contacted instead of the prospect. |
| Prospects Touched | Calls where the intended prospect was successfully contacted. |
| MQL | Number of leads that progressed to Marketing Qualified Lead (MQL) stage. |
| Appointments Set | Number of the appointments scheduled by the agent. |
| Asked to callback | Number of calls where the prospect requested to call back. |
| Not Interested | Calls where the prospect expressed no interest. |
| Not Qualified | Calls resulted in disqualification of the lead. |
🚀 Agent Productivity
- 📈 Performance
- 📊 Analysis
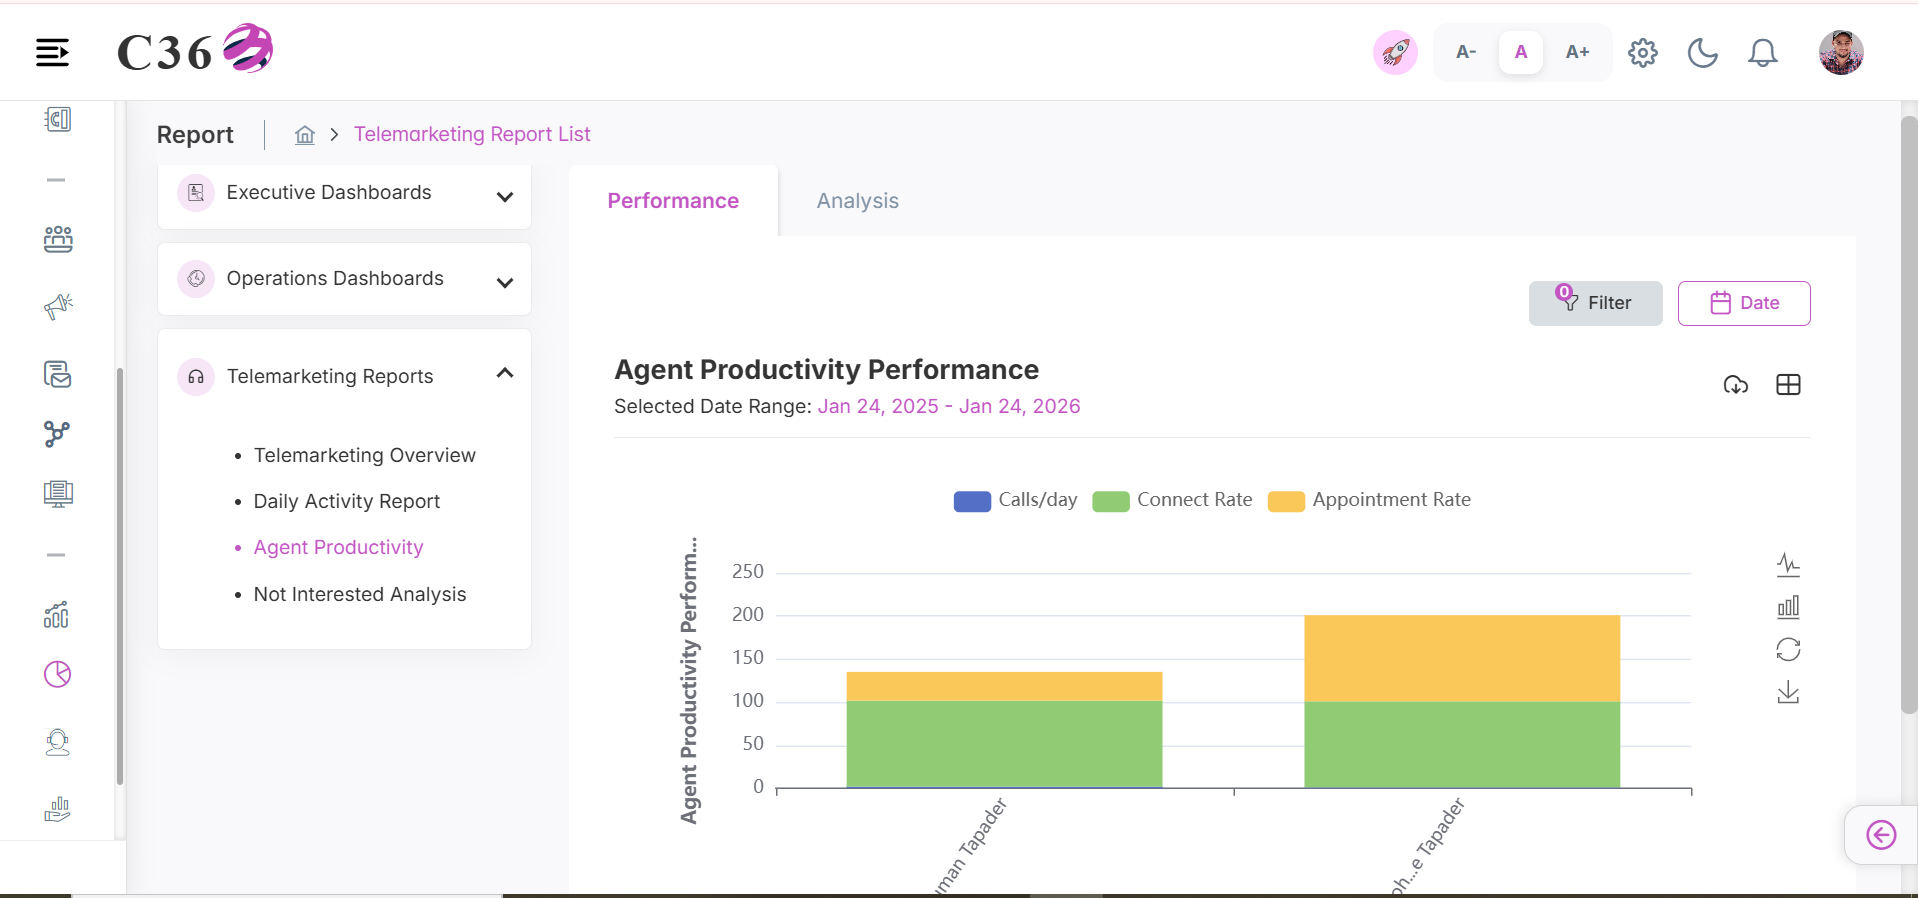
⚡ Agent Productivity Performance
A concise overview of agent efficiency, measuring output against time and activity to evaluate individual and team productivity.Click to see quick actions
- Hover on the Group Bar Chart to see the individual data points.
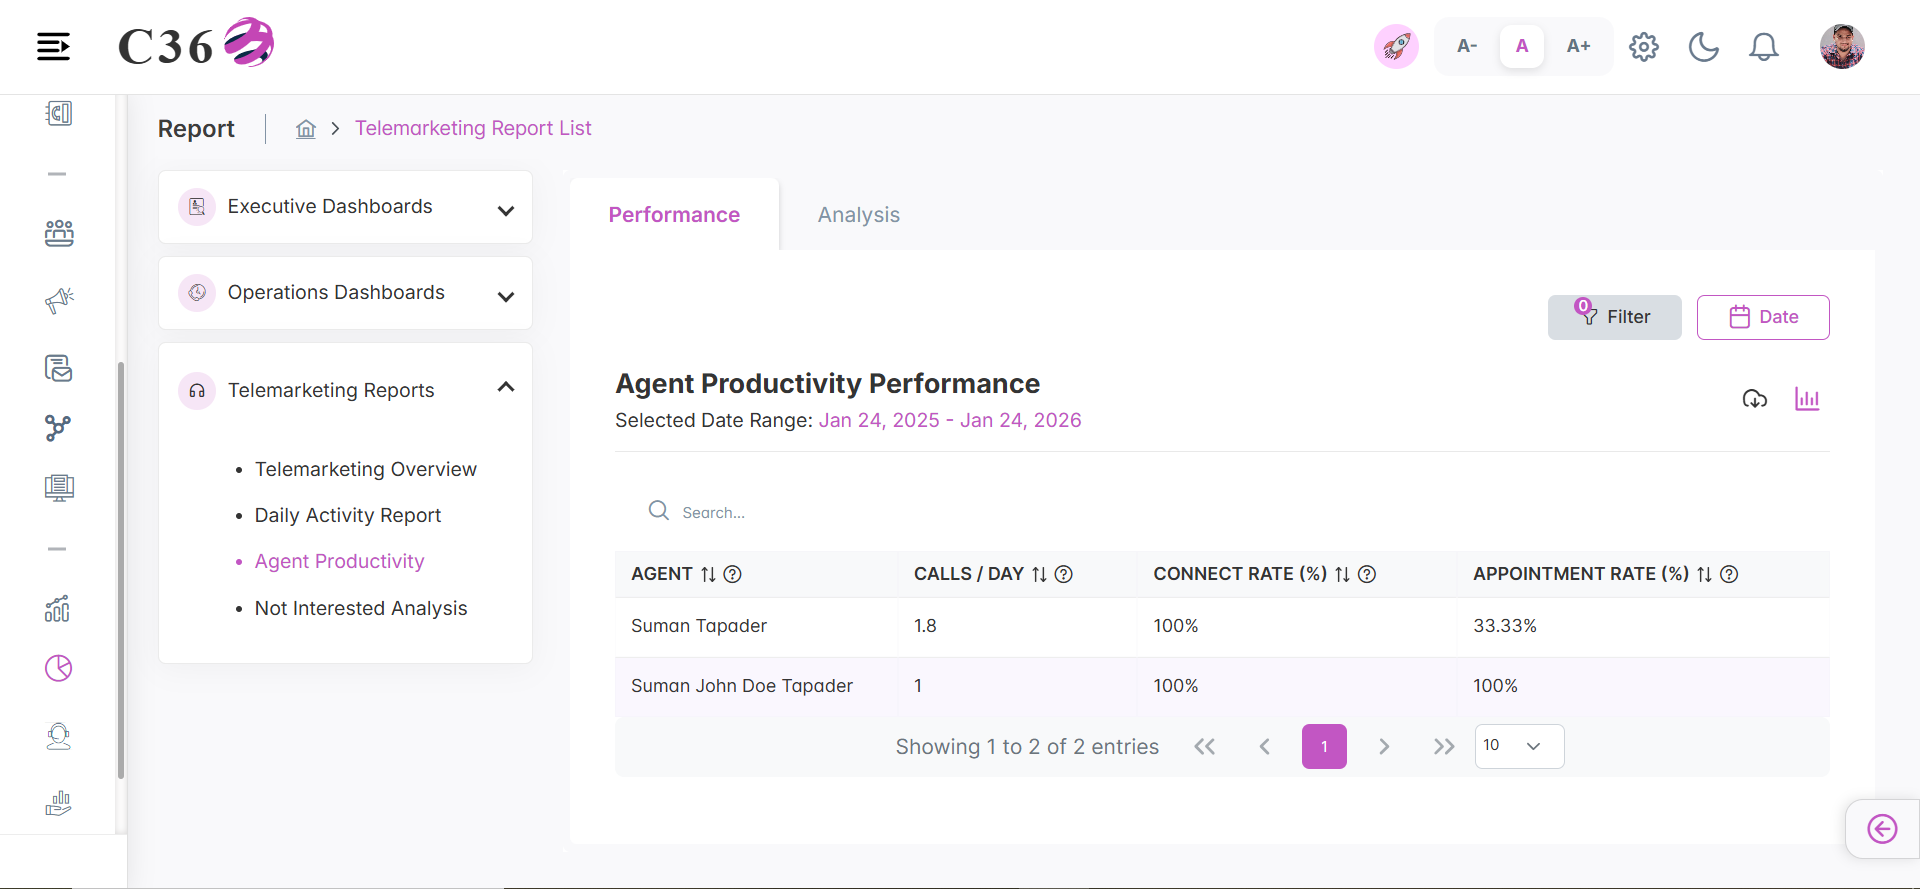
🧾 Columns included in the table view.
| Column | Description |
|---|---|
| Agent | Full name of the telemarketing agent. |
| Calls/Day | Average number of calls made per active working day. |
| Connected Rate | Percentage of attempted calls that were successfully connected. |
| Appointment Rate | Percentage of connected calls that resulted in scheduled appointments. |
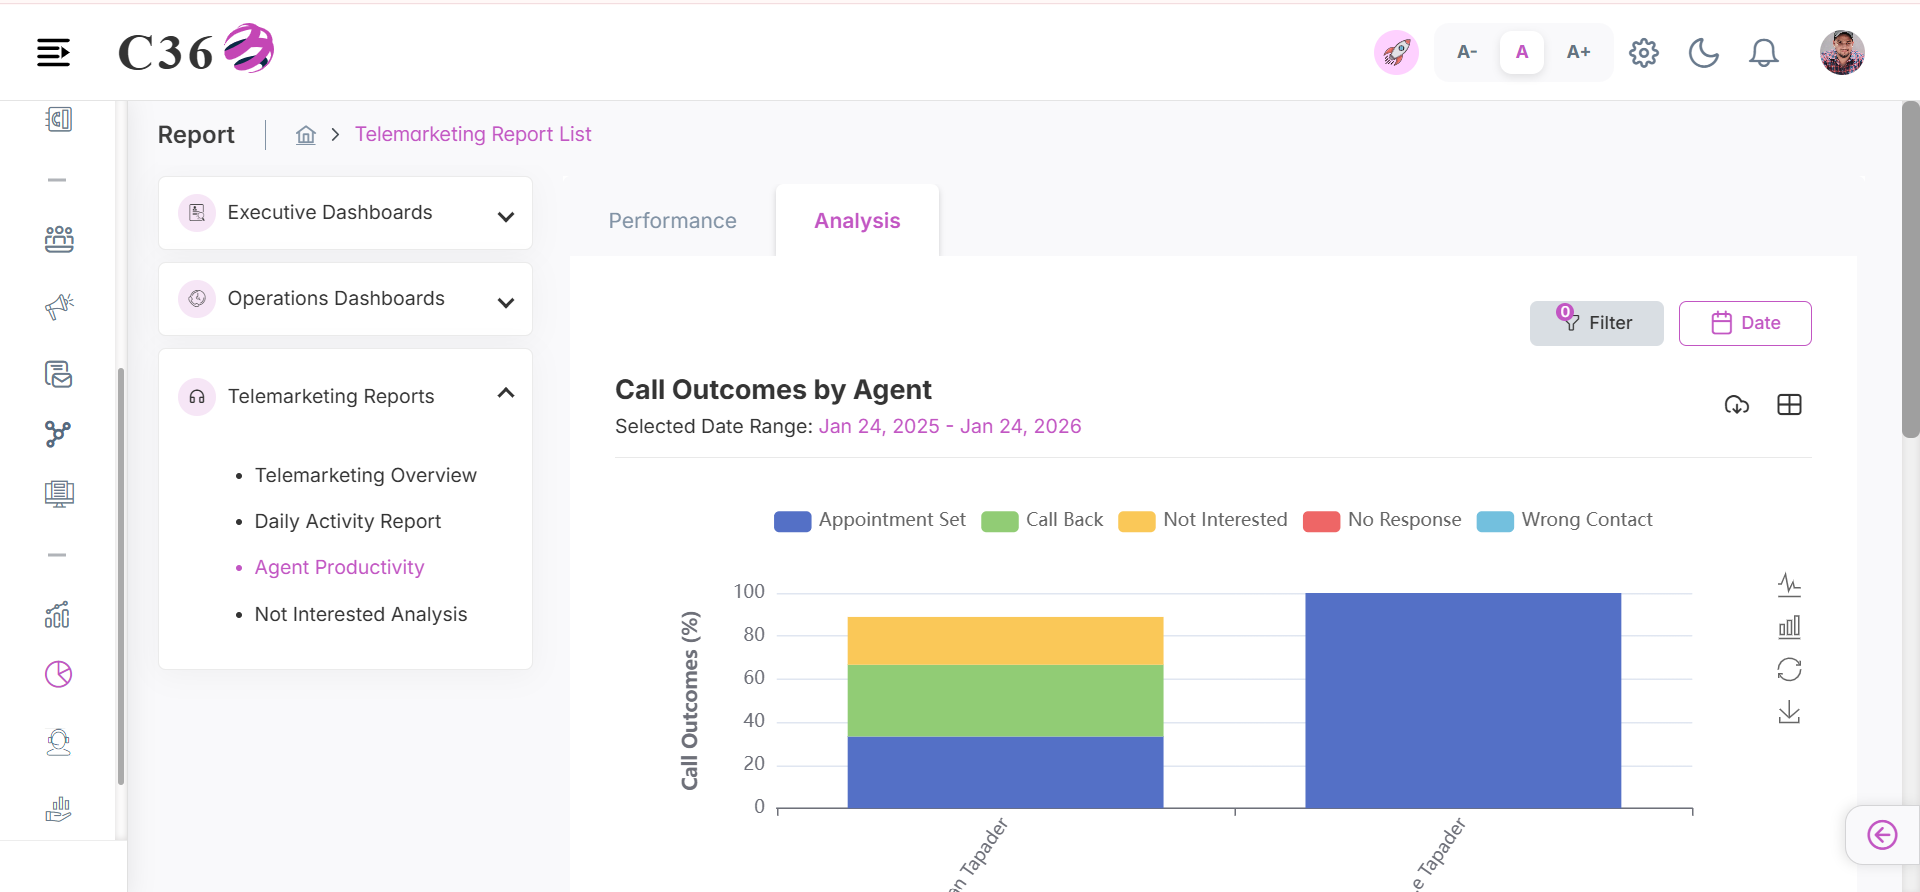
🏁 Call Outcomes by Agent
A clear summary of call result distribution by agent, highlighting performance trends, effectiveness, and outcome consistency.Click to see quick actions
- Hover on the Group Bar Chart to see the individual data points.
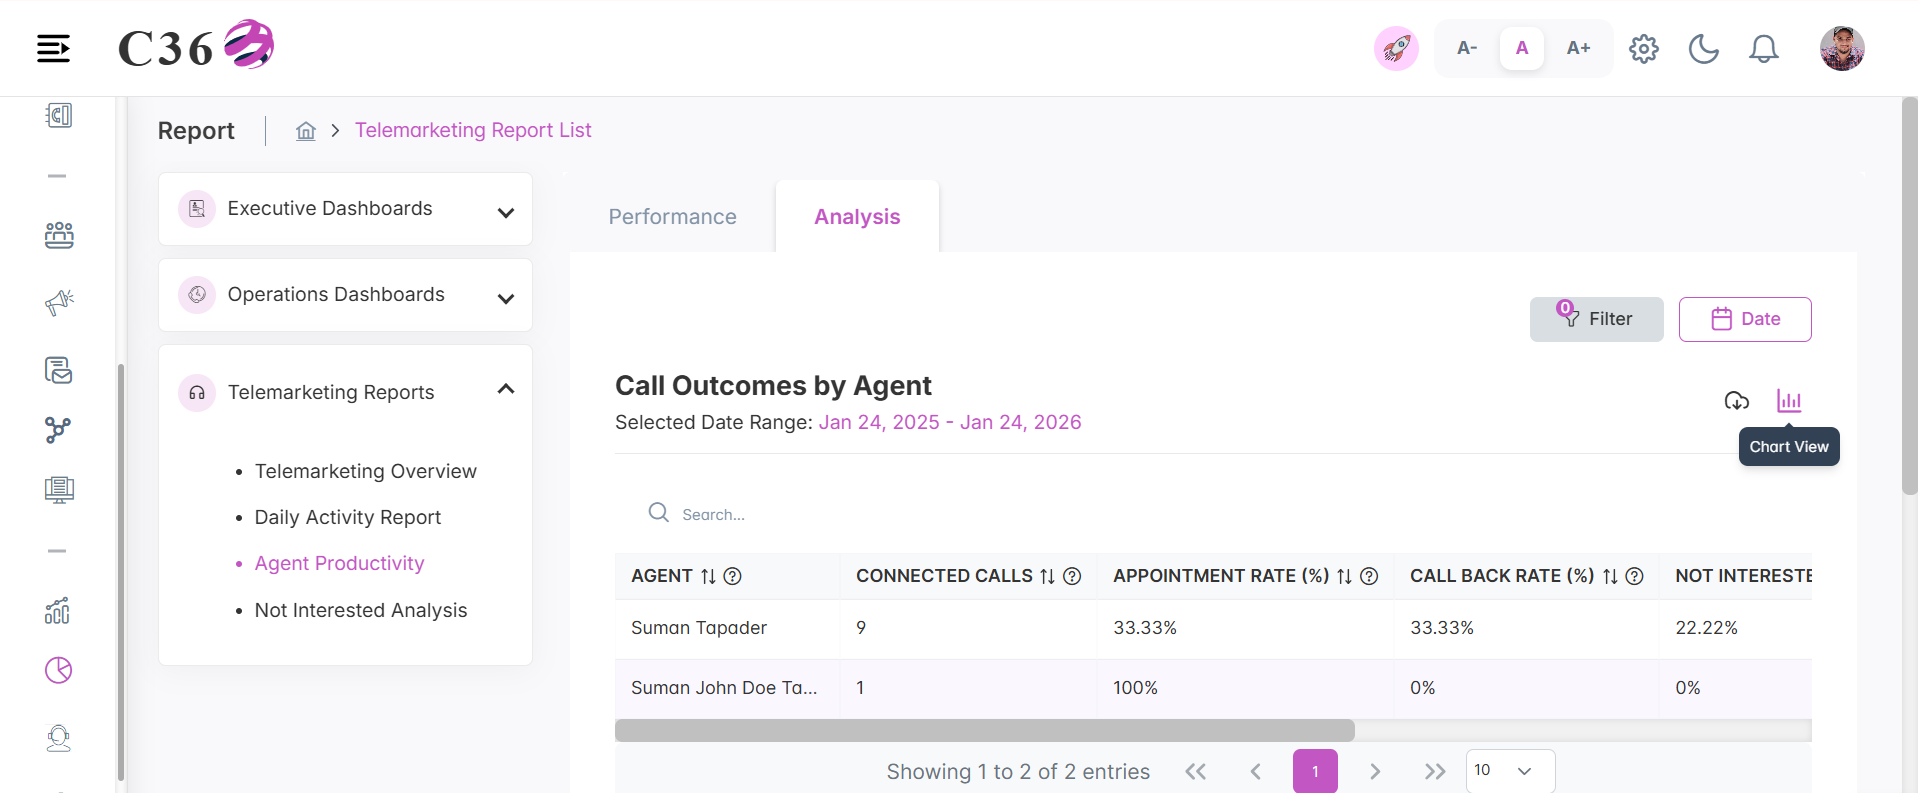
🧾 Columns included in the table view.
| Column | Description |
|---|---|
| Agent | Name of the telemarketing agent. |
| Connected Calls | Total number of calls successfully connected by the agent. |
| Appointment Rate (%) | Percentage of connected calls that resulted in scheduled appointments. |
| Call Back Rate (%) | Percentage of connected calls that resulted in a call back request. |
| Not Interested Rate (%) | Percentage of connected calls that marked as not interested. |
| No Response Rate (%) | Percentage of connected calls with no meaningful response. |
| Wrong Info Rate (%) | Percentage of connected calls with incorrect or invalid contact information. |
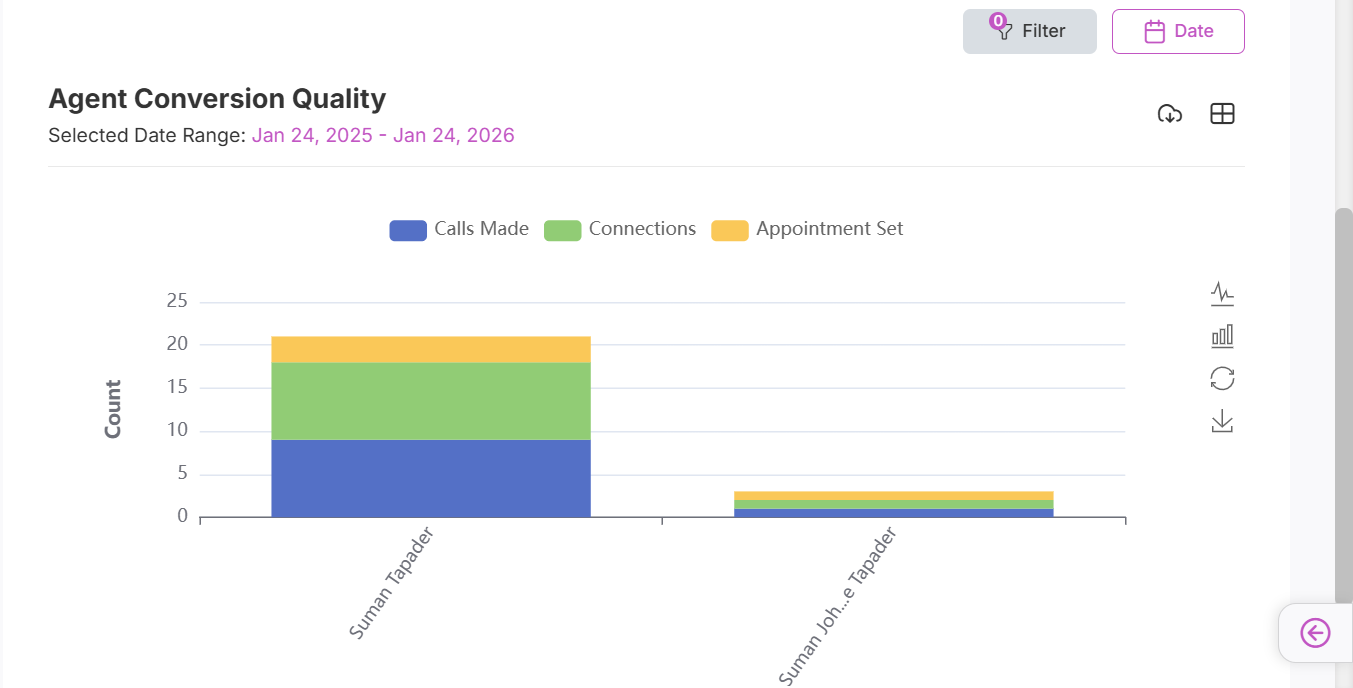
✅ Agent Conversion Quality
An assessment of how effectively agents convert interactions into successful outcomes, focusing on conversion accuracy, consistency, and quality.Click to see quick actions
- Hover on the Group Bar Chart to see the individual data points.
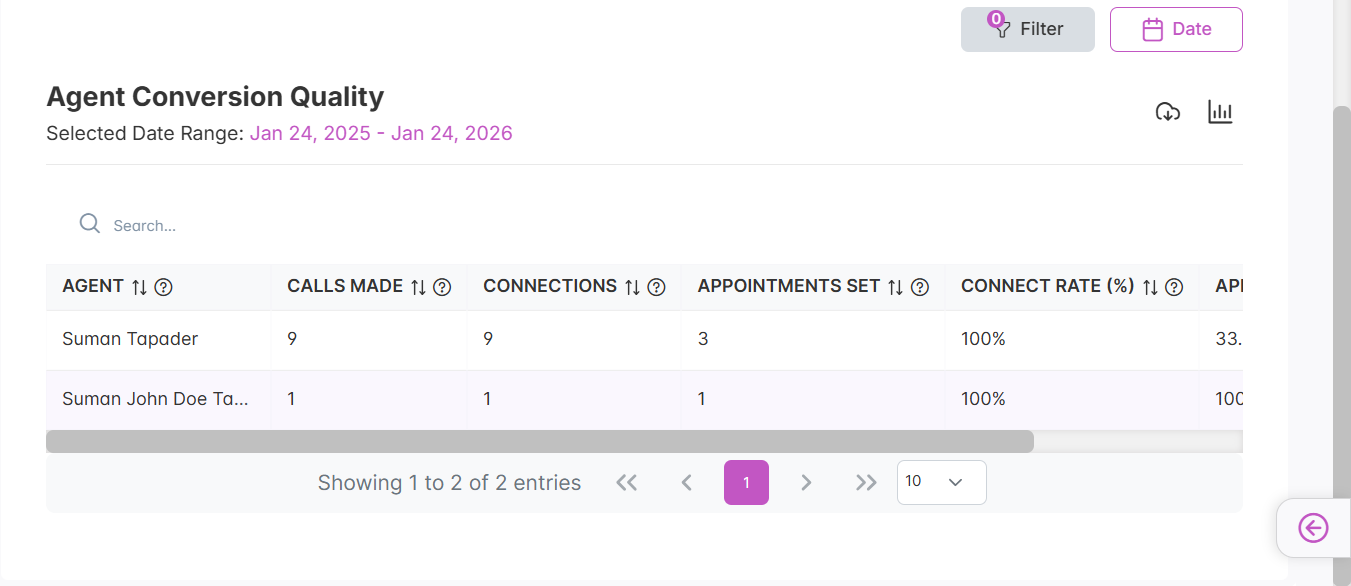
🧾 Columns included in the table view.
| Column | Description |
|---|---|
| Agent | Name of the telemarketing agent. |
| Calls Made | Total number of calls made by the agent. |
| Connections | Number of calls successfully connected. |
| Appointments Set | Total number of appointments scheduled by the agent. |
| Connect Rate | Percentage of connected calls that resulted in a connection. |
| Appointment Rate (%) | Percentage of connected calls that resulted in scheduled appointments. |
🚫 Not Interested Analysis
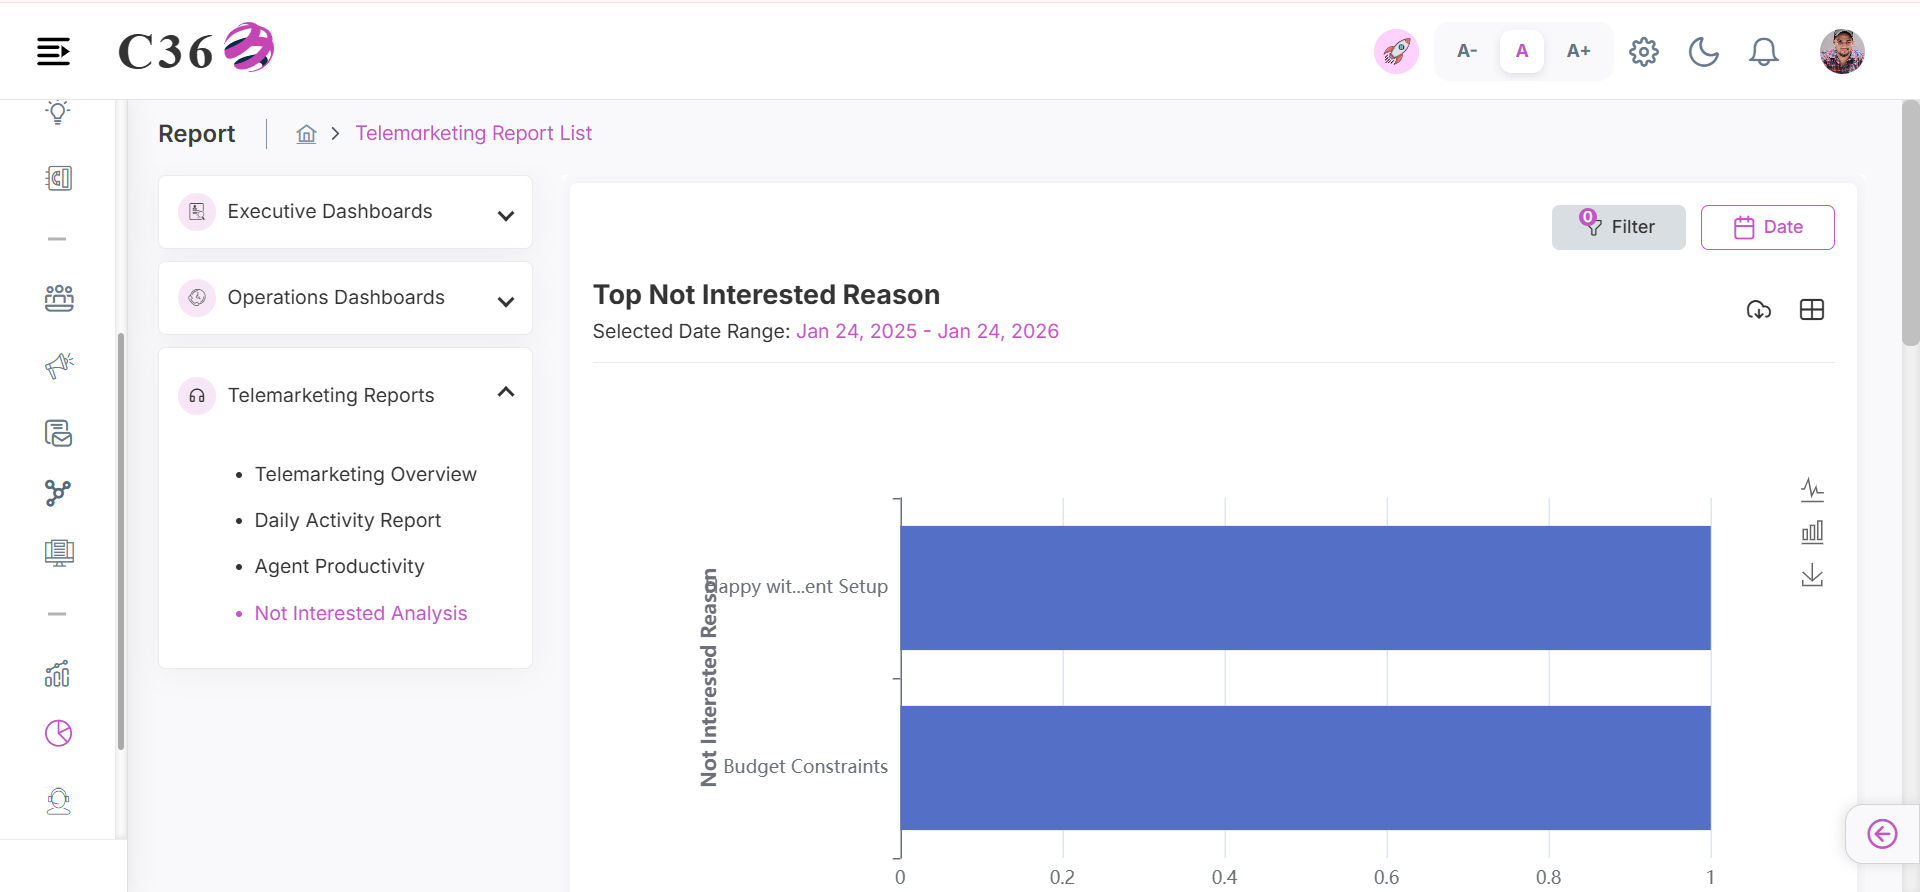
❓ Top Not Interested Reason
A summary of the most common reasons prospects decline, helping identify objections and improve targeting and messaging strategies.
Click to see quick actions
- Can Toggle between Line chart and Bar chart. - Can Toggle between Table view and Chart view. - Can perform Search in table view. - Can Export/Download the report. - Can Save the Chart as image. - Can Filter by Date Range. - Can Filter by Campaign and Users.
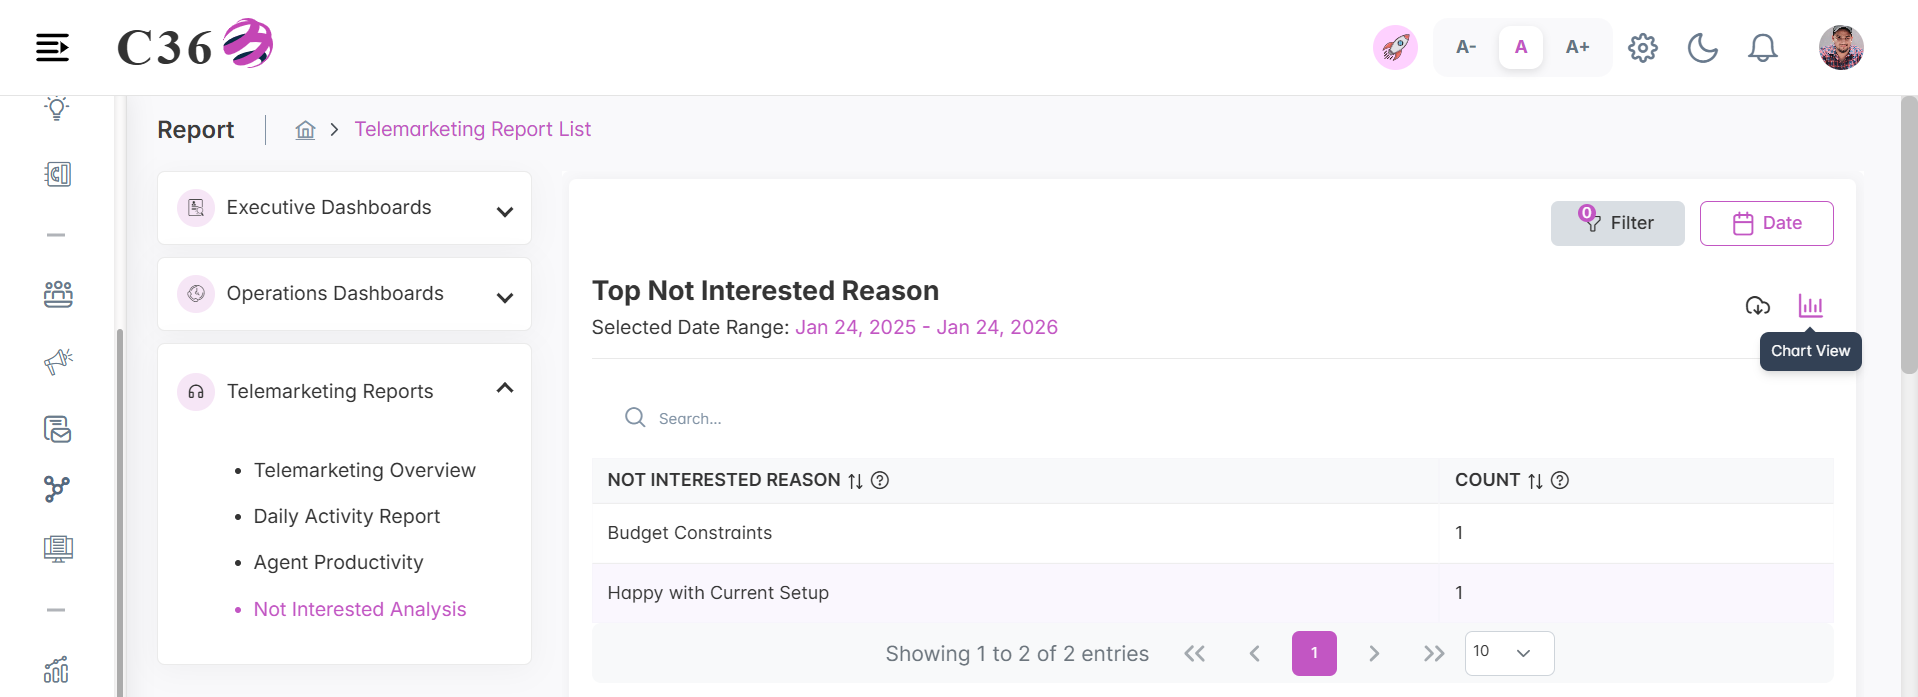
🧾 Columns included in the table view.
| Column | Description |
|---|---|
| Not Interested Reason | Reason provided by the prospect for declining interest. |
| Count | Number of times this reason was recorded. |
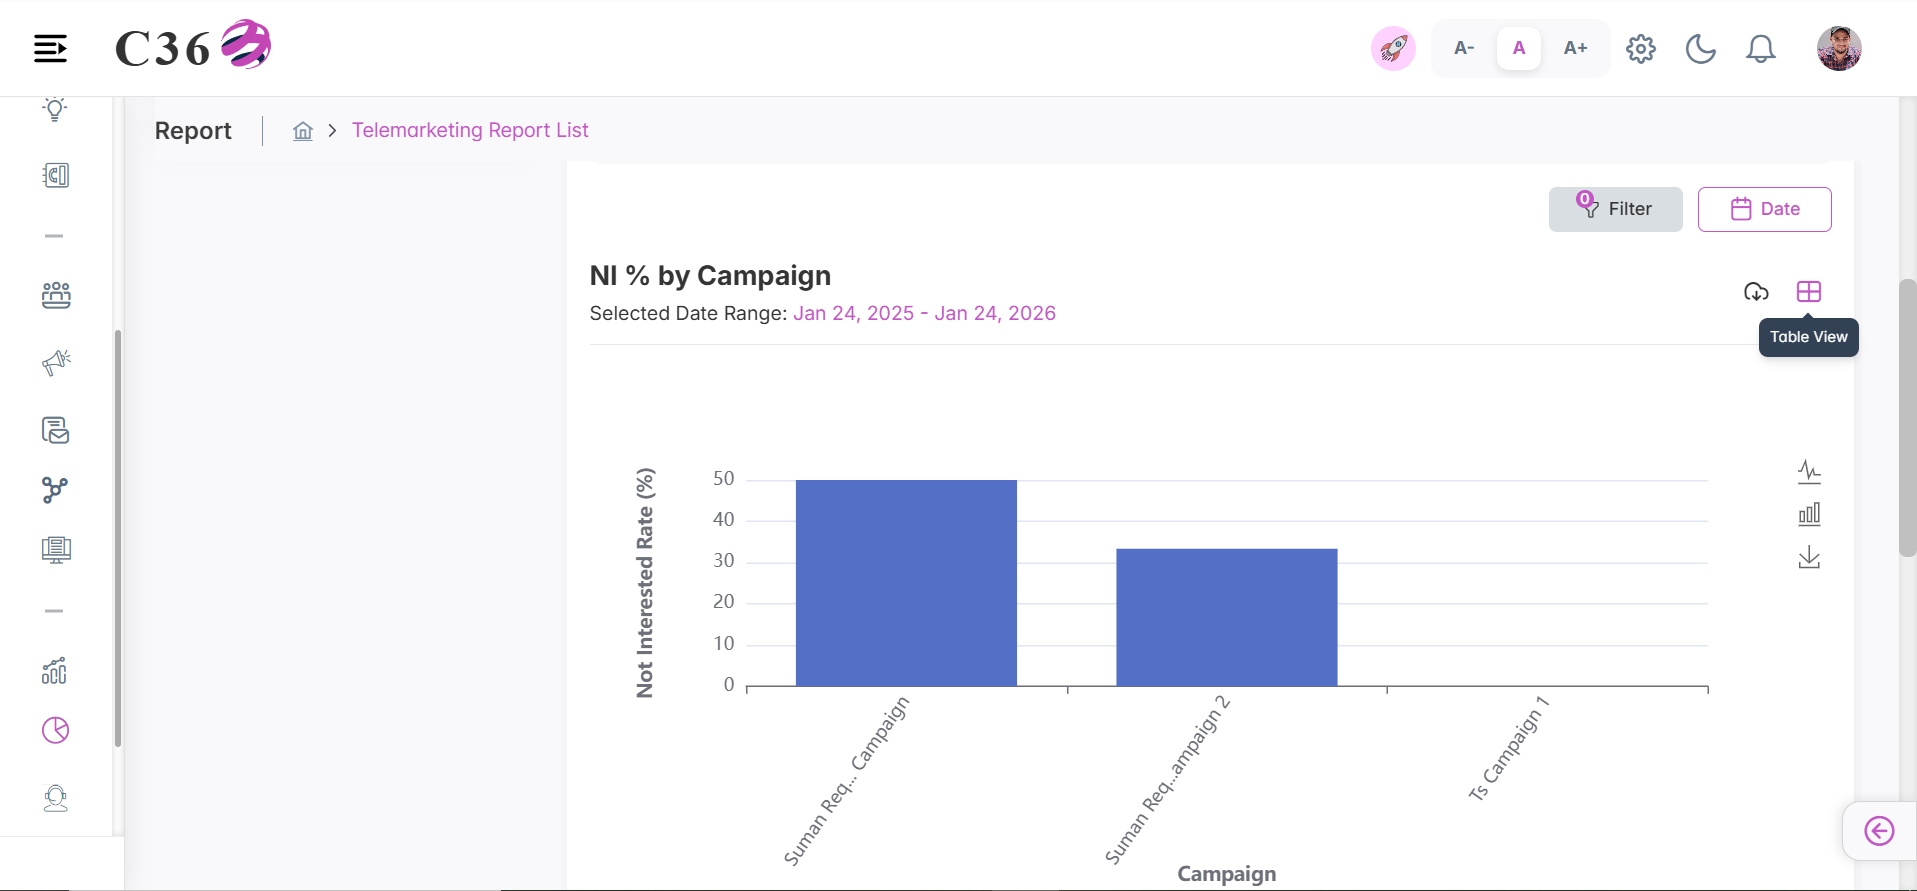
📊 NI % by Campaign
A comparison of the “Not Interested” percentage across campaigns, highlighting engagement effectiveness and areas needing optimization.
Click to see quick actions
- Toggle between Line chart and Bar chart. - Toggle between Table view and Chart view. - Perform Search in table view. - Export/Download the report. - Save the Chart as an image. - Filter by Date Range. - Filter by Campaign and Users.
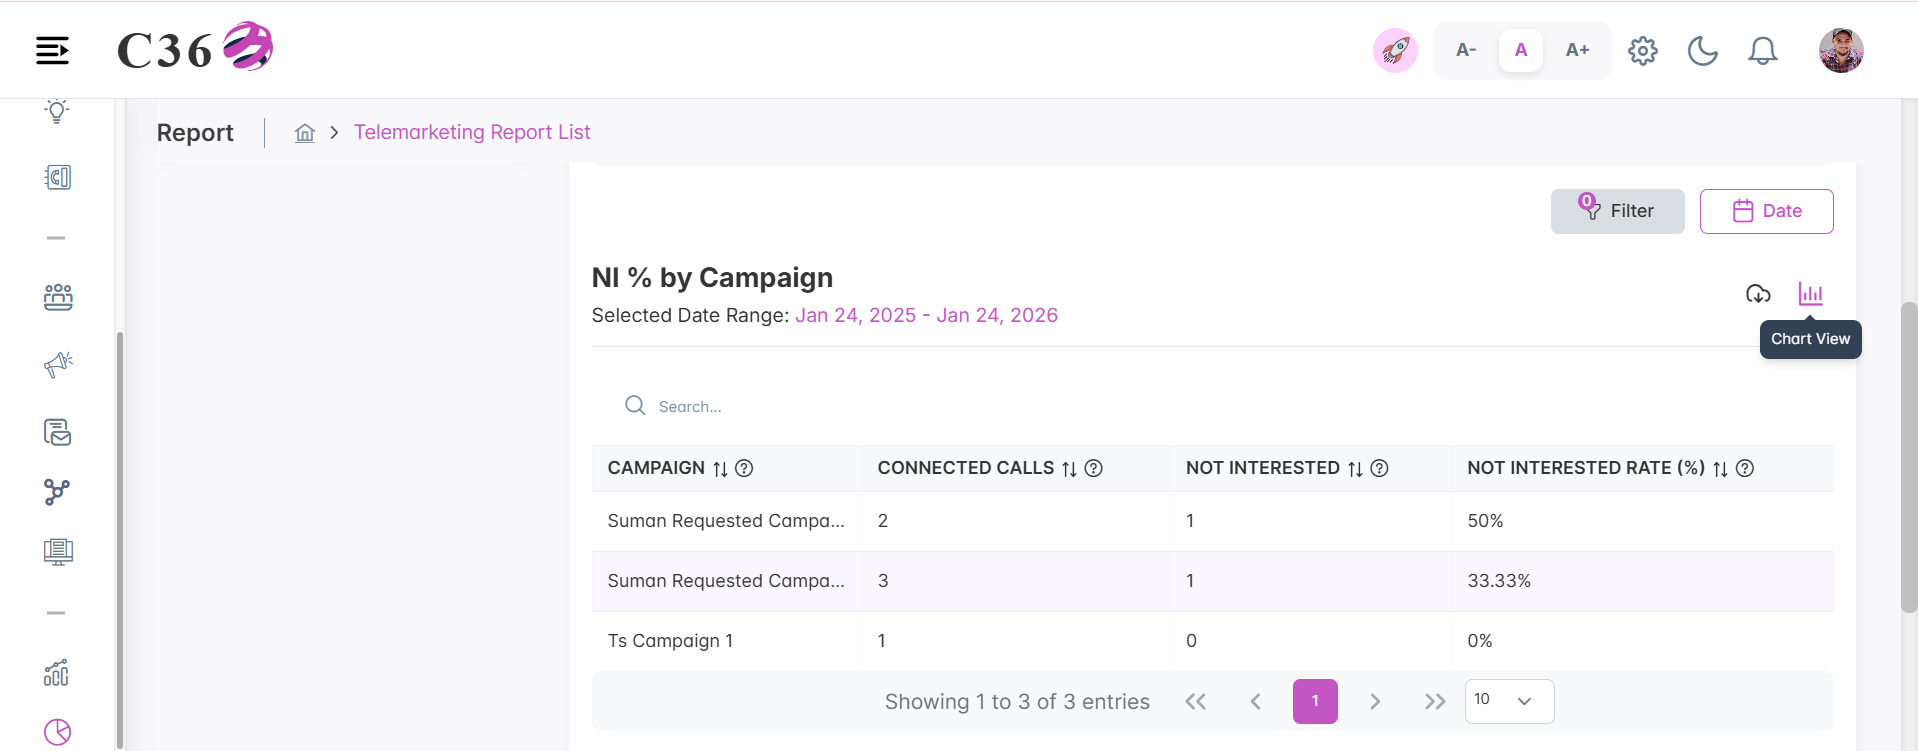
🧾 Columns included in the table view.
| Column | Description |
|---|---|
| Campaign | Name of the Campaign. |
| Connected Calls | Number of Calls connected for the campaign. |
| Not Interested | Number of calls marked as not interested. |
| Not Interested Rate (%) | Percentage of connected calls that resulted in a not interested outcome. |
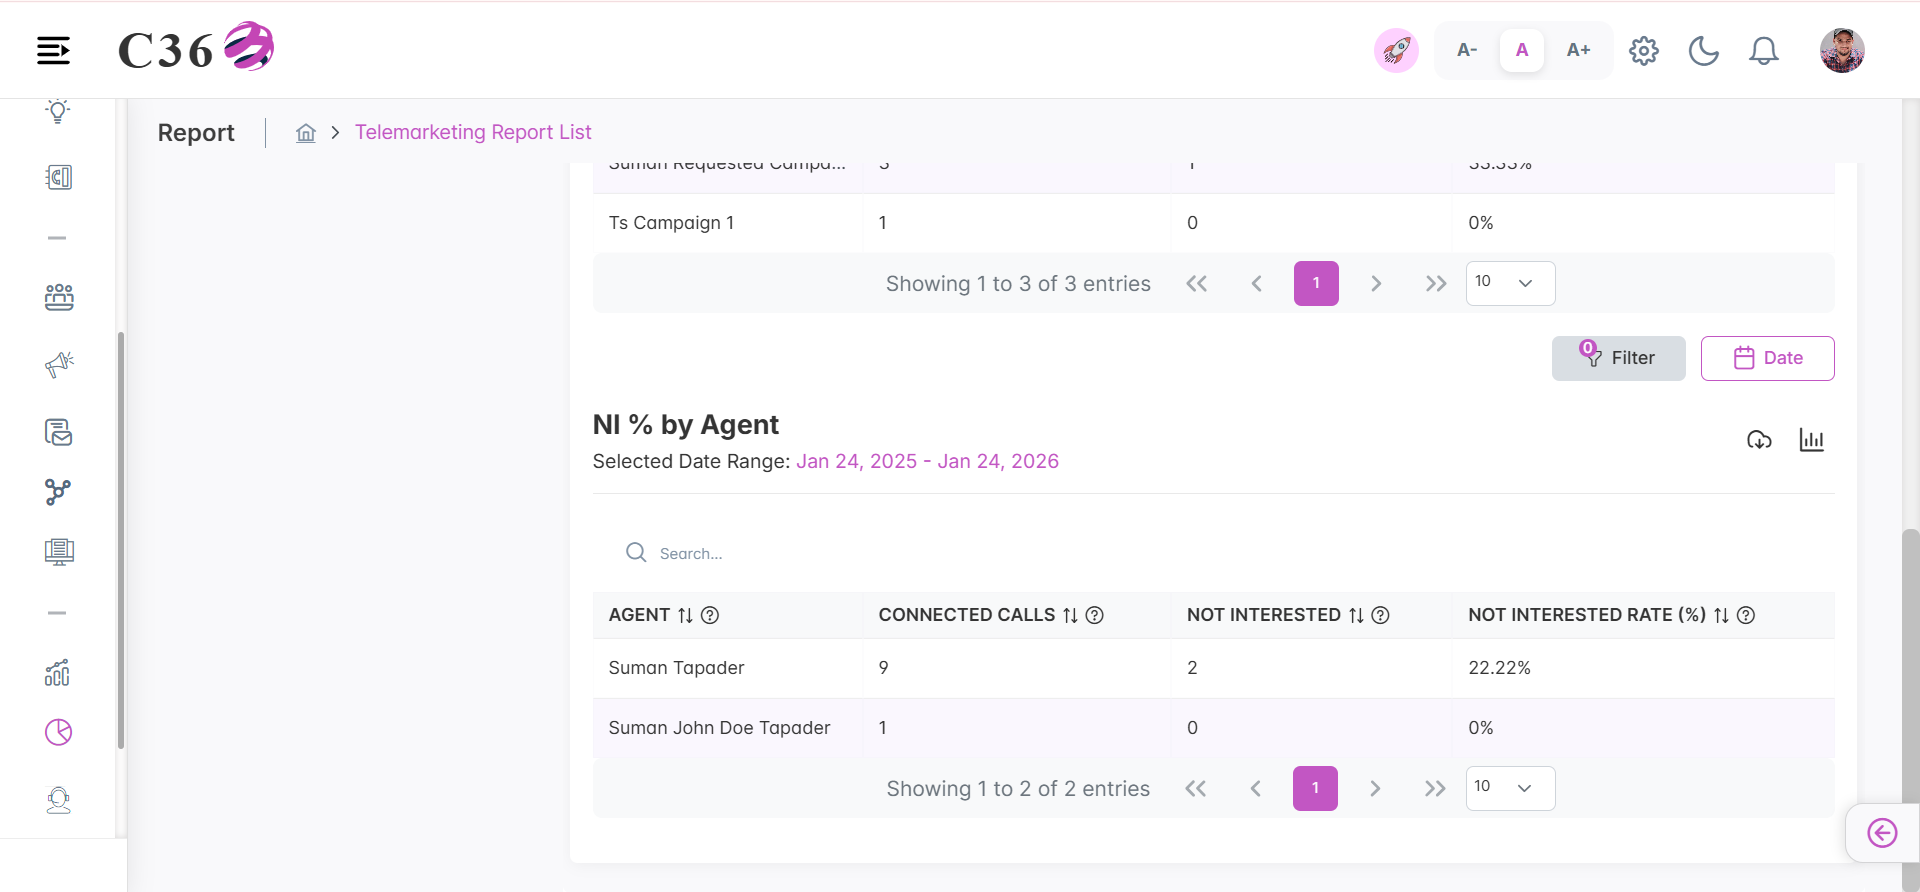
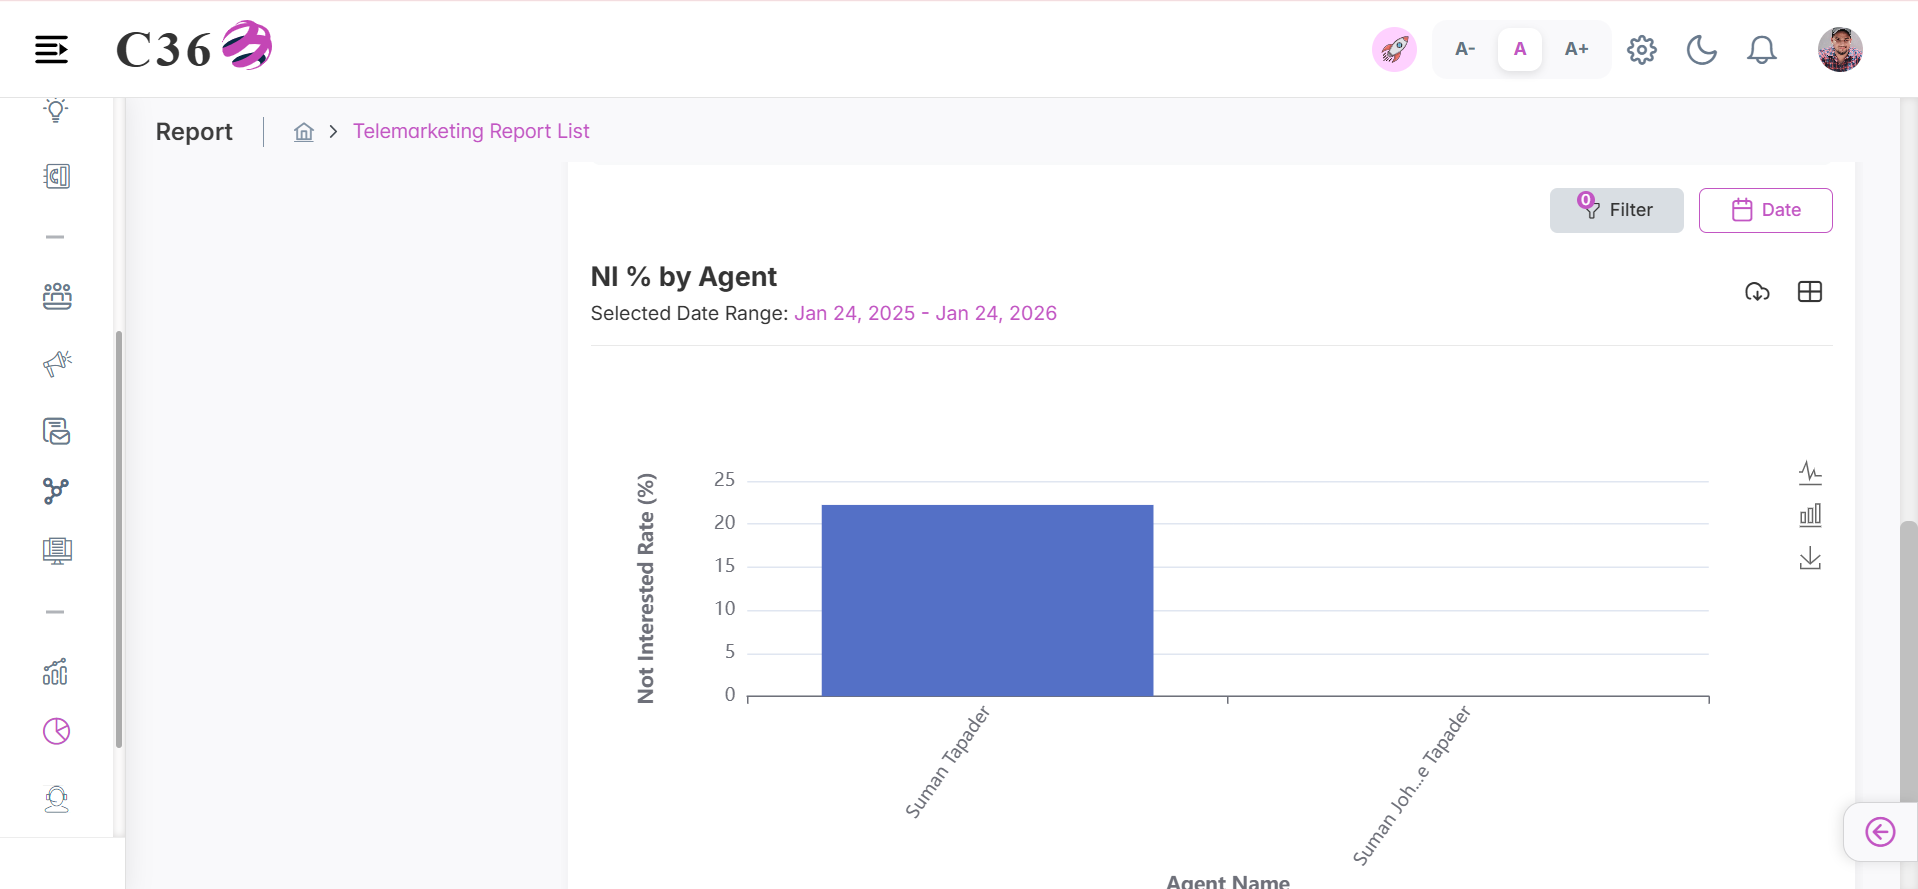
👤 NI % by Agent
A breakdown of the “Not Interested” percentage by agent, providing insight into engagement quality and agent-level effectiveness.
Click to see quick actions
- Can Toggle between Line chart and Bar chart. - Can Toggle between Table view and Chart view. - Can perform Search in table view. - Can Export/Download the report. - Can Save the Chart as image. - Can Filter by Date Range. - Can Filter by Campaign and Users.
🧾 Columns included in the table view.
| Column | Description |
|---|---|
| Agent | Name of the Agent. |
| Connected Calls | Number of Calls connected for the campaign. |
| Not Interested | Number of calls marked as not interested. |
| Not Interested Rate (%) | Percentage of connected calls that resulted in a not interested outcome. |