📈 Sales
A consolidated report that monitors sales activities, opportunity status, conversion rates, revenue trends, etc., to evaluate team performance and forecast growth.
To access it:
➡️ Go to Analytics → Reports → Sales from the left-hand menu.
- By default, reports are displayed with a date range of one year back from today.
━━━━━━━━━━━━━━━━━━━━━━━━━━━━━━━━━━━━━━━━━━━━━━━━━━━━━━━━━━━━━━━━━━━━━━━━━━━━━━━━━━━━━
🧰 Filters
- 📅 Date Range Filter
- 🎛️ Respective Filters
Date Range Filter – Selects a specific time period for analysis.
Respective Filters – Filters data by Country, Company and Users.
- User filters are dependent on the Country and Company filters (i.e., if you select a country, it will show only the users of that country, and if you select a company, it will show only the users of that company in the user dropdown).
- The Country or Company filter alone will not provide any results.
- The Users filter alone will provide results based on the selected users.
━━━━━━━━━━━━━━━━━━━━━━━━━━━━━━━━━━━━━━━━━━━━━━━━━━━━━━━━━━━━━━━━━━━━━━━━━━━━━━━━━━━━━
📊 Overview
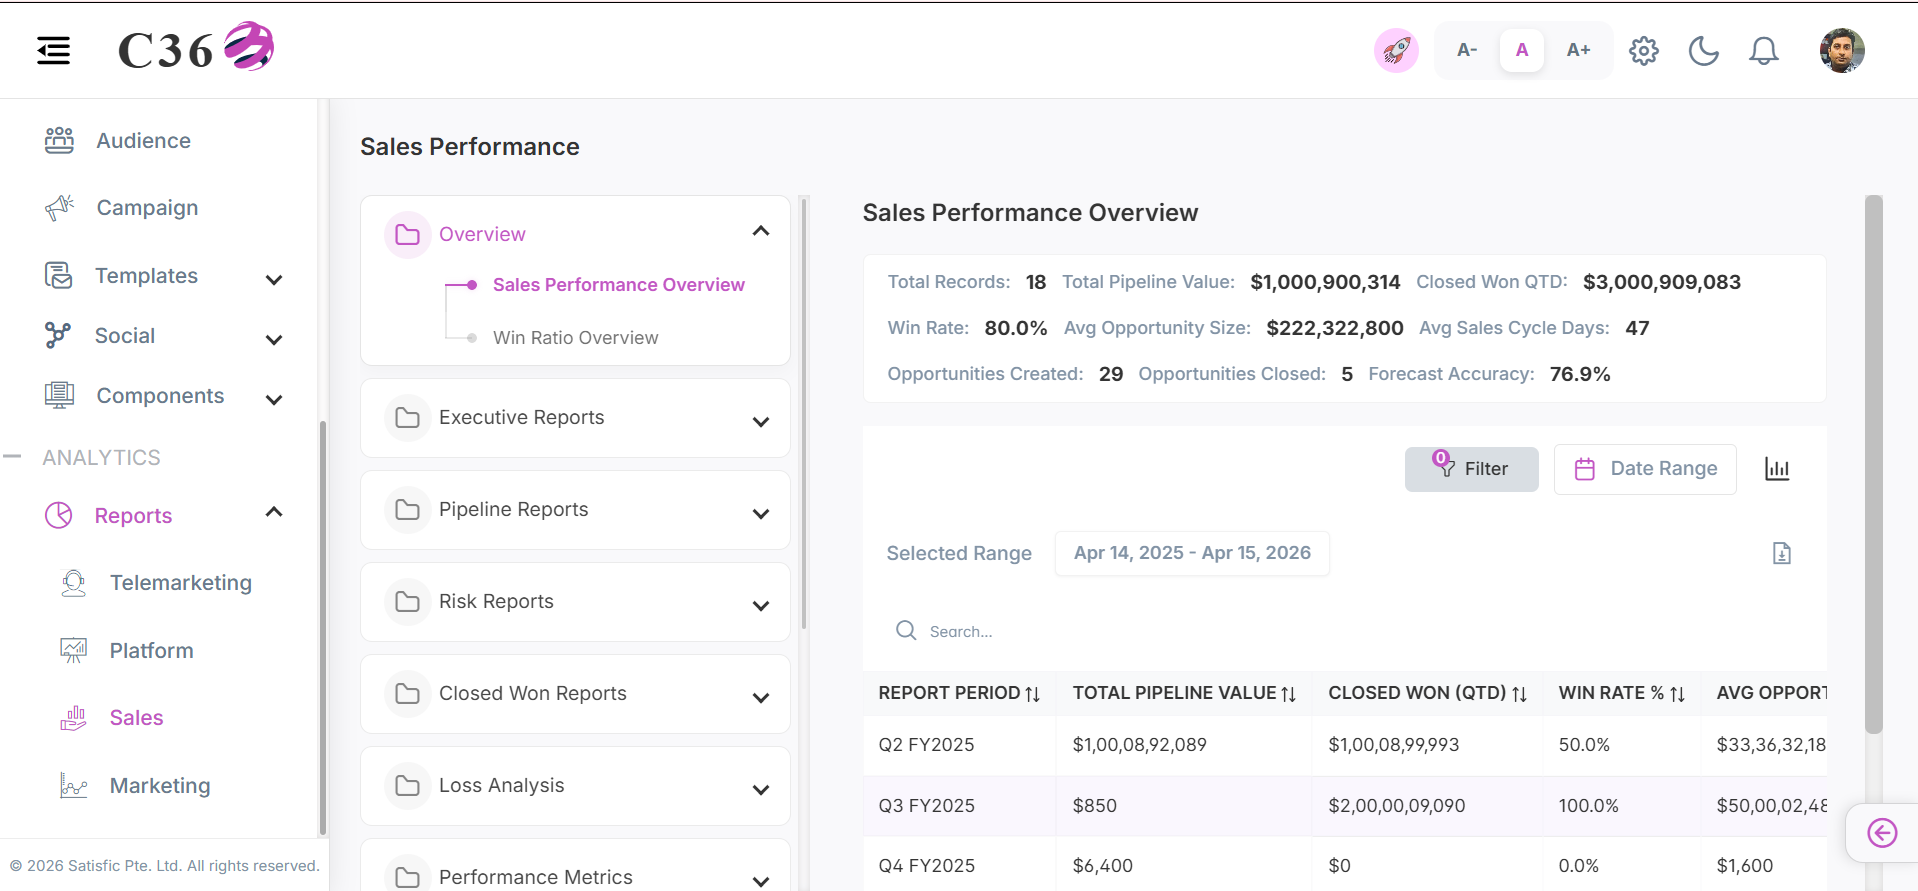
🚀 Sales Performance Overview
Provides a comprehensive summary of key sales activities and overall team performance.
- 📊 Chart View
- 📋 Table View
Click to see quick actions
- Can Toggle between Table view and Chart view. - Can Export/Download the report. - Can perform Search in table view. - Can Filter by Date Range. - Can Filter by Country, Company and Users.
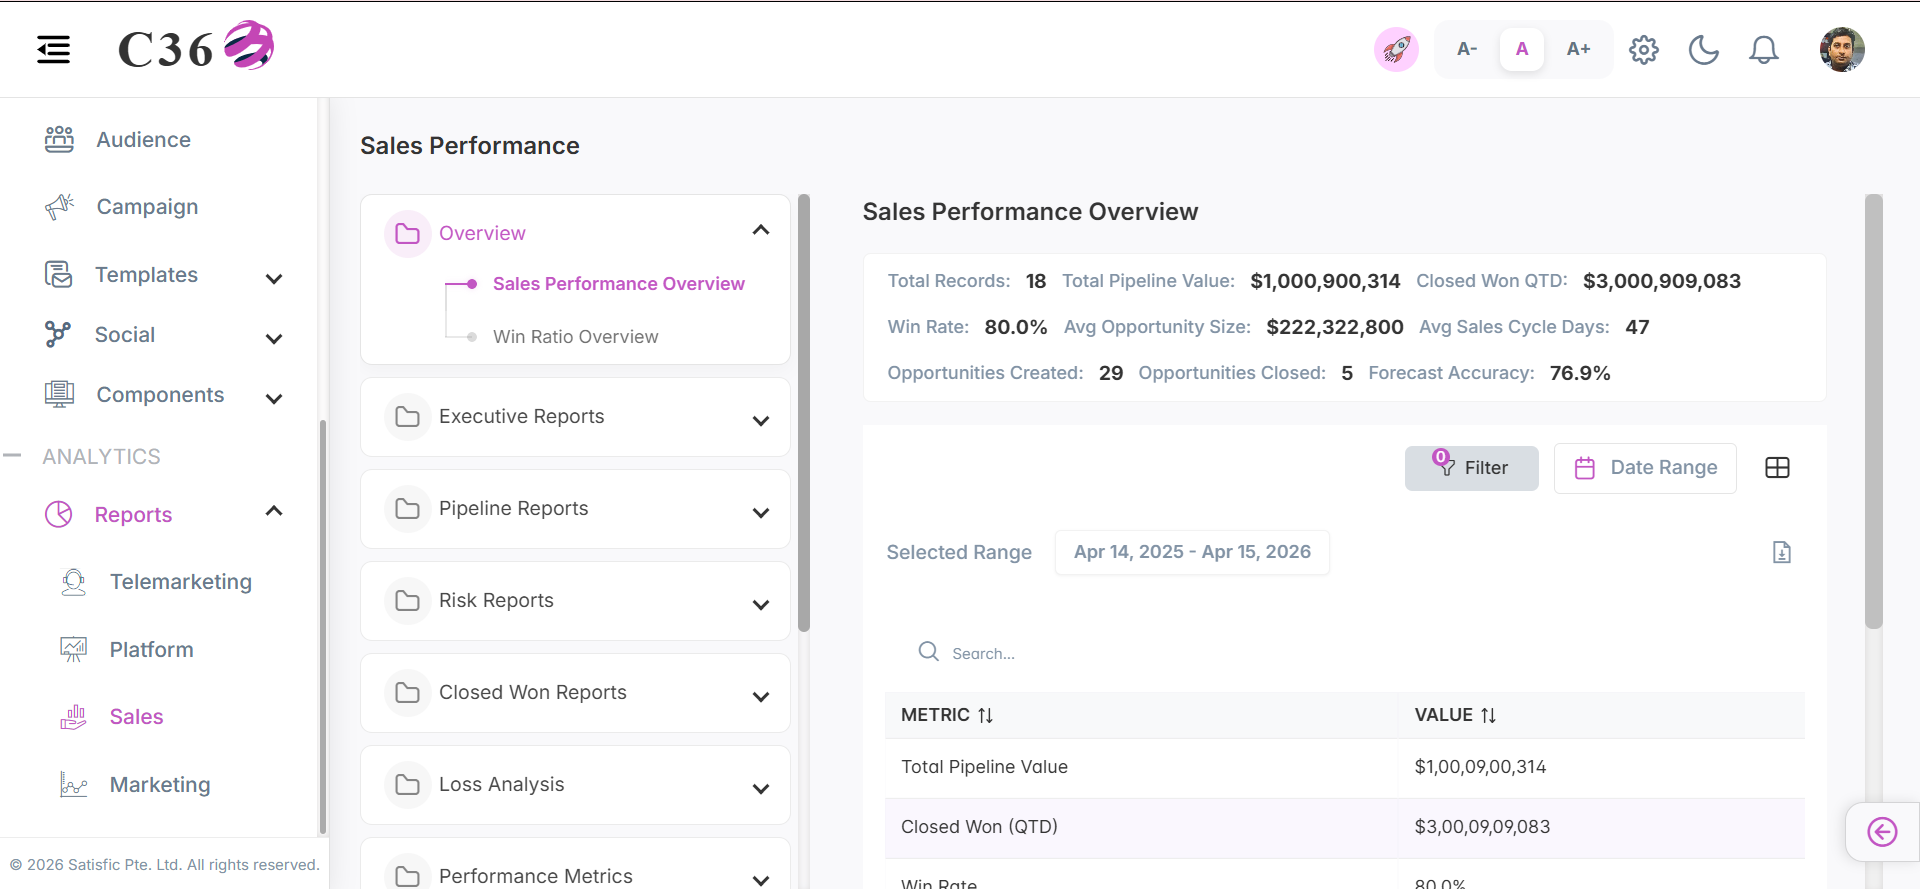
Click to see quick actions
- Can Toggle between Table view and Chart view. - Can Export/Download the report. - Can perform Search in table view. - Can Filter by Date Range. - Can Filter by Country, Company and Users.
🧾 Columns included in the table view
| Metric | Description |
|---|---|
| Total Records | Total number of opportunity records in the system. |
| Total Pipeline Value | Combined value of all open opportunities in the sales pipeline. |
| Closed Won QTD | Total revenue from deals successfully closed in the current quarter. |
| Win Rate | Percentage of won deals compared to total closed opportunities. |
| Avg Opportunity Size | Average value of each opportunity in the pipeline. |
| Avg Sales Cycle Days | Average time taken to close a deal from creation to completion. |
| Opportunities Created | Total number of new opportunities created within a specific period. |
| Opportunities Closed | Total number of opportunities closed (won or lost). |
| Forecast Accuracy | Measure of how closely sales forecasts match actual results. |
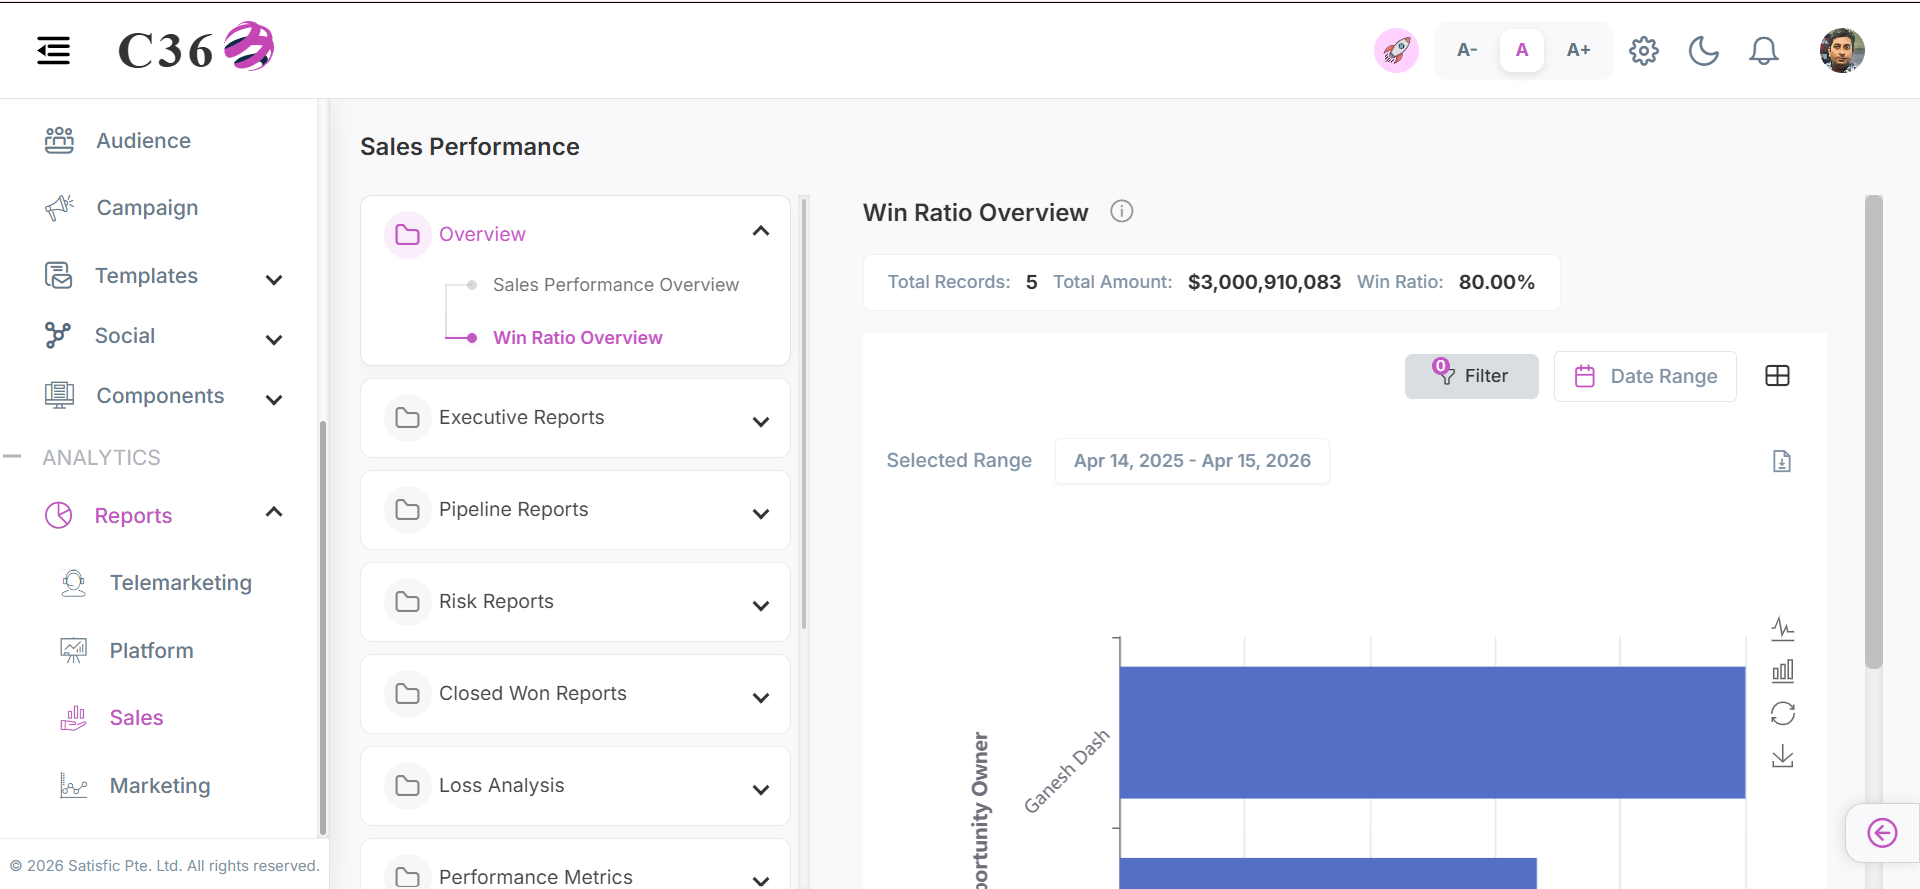
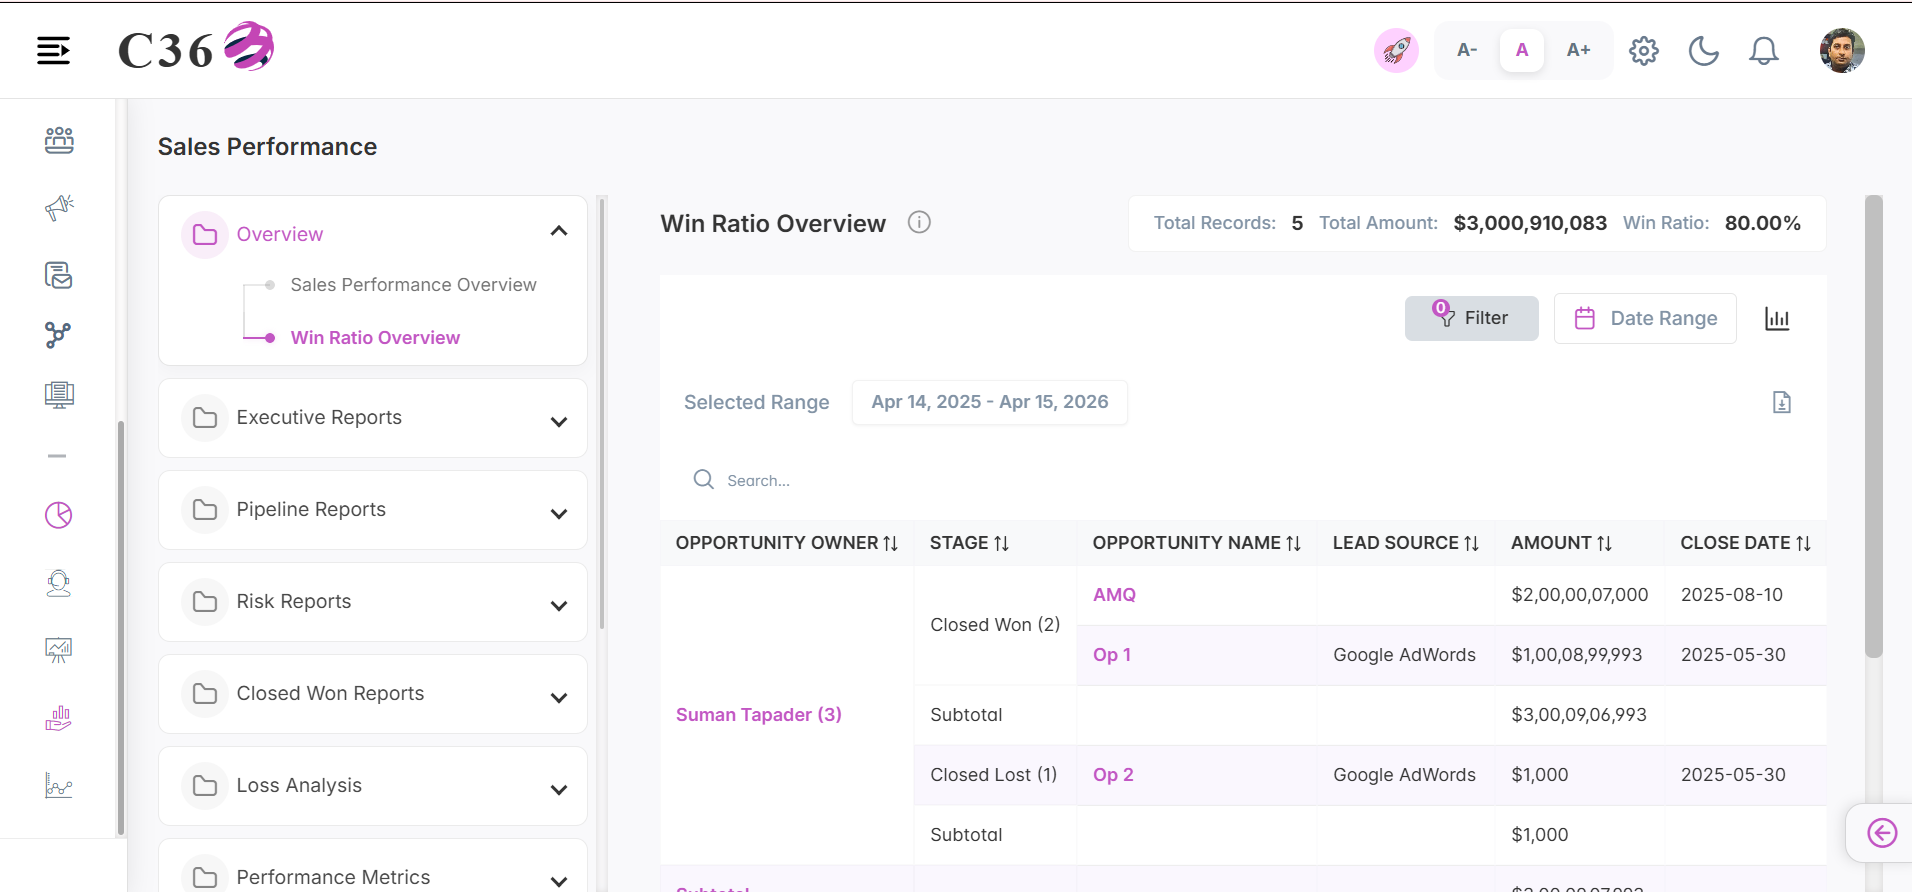
⚖️ Win Ratio Overview
Analyzes the success rate of closing deals to evaluate sales effectiveness and strategy.
- 📊 Chart View
- 📋 Table View
Click to see quick actions
- Can Toggle between Table view and Chart view. - Can Export/Download the report. - Can Filter by Date Range. - Can Filter by Country, Company and Users. - Toggle between Line chart and Bar chart. - Save the Chart as an image. - Can Restore the bar chart.
Click to see quick actions
- Can Toggle between Table view and Chart view. - Can Export/Download the report. - Can perform Search in table view. - Can Filter by Date Range. - Can Filter by Country, Company and Users.
🧾 Columns included in the table view
| Field Name | Description |
|---|---|
| Opportunity Owner | User responsible for managing and closing the opportunity. |
| Stage | Current phase of the opportunity in the sales pipeline. |
| Opportunity Name | Unique name or title identifying the opportunity. |
| Lead Source | Origin from which the opportunity was generated (e.g., Web, Referral). |
| Amount | Expected revenue value of the opportunity. |
| Close Date | Expected or actual date when the opportunity will be closed. |
| Probability | Likelihood (in %) of the opportunity being successfully closed. |
| Age | Number of days since the opportunity was created. |
| Created Date | Date when the opportunity record was created. |
| Win Ratio | Percentage of won opportunities compared to total opportunities. |
━━━━━━━━━━━━━━━━━━━━━━━━━━━━━━━━━━━━━━━━━━━━━━━━━━━━━━━━━━━━━━━━━━━━━━━━━━━━━━━━━━━━━
💼 Executive Reports
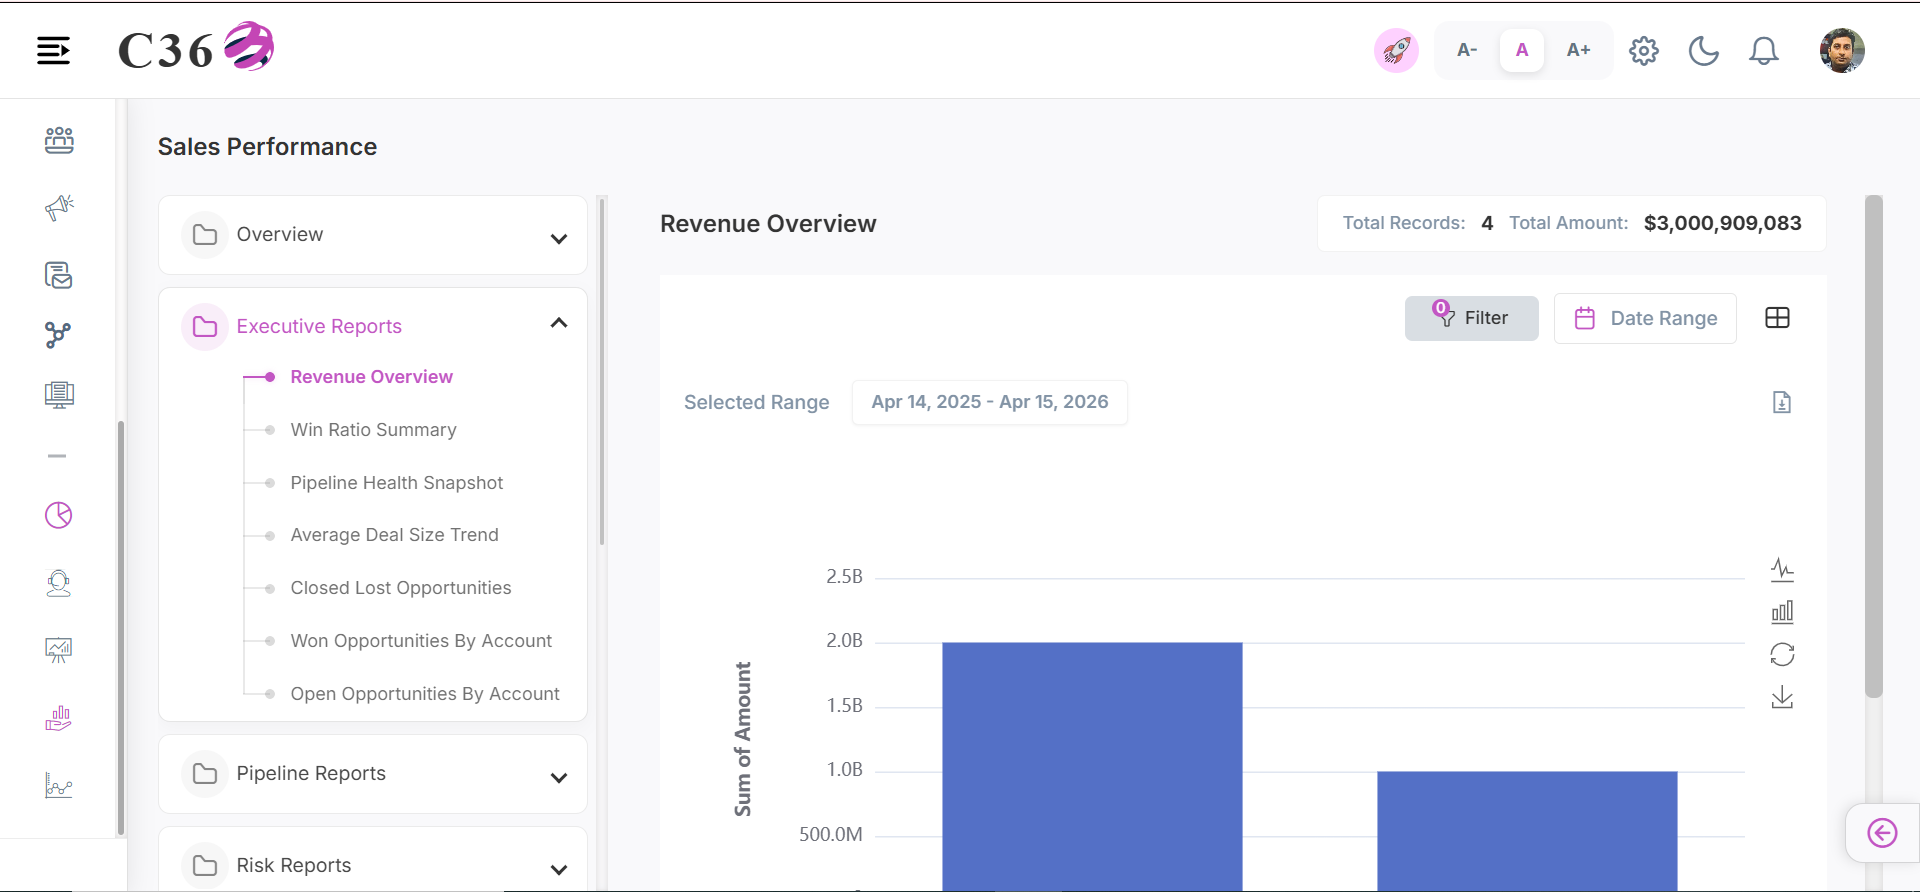
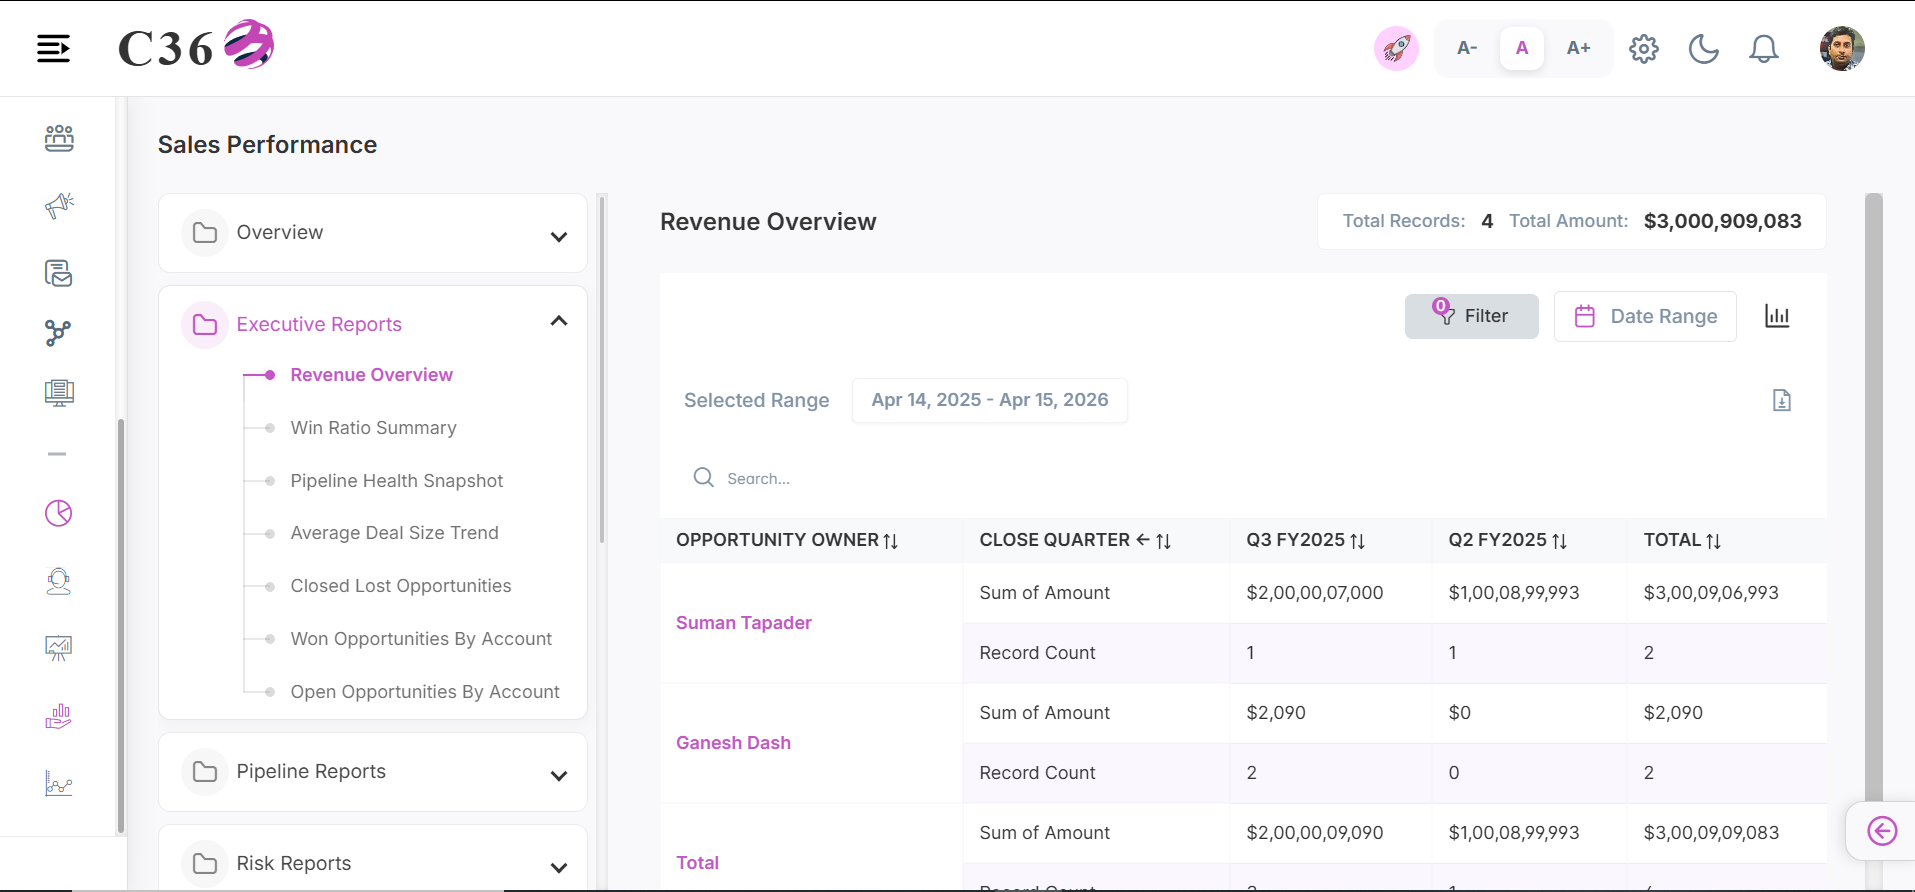
💰 Revenue Overview
Displays total generated revenue and tracks high-level financial growth trends.
- 📊 Chart View
- 📋 Table View
Click to see quick actions
- Can toggle between table view and chart view. - Can export/download the report. - Can filter by date range. - Can filter by country, company and users. - Toggle between line chart and bar chart. - Save the chart as an image. - Can restore the bar chart.
Click to see quick actions
- Can toggle between table view and chart view. - Can export/download the report. - Can perform search in the table. - Can filter by date range. - Can filter by country, company and users.
🧾 Columns included in the table view
| Field Name | Description |
|---|---|
| Opportunity Owner | User responsible for managing and closing the opportunity. |
| Close Quarter | The quarter (e.g., Q1, Q2) in which the opportunity is expected to close. |
| Q1 FY 2026 | First Quarter of Fiscal Year 2026 |
| Total | Total value or count of opportunities, depending on the report context. |
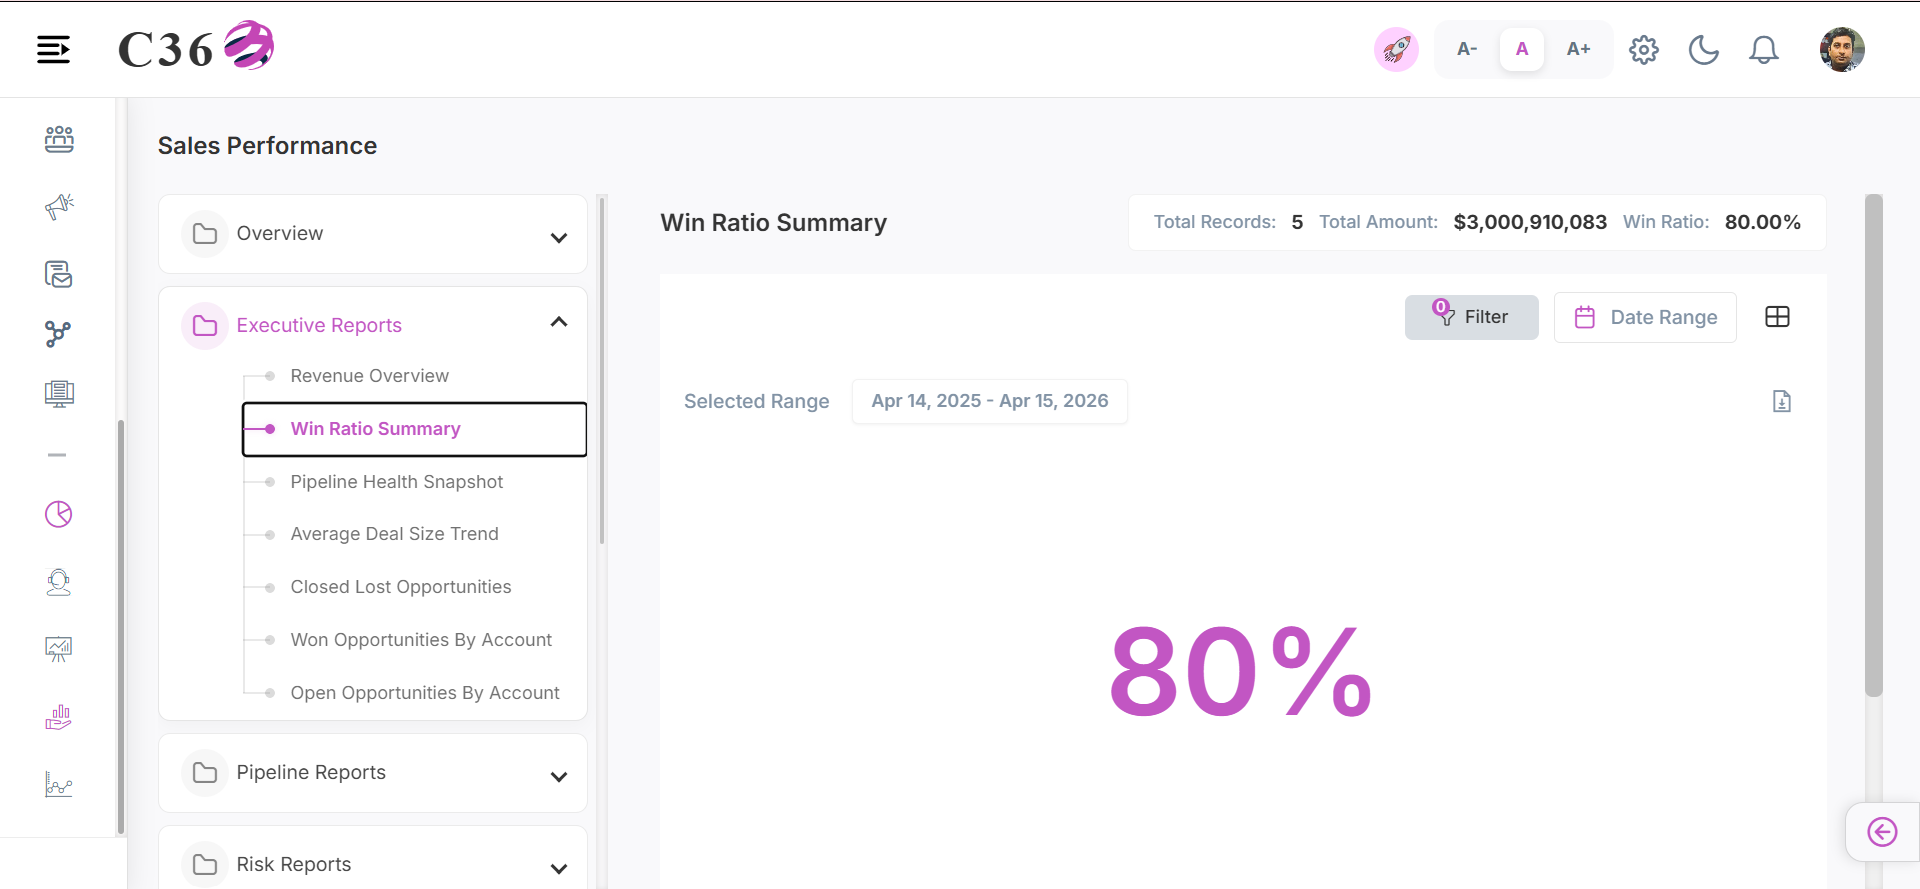
📈 Win Ratio Summary
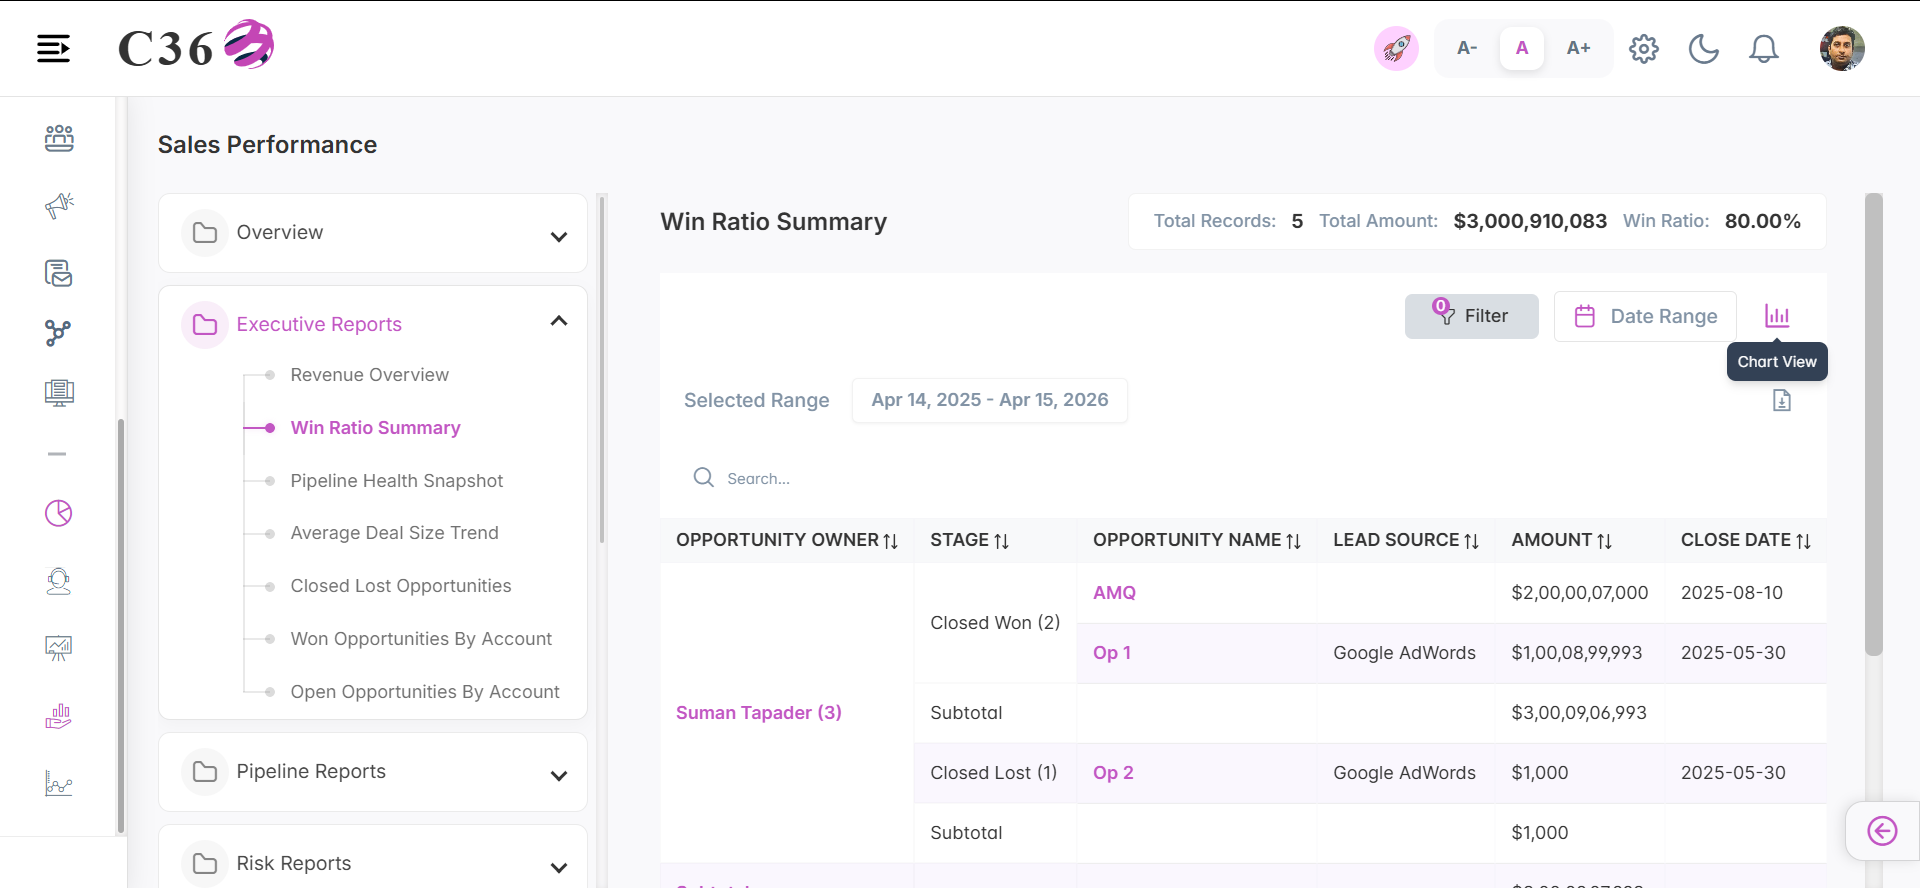
Summarizes overall win rate percentages to gauge opportunity conversion success.
- 📊 Chart View
- 📋 Table View
Click to see quick actions
- Can Toggle between Table view and Chart view. - Can Export/Download the report. - Can Filter by Date Range. - Can Filter by Country, Company and Users.
Click to see quick actions
- Can Toggle between Table view and Chart view. - Can Export/Download the report. - Can perform search in the table. - Can Filter by Date Range. - Can Filter by Country, Company and Users.
🧾 Columns included in the table view
| Field Name | Description |
|---|---|
| Opportunity Owner | User responsible for managing and closing the opportunity. |
| Stage | Current phase of the opportunity in the sales pipeline. |
| Opportunity Name | Unique name or title identifying the opportunity. |
| Lead Source | Origin from which the opportunity was generated (e.g., Web, Referral). |
| Amount | Expected revenue value of the opportunity. |
| Close Date | Expected or actual date when the opportunity will be closed. |
| Probability | Likelihood (in %) of the opportunity being successfully closed. |
| Age | Number of days since the opportunity was created. |
| Created Date | Date when the opportunity record was created. |
| Win Ratio | Percentage of won opportunities compared to total opportunities. |
🩺 Pipeline Health Snapshot
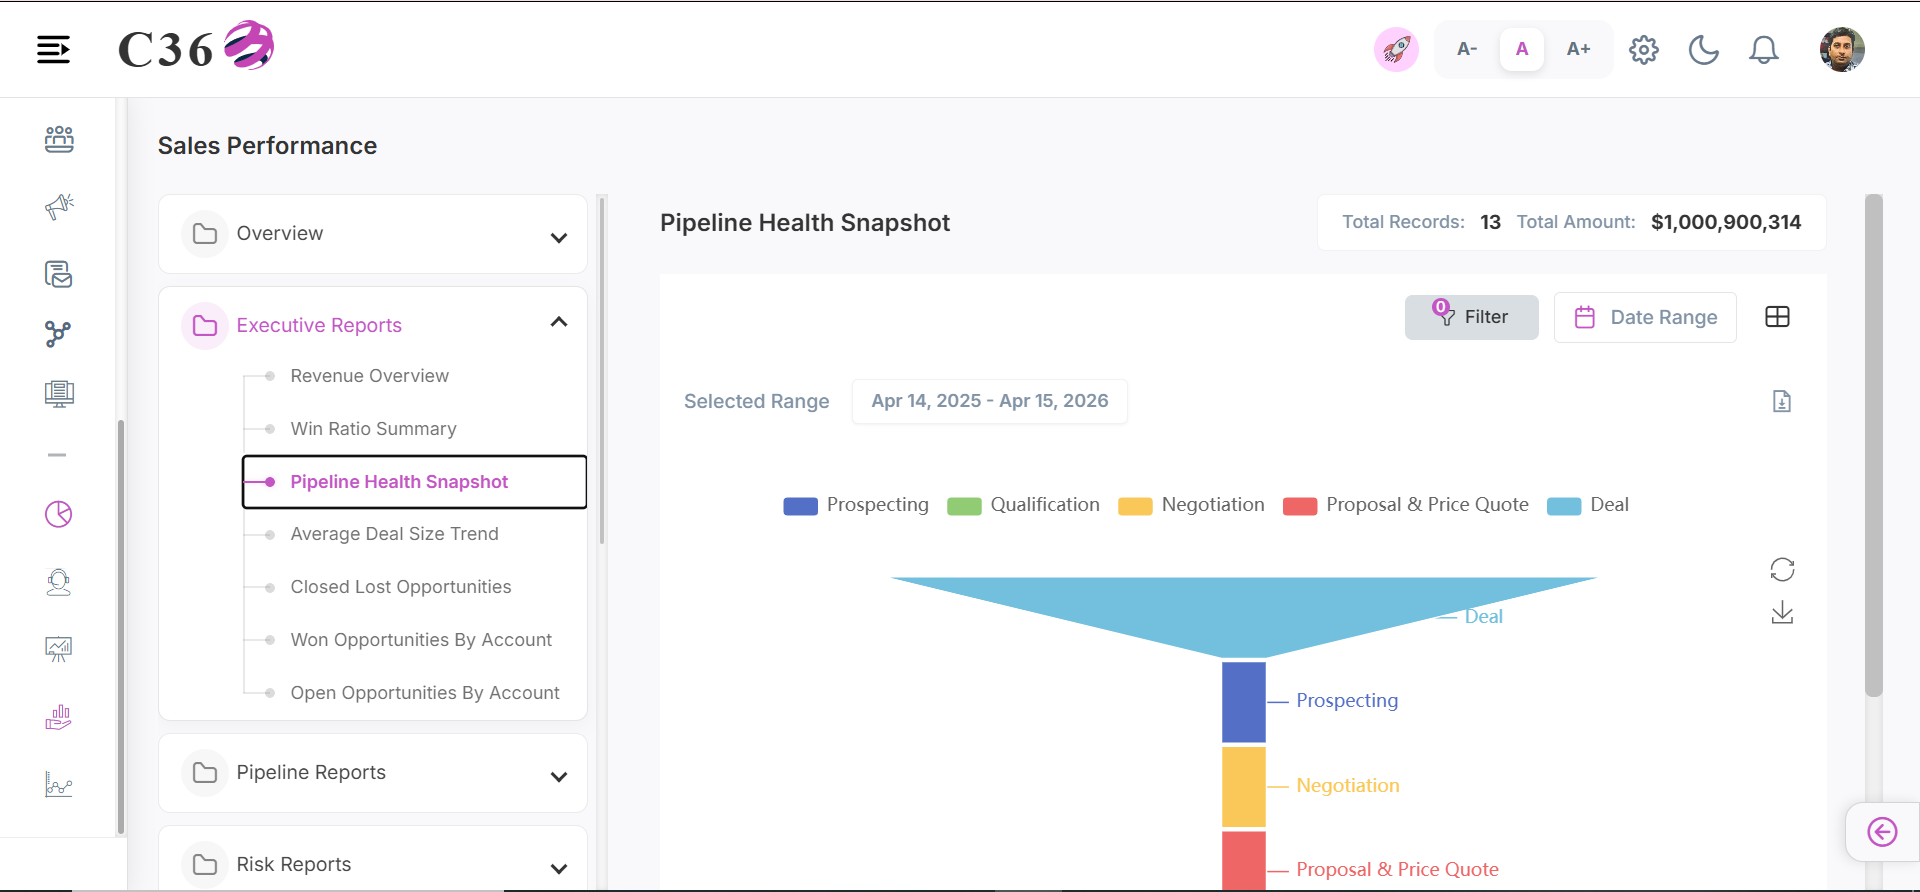
Offers a quick assessment of the sales pipeline's current state and overall health.
- 📊 Chart View
- 📋 Table View
Click to see quick actions
- Can Toggle between Table view and Chart view. - Can filter the funnel by selecting or unselecting the color buttons. - Can restore the bar chart. - Save the chart as an image. - Can Export/Download the report. - Can Filter by Date Range. - Can Filter by Country, Company and Users.
Click to see quick actions
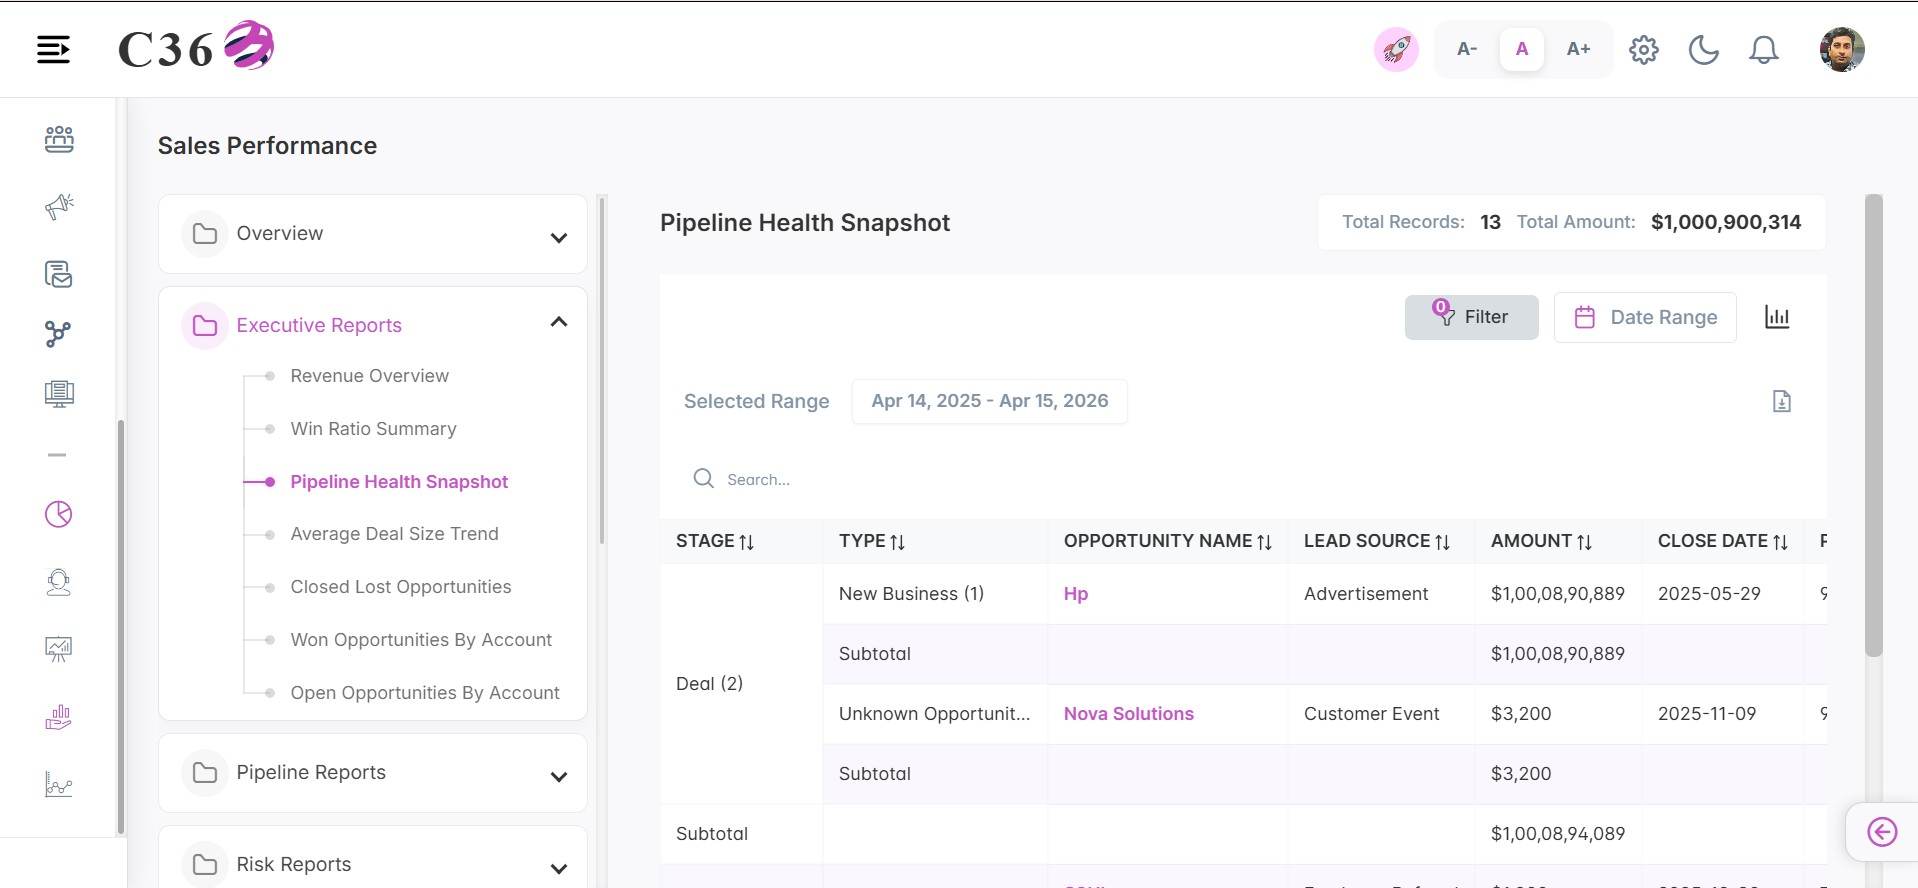
- Can Toggle between Table view and Chart view. - Can Export/Download the report. - Can perform search in the table. - Can Filter by Date Range. - Can Filter by Country, Company and Users.
🧾 Columns included in the table view
| Field Name | Description |
|---|---|
| Stage | Current phase of the opportunity in the sales pipeline. |
| Type | Category of the opportunity (e.g., New Business, Existing Customer). |
| Opportunity Name | Unique name or title identifying the opportunity. |
| Lead Source | Origin from which the opportunity was generated (e.g., Web, Referral). |
| Amount | Expected revenue value of the opportunity. |
| Close Date | Expected or actual date when the opportunity will be closed. |
| Probability | Likelihood (in %) of the opportunity being successfully closed. |
| Fiscal Period | Financial period (month/quarter/year) associated with the opportunity. |
| Age | Number of days since the opportunity was created. |
| Created Date | Date when the opportunity record was created. |
| Opportunity Owner | User responsible for managing and closing the opportunity. |
| Account Name | Name of the associated customer or business account. |
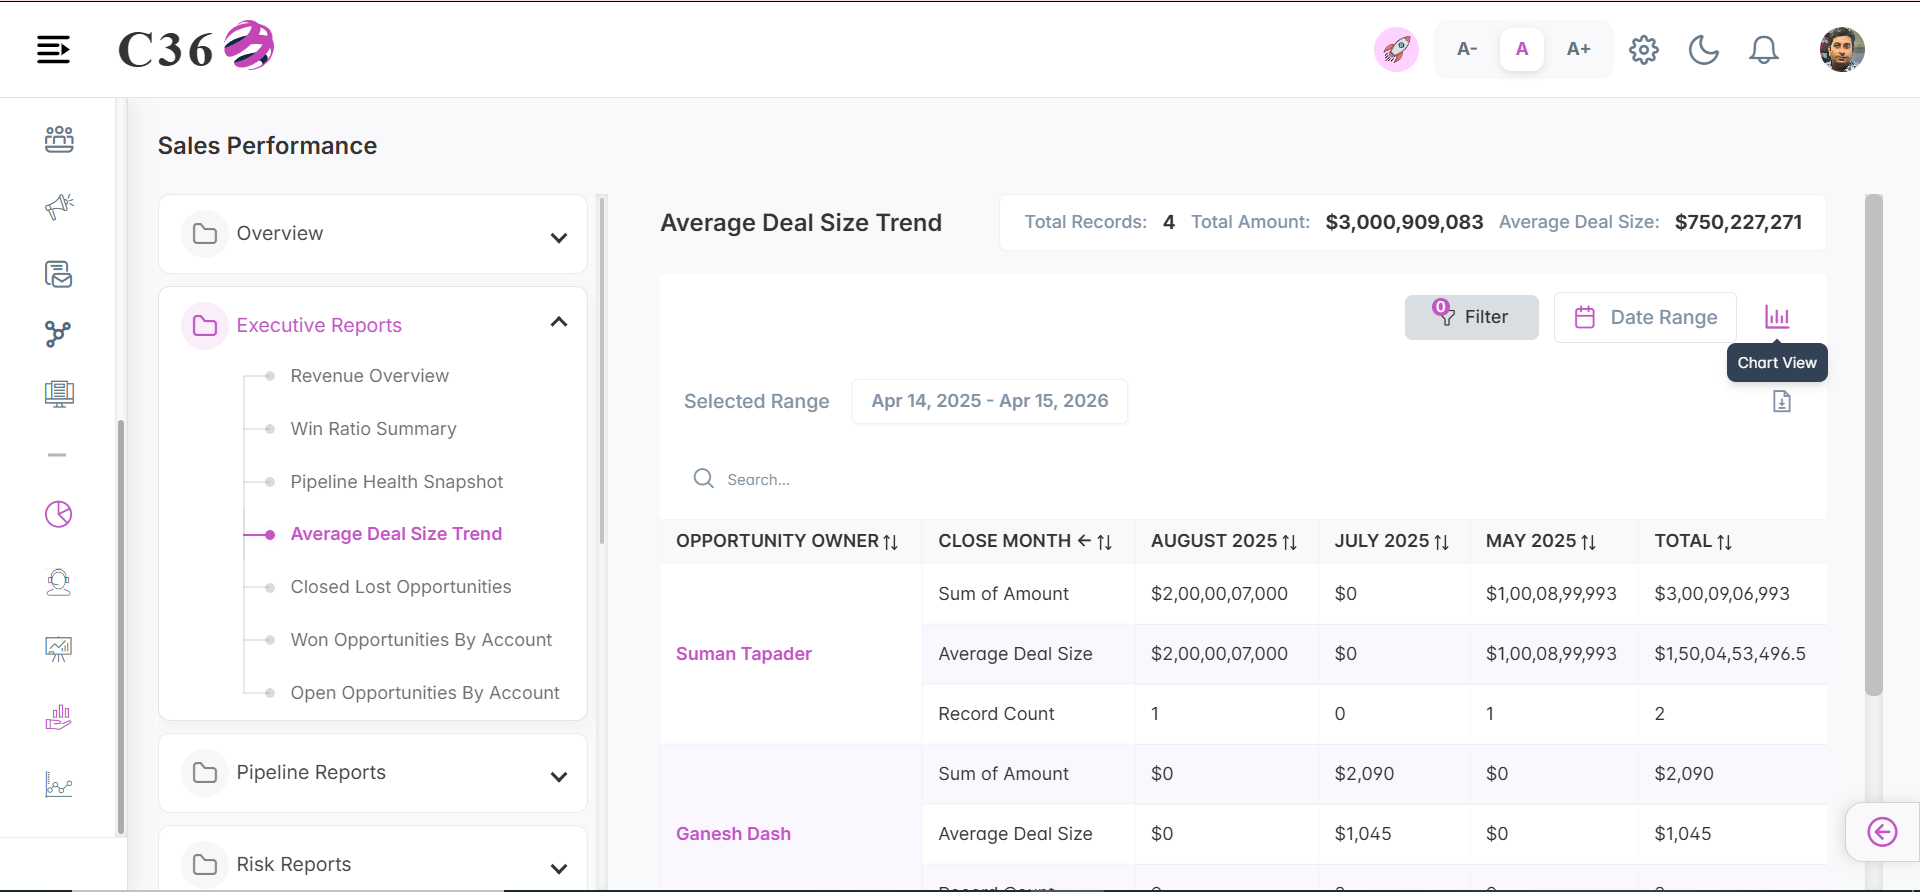
📏 Average Deal Size Trend
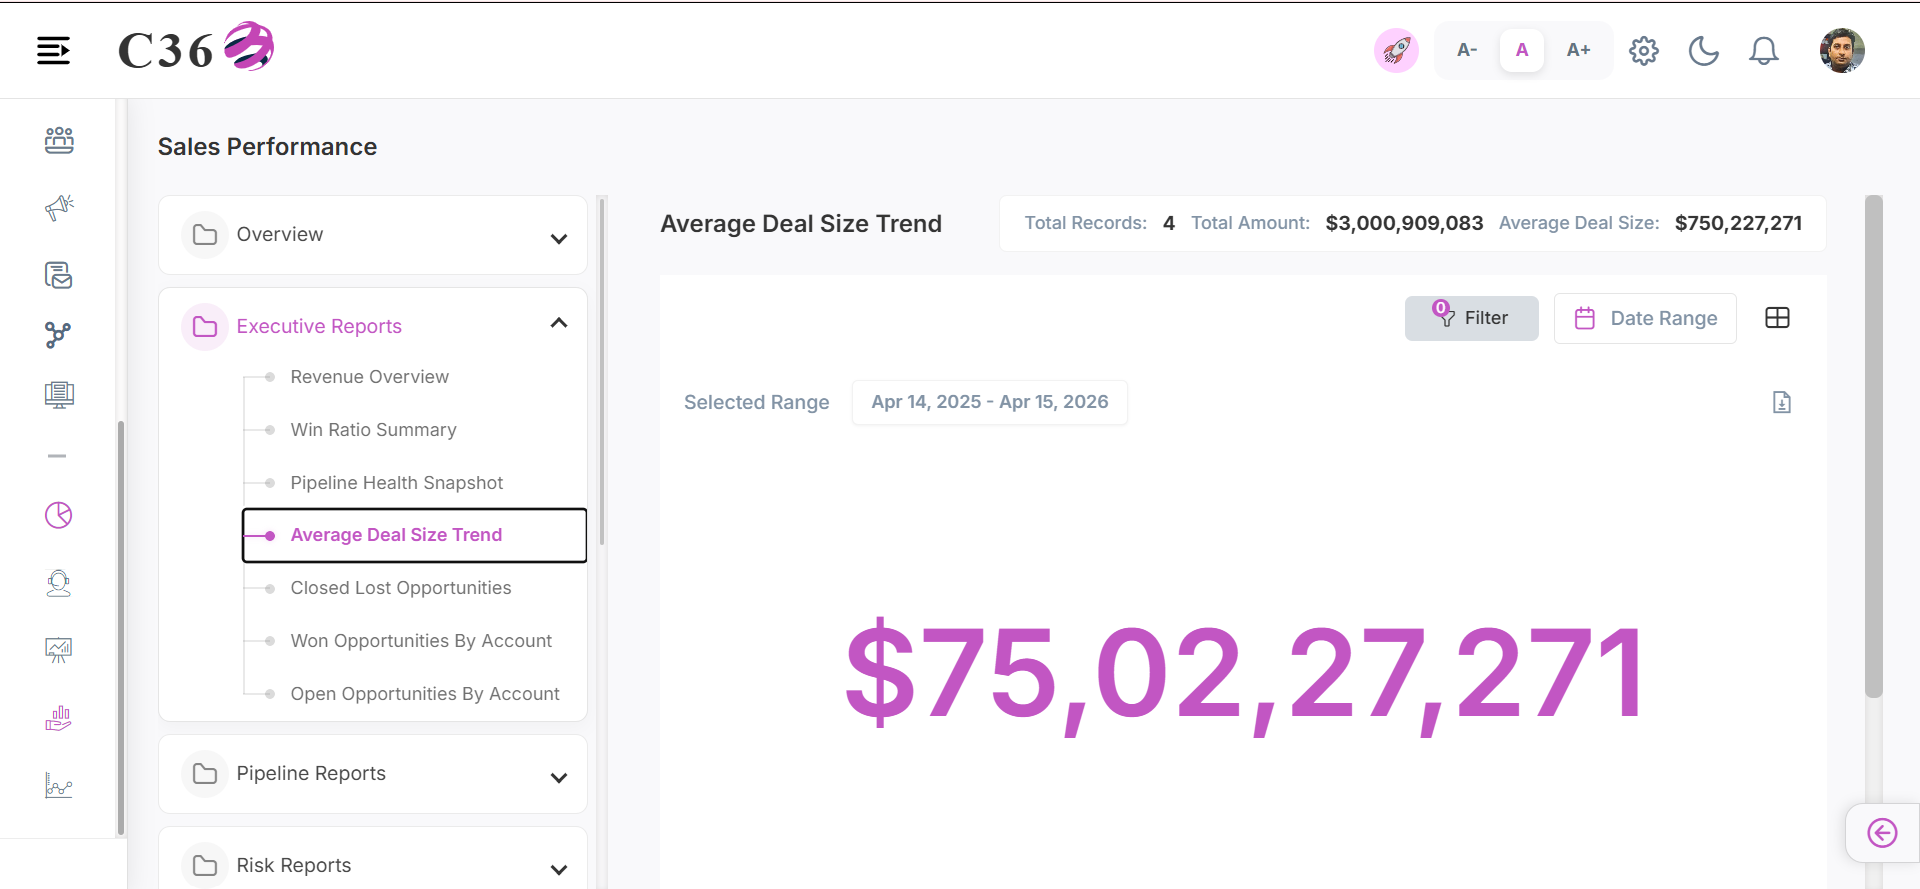
Tracks the historical changes in average deal value to identify shifting market patterns.
- 📊 Chart View
- 📋 Table View
Click to see quick actions
- Can Toggle between Table view and Chart view. - Can Export/Download the report. - Can Filter by Date Range. - Can Filter by Country, Company and Users.
Click to see quick actions
- Can Toggle between Table view and Chart view. - Can Export/Download the report. - Can perform search in the table. - Can Filter by Date Range. - Can Filter by Country, Company and Users.
🧾 Columns included in the table view
| Field Name | Description |
|---|---|
| Opportunity Owner | User responsible for managing and closing the opportunity. |
| Close Month | Month in which the opportunity is expected to close. |
| May 2026 | Represents opportunities scheduled to close in May 2026. |
| Total | Total value of opportunities for the selected period. |
📉 Close Lost Opportunities
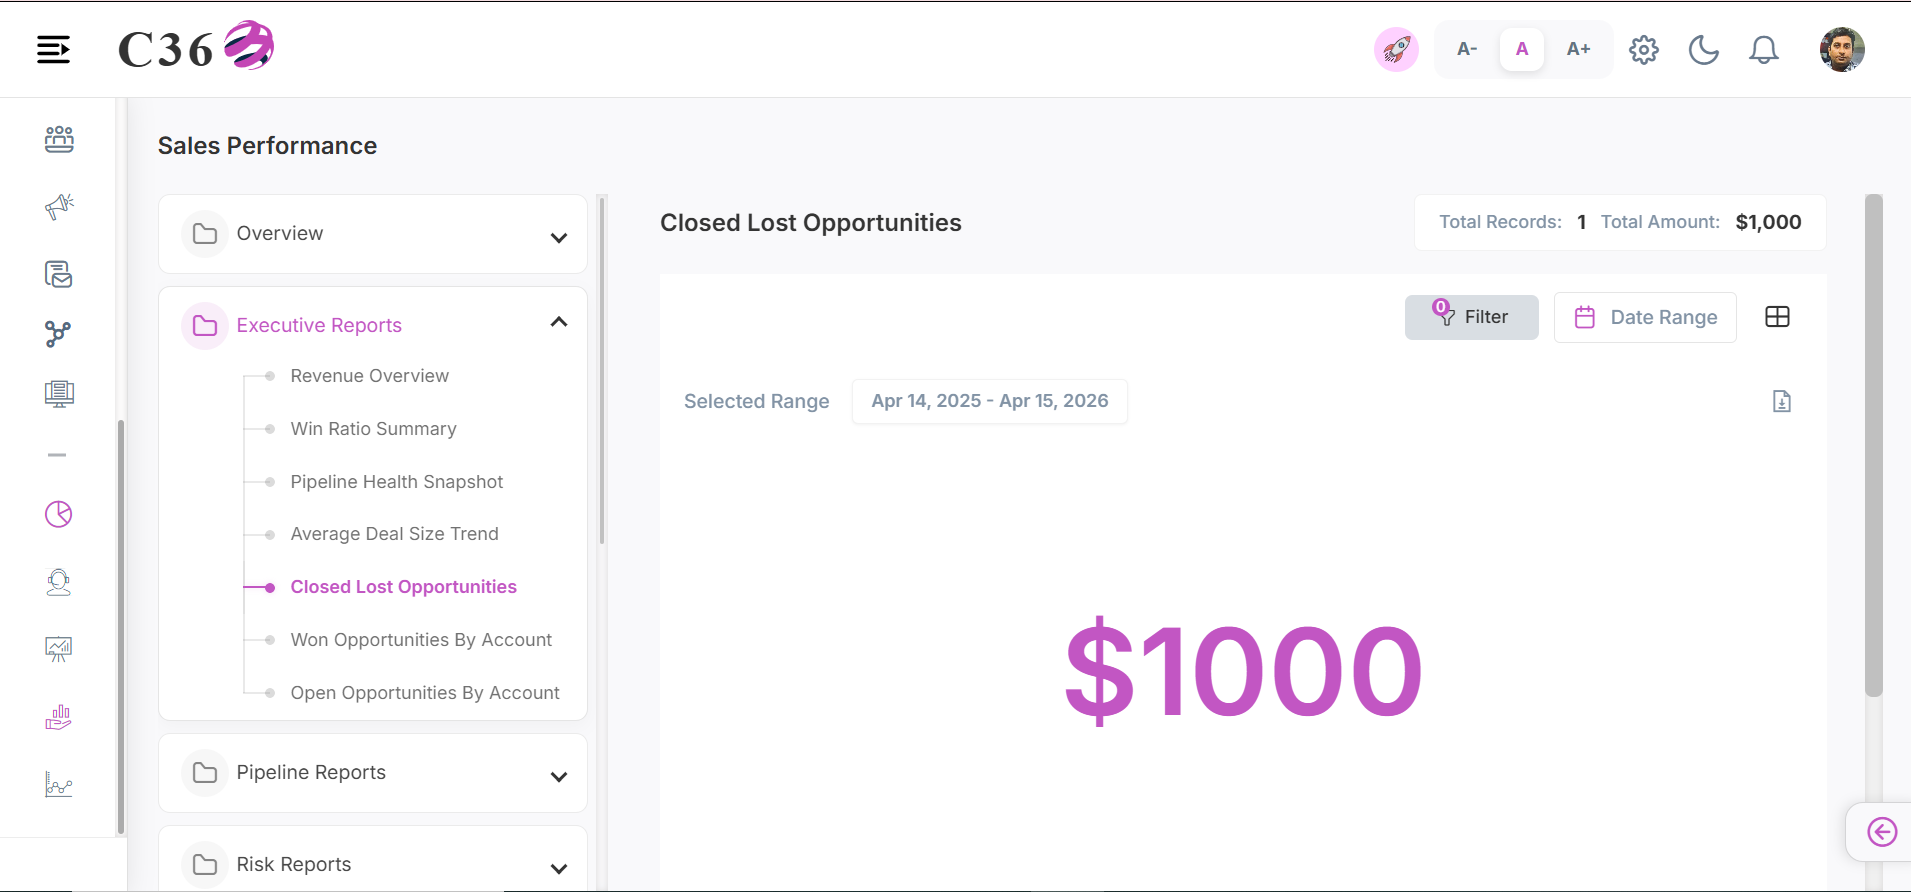
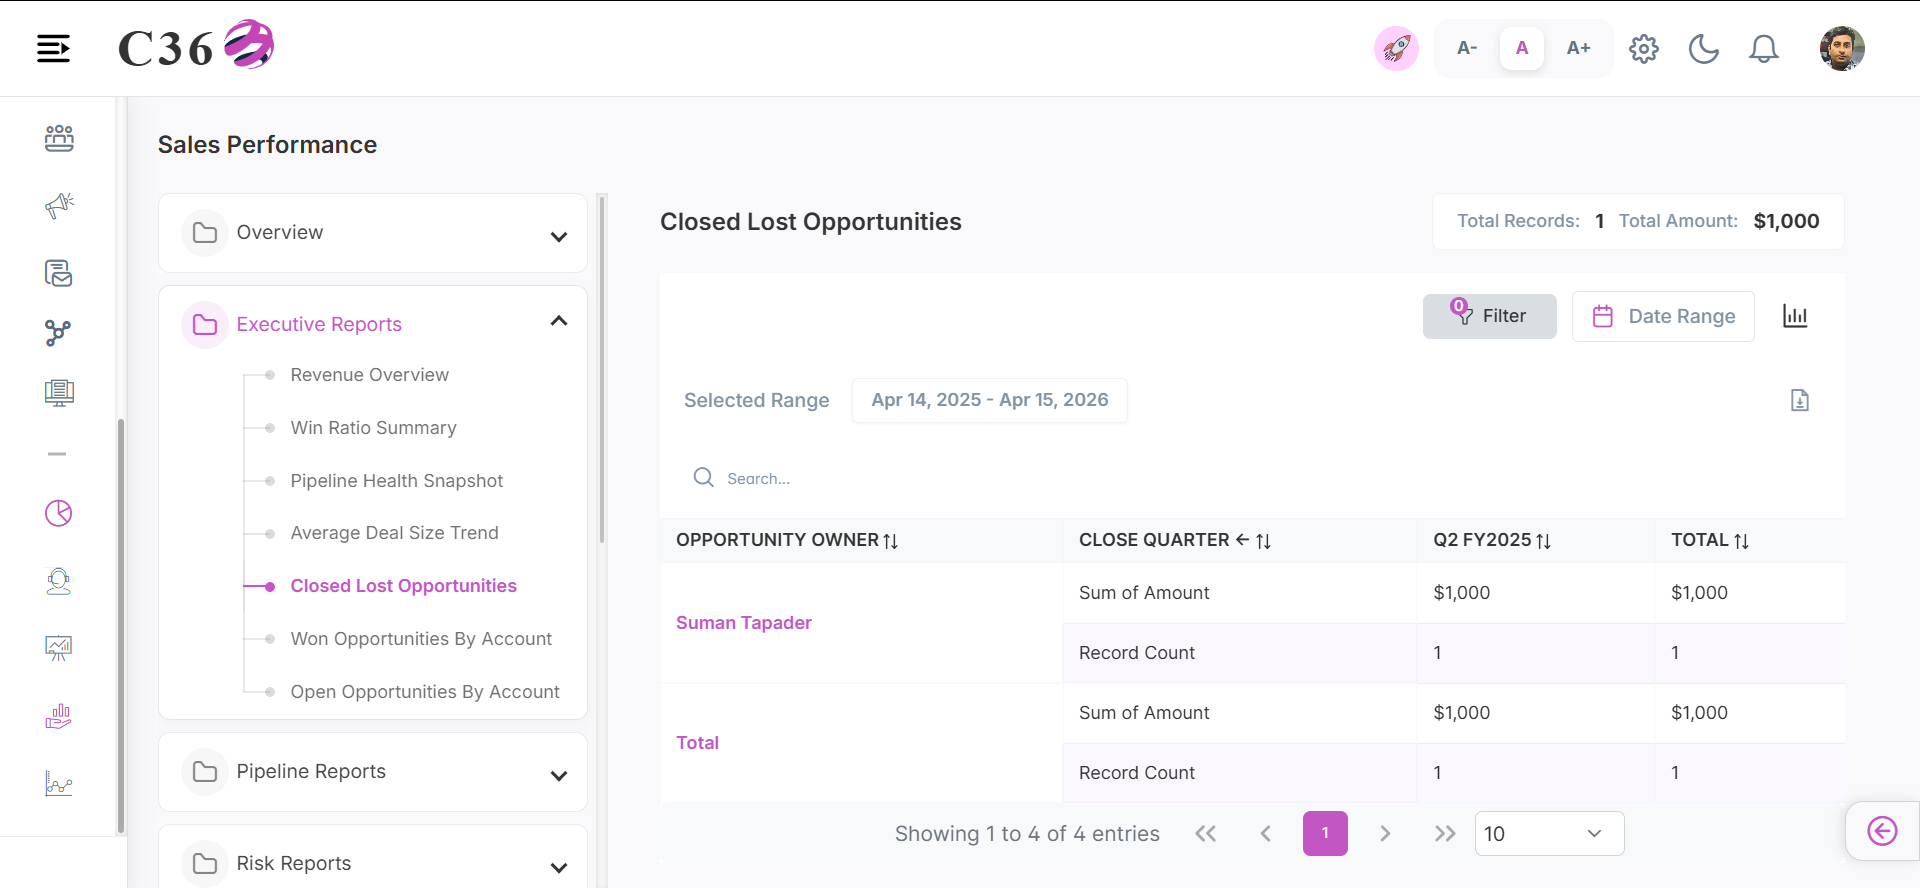
Evaluates lost deals to uncover trends and identify areas for strategic improvement.
- 📊 Chart View
- 📋 Table View
Click to see quick actions
- Can Toggle between Table view and Chart view. - Can Export/Download the report. - Can Filter by Date Range. - Can Filter by Country, Company and Users.
Click to see quick actions
- Can Toggle between Table view and Chart view. - Can Export/Download the report. - Can perform search in the table. - Can Filter by Date Range. - Can Filter by Country, Company and Users.
🧾 Columns included in the table view
| Field Name | Description |
|---|---|
| Opportunity Owner | User responsible for managing and closing the opportunity. |
| Close Quarter | Quarter in which the opportunity is expected to close. |
| Q1 FY 2026 | Represents opportunities scheduled to close in the first quarter of fiscal year 2026. |
| Total | Total value or count of opportunities for the selected quarter. |
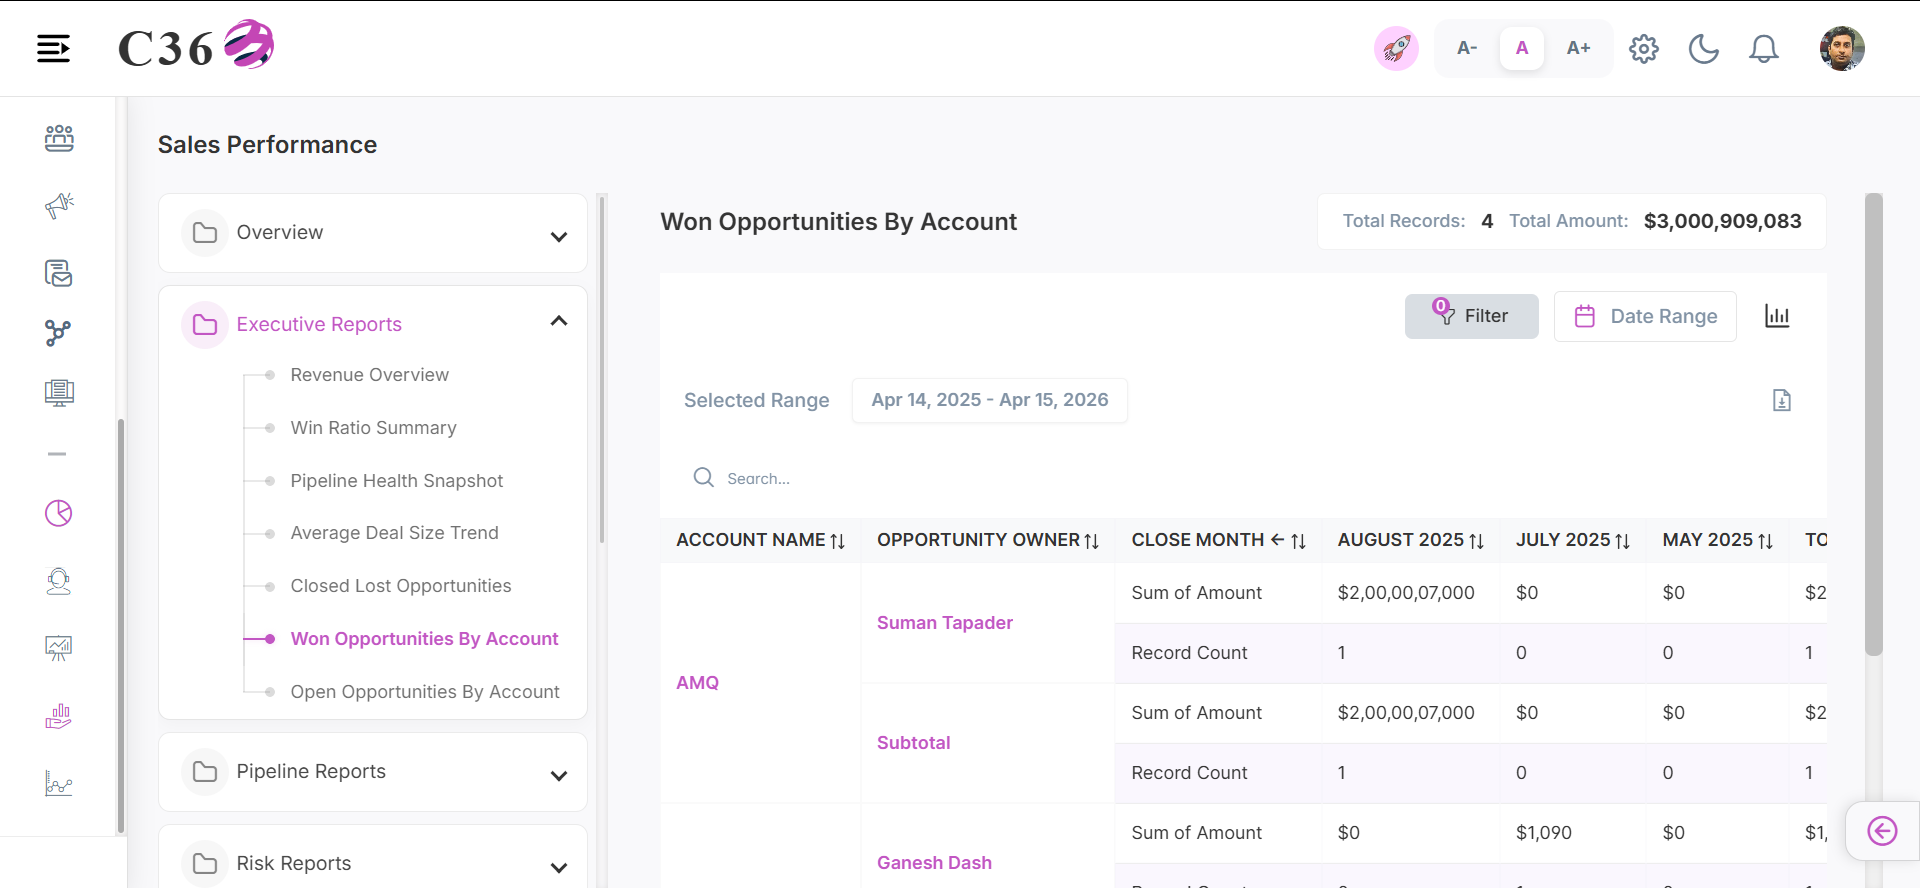
🤝 Won Opportunities By Account
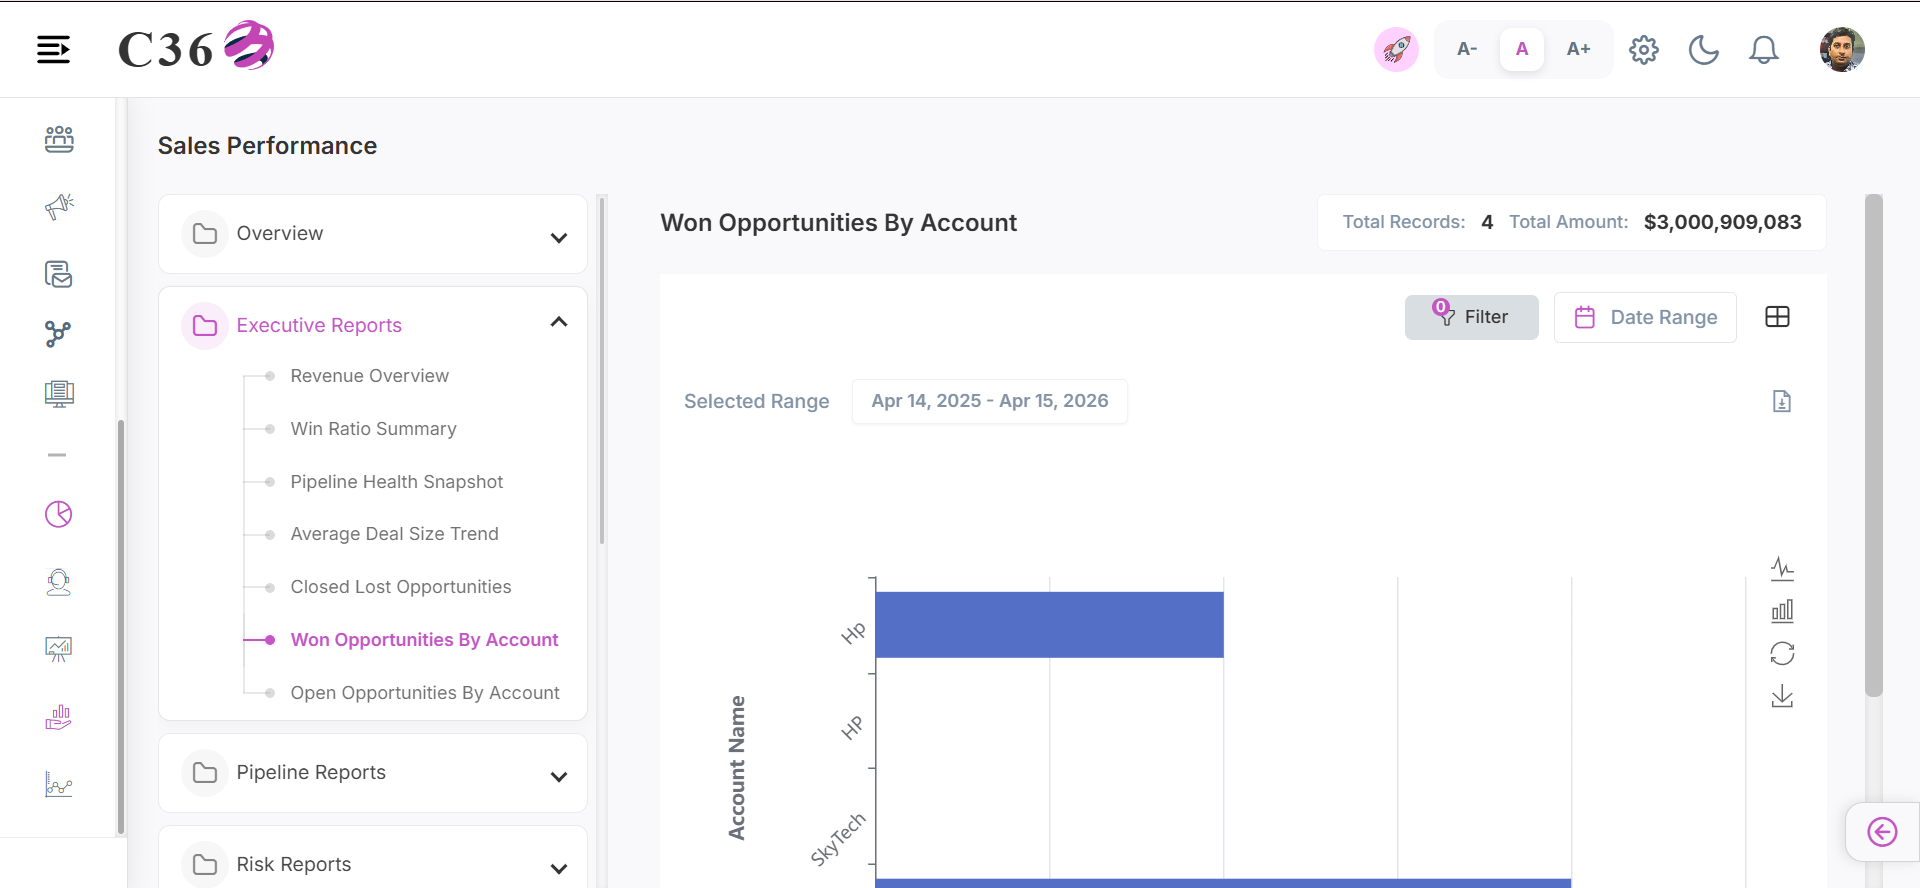
Highlights opportunities assigned directly to individual owners across respective accounts.
- 📊 Chart View
- 📋 Table View
Click to see quick actions
- Can Toggle between Table view and Chart view. - Can Export/Download the report. - Can Filter by Date Range. - Can Filter by Country, Company and Users. - Toggle between Line chart and Bar chart. - Save the Chart as an image. - Can Restore the bar chart.
Click to see quick actions
- Can Toggle between Table view and Chart view. - Can Export/Download the report. - Can perform search in the table. - Can Filter by Date Range. - Can Filter by Country, Company and Users.
🧾 Columns included in the table view
| Field Name | Description |
|---|---|
| Account Name | Name of the account associated with the opportunity. |
| Opportunity Owner | User responsible for managing and closing the opportunity. |
| Close Month | Month in which the opportunity is expected to close. |
| January 2026 | Represents opportunities scheduled to close in January 2026. |
| Total | Total value or count of opportunities for the selected month. |
📂 Open Opportunities By Account
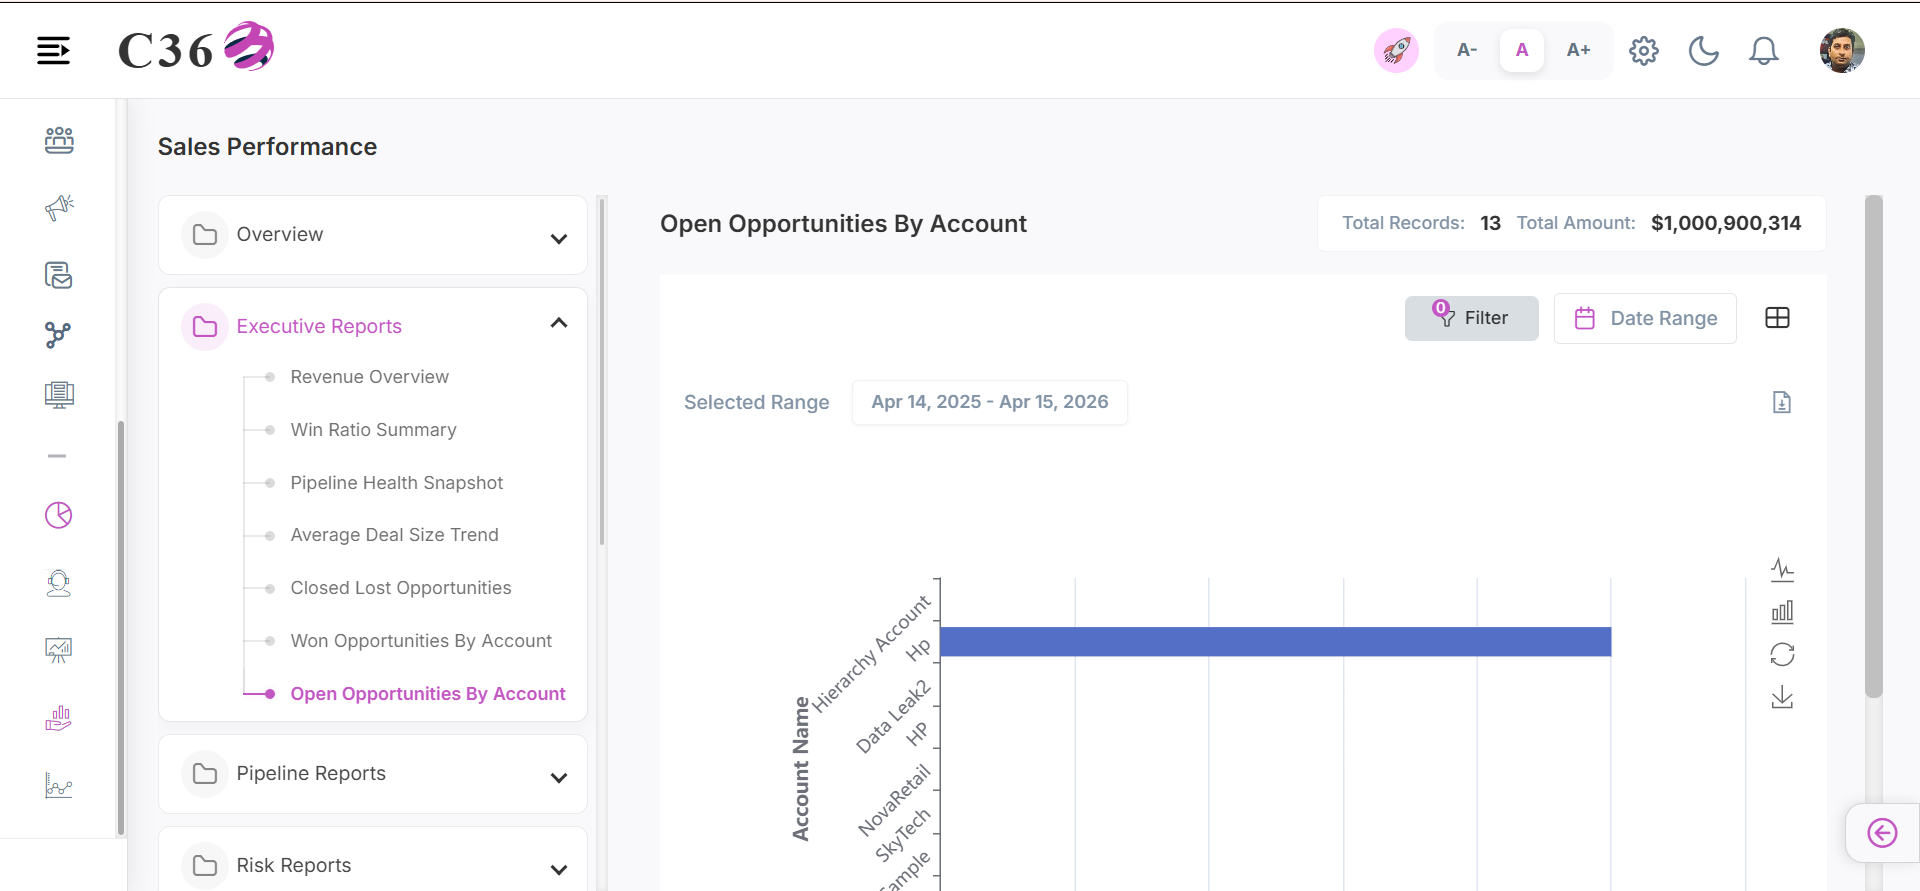
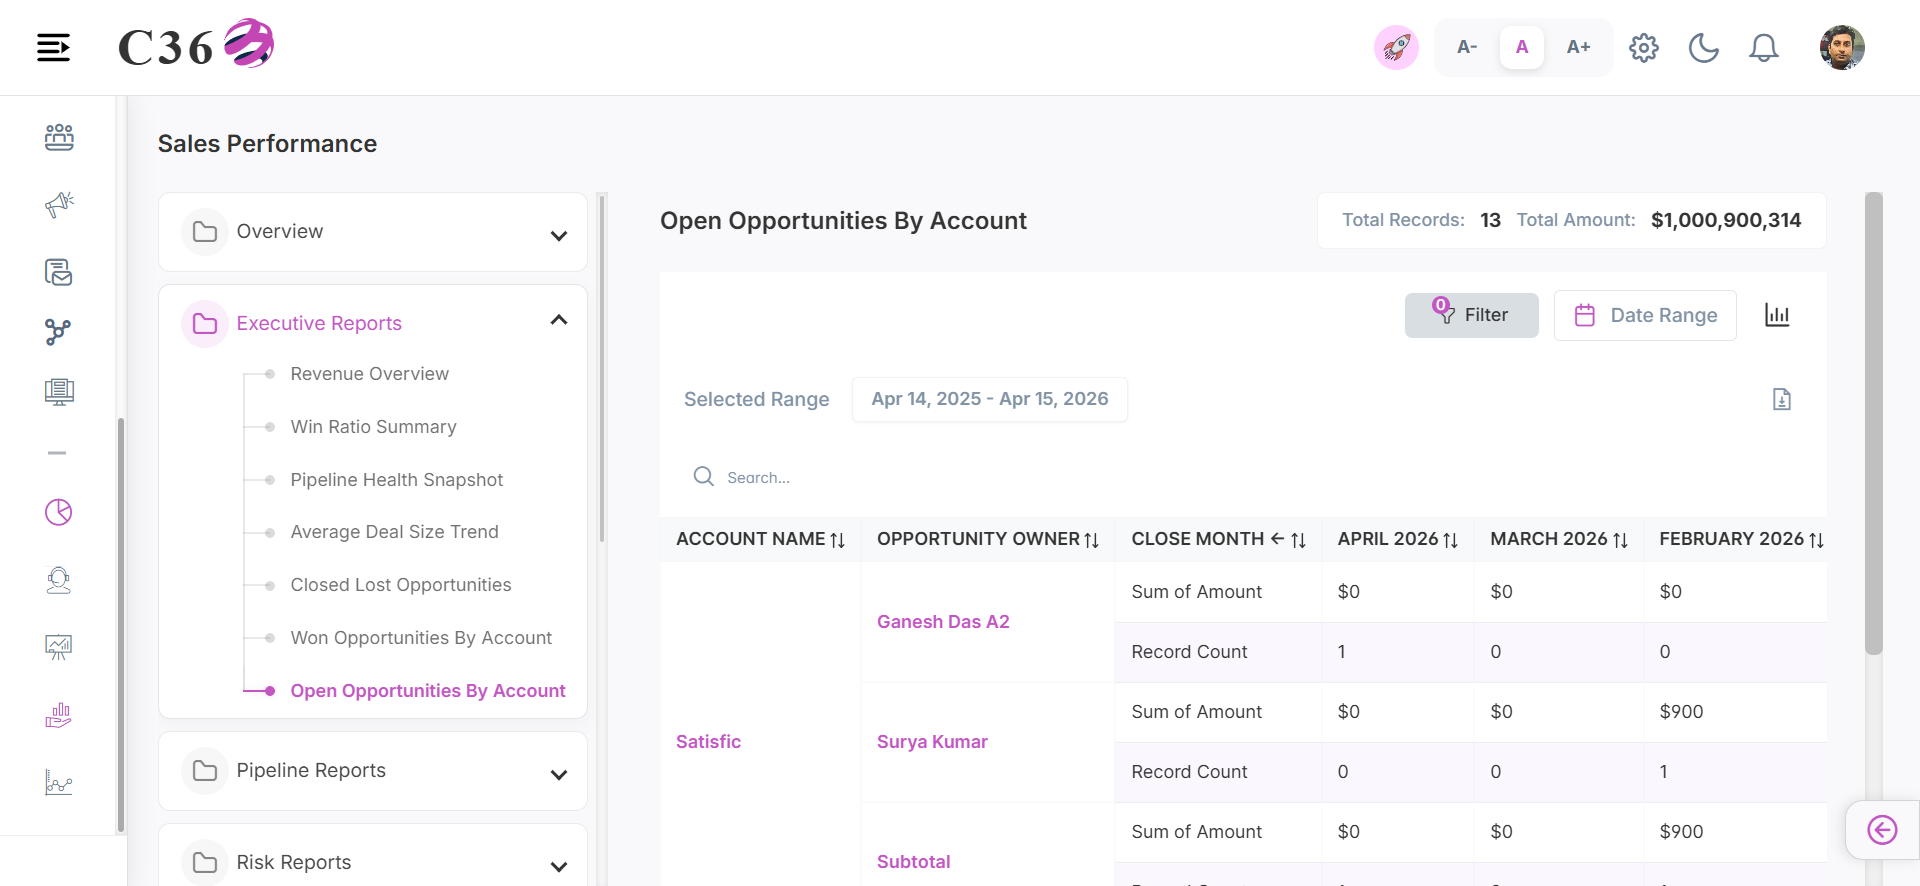
Summarizes the distribution of active, ongoing opportunities organized by specific accounts.
- 📊 Chart View
- 📋 Table View
Click to see quick actions
- Can Toggle between Table view and Chart view. - Can Export/Download the report. - Can Filter by Date Range. - Can Filter by Country, Company and Users. - Toggle between Line chart and Bar chart. - Save the Chart as an image. - Can Restore the bar chart.
Click to see quick actions
- Can Toggle between Table view and Chart view. - Can Export/Download the report. - Can perform search in the table. - Can Filter by Date Range. - Can Filter by Country, Company and Users.
🧾 Columns included in the table view
| Field Name | Description |
|---|---|
| Account Name | Name of the account associated with the opportunity. |
| Opportunity Owner | User responsible for managing and closing the opportunity. |
| Close Month | Month in which the opportunity is expected to close. |
| January 2026 | Represents opportunities scheduled to close in January 2026. |
| Total | Total value or count of opportunities for the selected month. |
━━━━━━━━━━━━━━━━━━━━━━━━━━━━━━━━━━━━━━━━━━━━━━━━━━━━━━━━━━━━━━━━━━━━━━━━━━━━━━━━━━━━━
🔀 Pipeline Reports
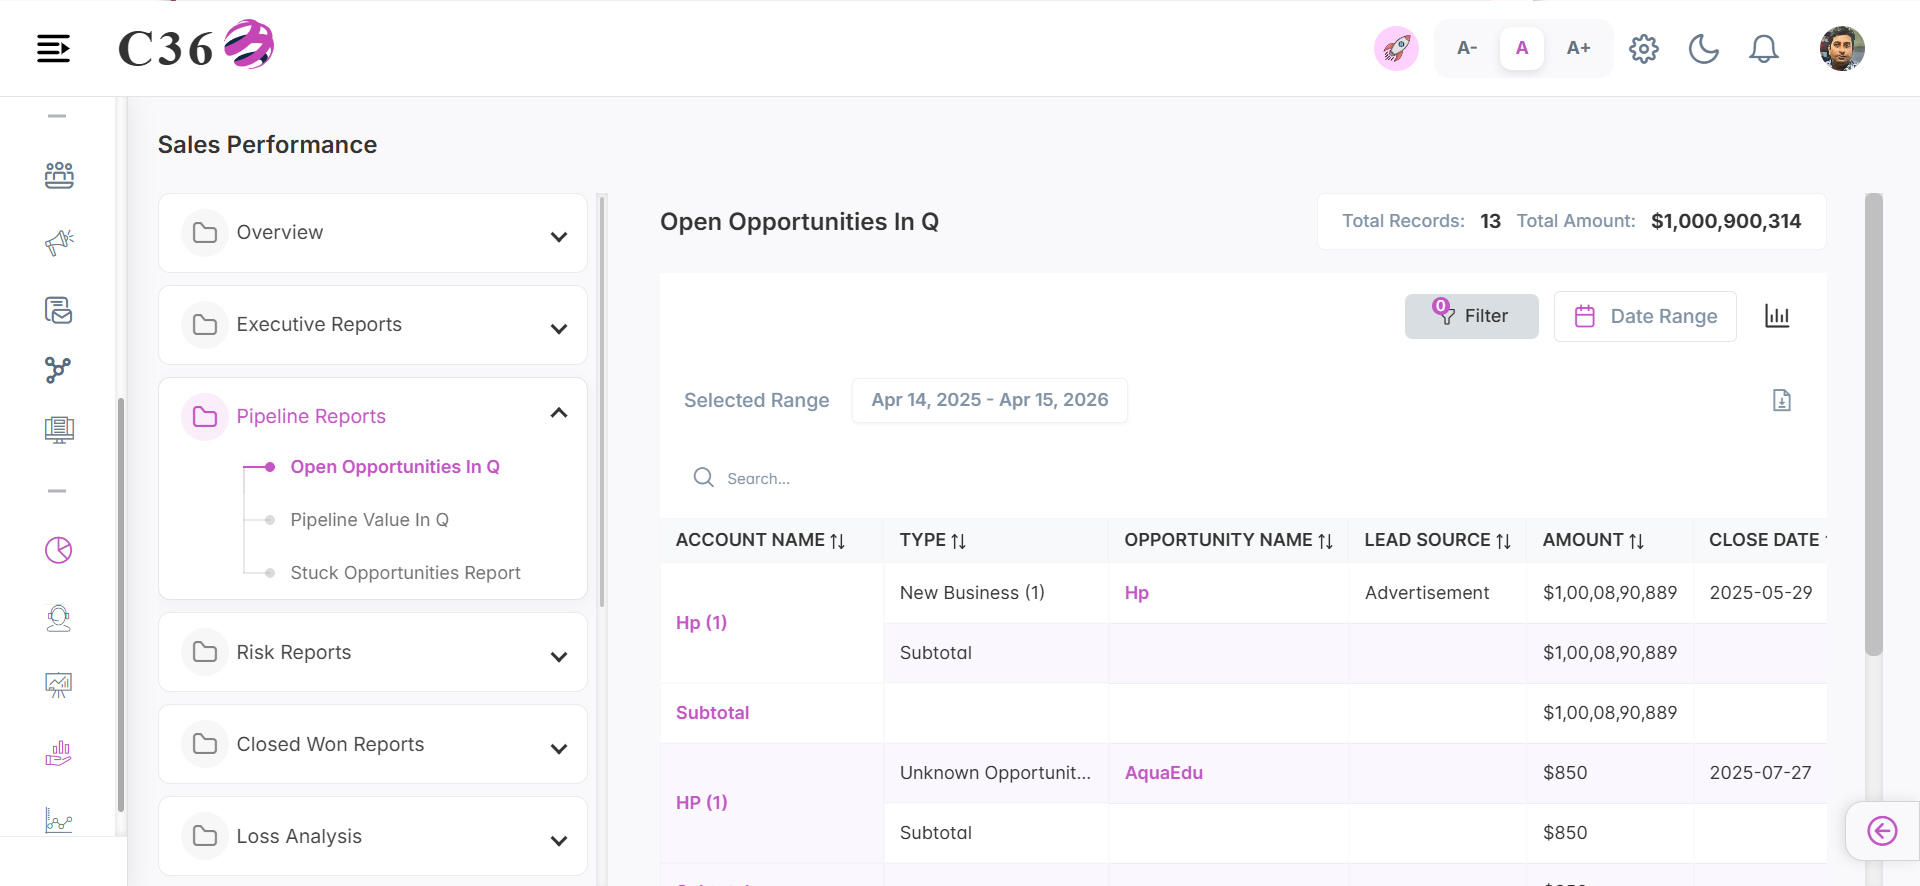
⏳ Open Opportunities In Q
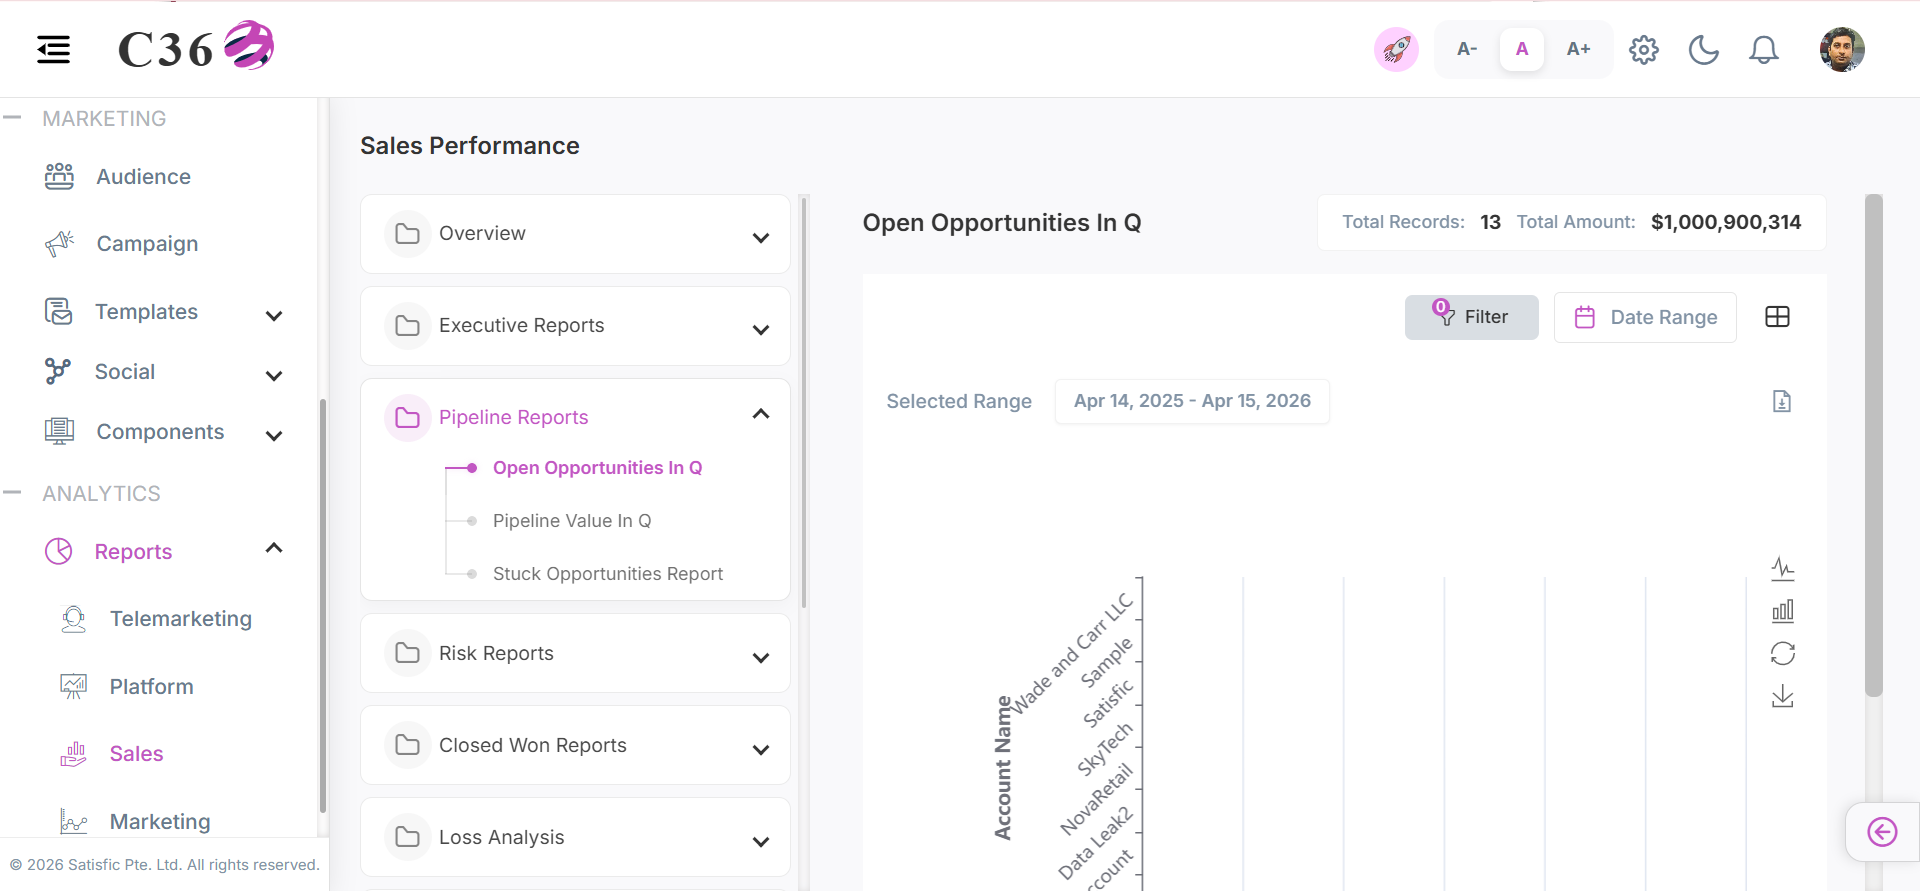
Monitors all active opportunities expected to close within the current business quarter.
- 📊 Chart View
- 📋 Table View
Click to see quick actions
- Can Toggle between Table view and Chart view. - Can Export/Download the report. - Can Filter by Date Range. - Can Filter by Country, Company and Users. - Toggle between Line chart and Bar chart. - Save the Chart as an image. - Can Restore the bar chart.
Click to see quick actions
- Can Toggle between Table view and Chart view. - Can Export/Download the report. - Can perform search in the table view. - Can Filter by Date Range. - Can Filter by Country, Company and Users.
🧾 Columns included in the table view
| Field Name | Description |
|---|---|
| Stage | Current phase of the opportunity in the sales pipeline. |
| Type | Category of the opportunity (e.g., New Business, Existing Customer). |
| Opportunity Name | Unique name or title identifying the opportunity. |
| Lead Source | Origin from which the opportunity was generated (e.g., Web, Referral). |
| Amount | Expected revenue value of the opportunity. |
| Close Date | Expected or actual date when the opportunity will be closed. |
| Probability | Likelihood (in %) of the opportunity being successfully closed. |
| Fiscal Period | Financial period (month/quarter/year) associated with the opportunity. |
| Age | Number of days since the opportunity was created. |
| Created Date | Date when the opportunity record was created. |
| Opportunity Owner | User responsible for managing and closing the opportunity. |
| Account Name | Name of the associated customer or business account. |
💵 Pipeline Value In Q
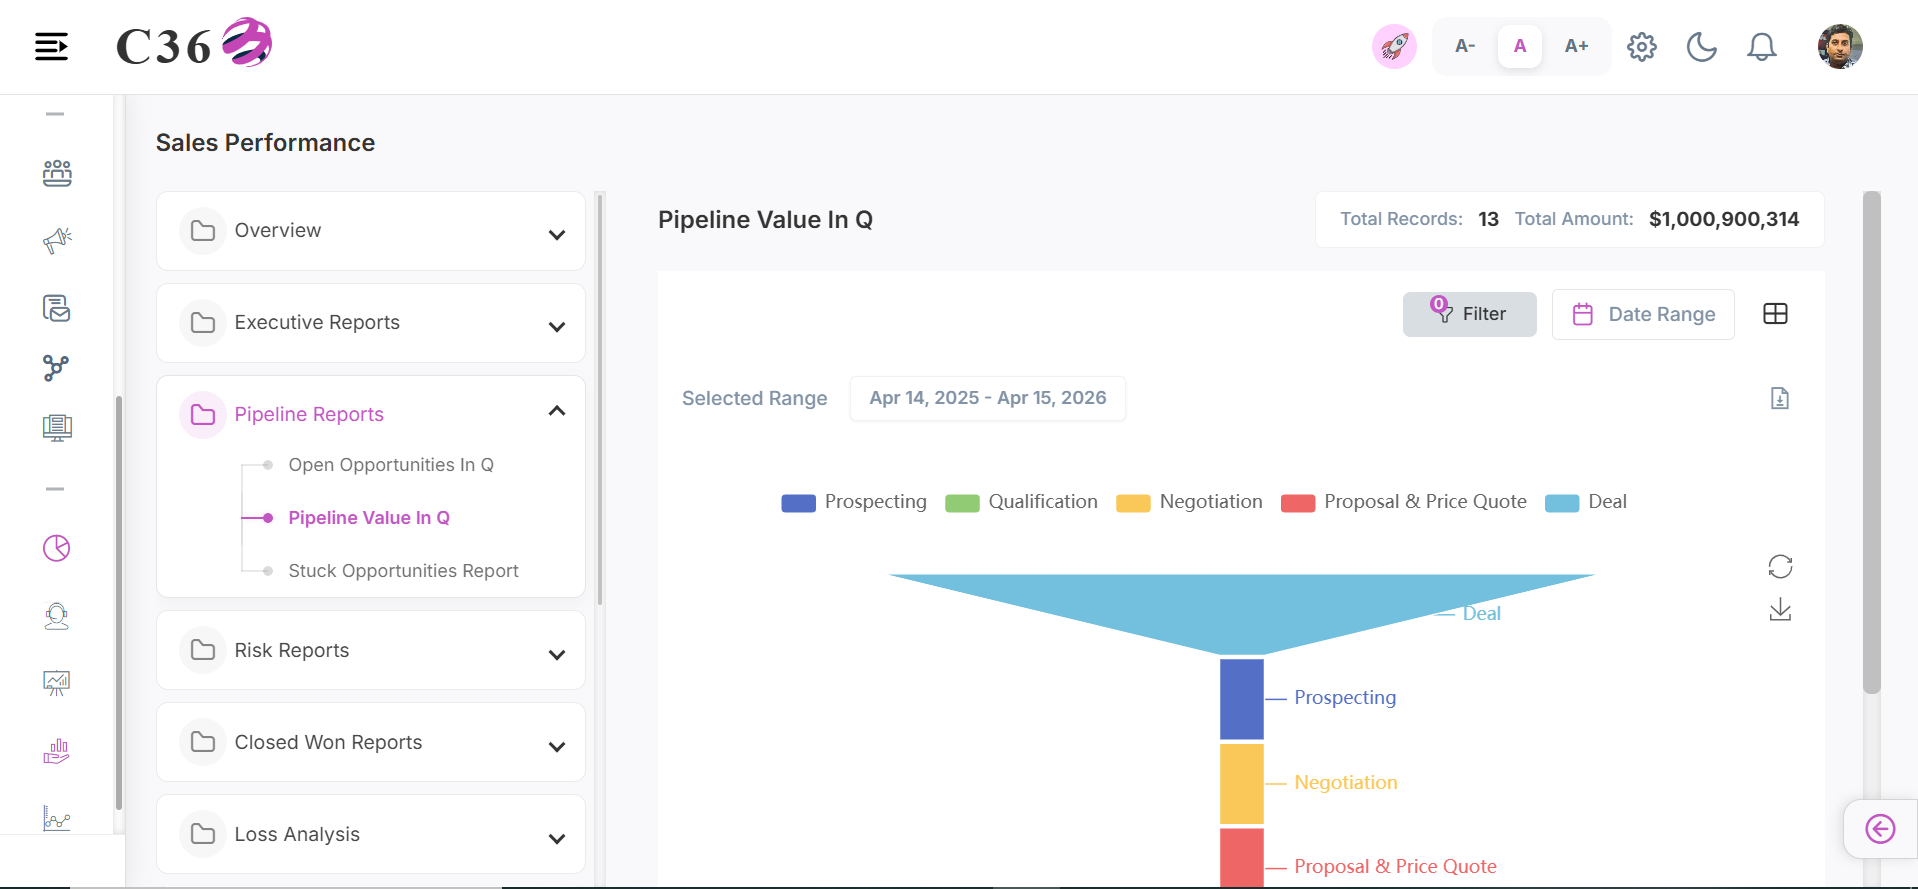
Calculates the projected financial value of all opportunities forecasted for this quarter.
- 📊 Chart View
- 📋 Table View
Click to see quick actions
- Can Toggle between Table view and Chart view. - Can filter the funnel by selecting or unselecting the color buttons. - Can restore the bar chart. - Save the chart as an image. - Can Export/Download the report. - Can Filter by Date Range. - Can Filter by Country, Company and Users.
Click to see quick actions
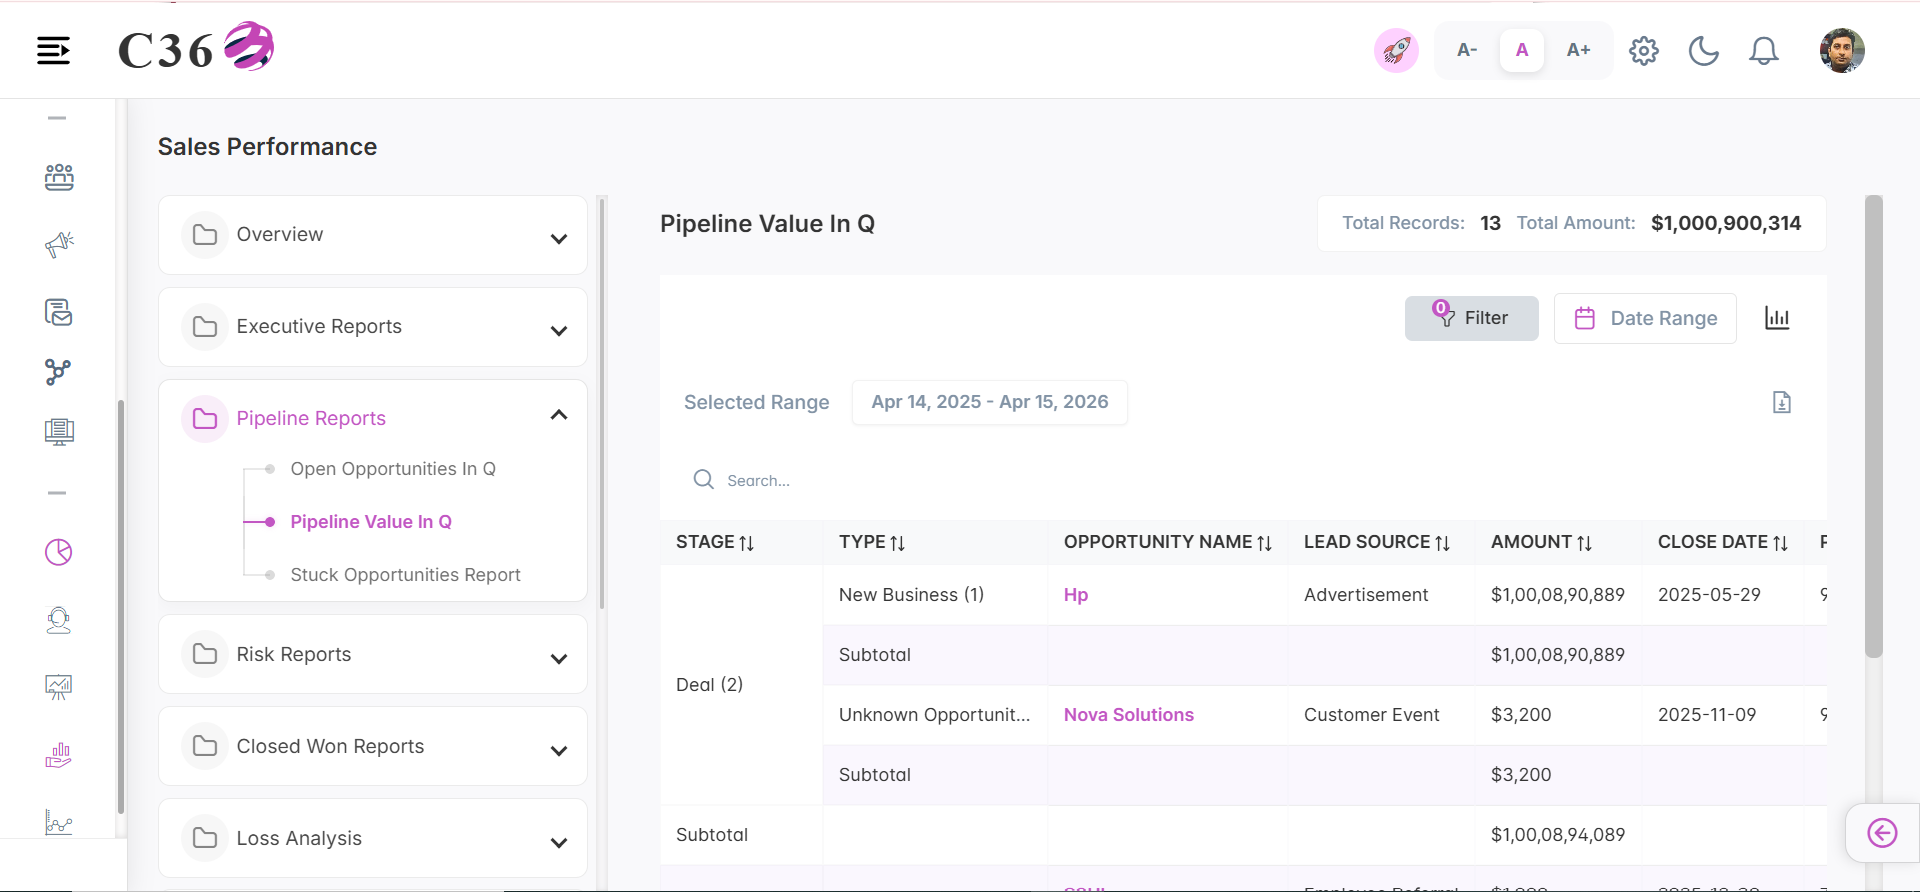
- Can Toggle between Table view and Chart view. - Can Export/Download the report. - Can perform search in the table view. - Can Filter by Date Range. - Can Filter by Country, Company and Users.
🧾 Columns included in the table view
| Field Name | Description |
|---|---|
| Stage | Current phase of the opportunity in the sales pipeline. |
| Type | Category of the opportunity (e.g., New Business, Existing Customer). |
| Opportunity Name | Unique name or title identifying the opportunity. |
| Lead Source | Origin from which the opportunity was generated (e.g., Web, Referral). |
| Amount | Expected revenue value of the opportunity. |
| Close Date | Expected or actual date when the opportunity will be closed. |
| Probability | Likelihood (in %) of the opportunity being successfully closed. |
| Fiscal Period | Financial period (month/quarter/year) associated with the opportunity. |
| Age | Number of days since the opportunity was created. |
| Created Date | Date when the opportunity record was created. |
| Opportunity Owner | User responsible for managing and closing the opportunity. |
| Account Name | Name of the associated customer or business account. |
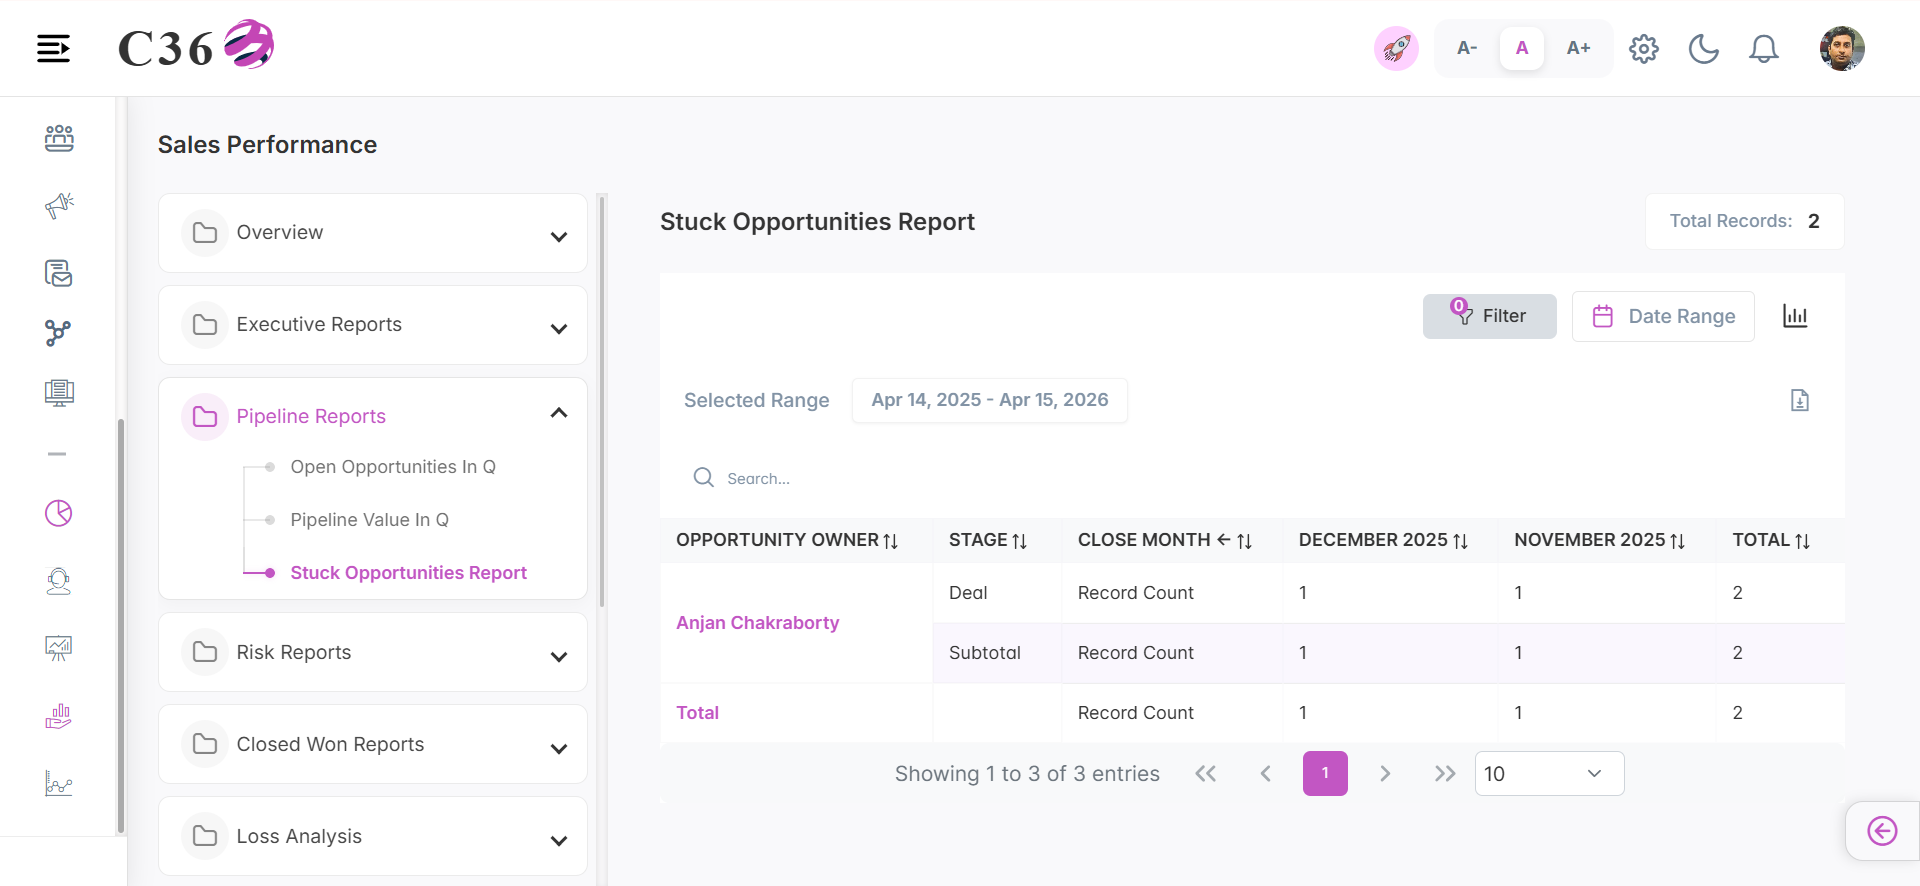
🛑 Stuck Opportunities Report
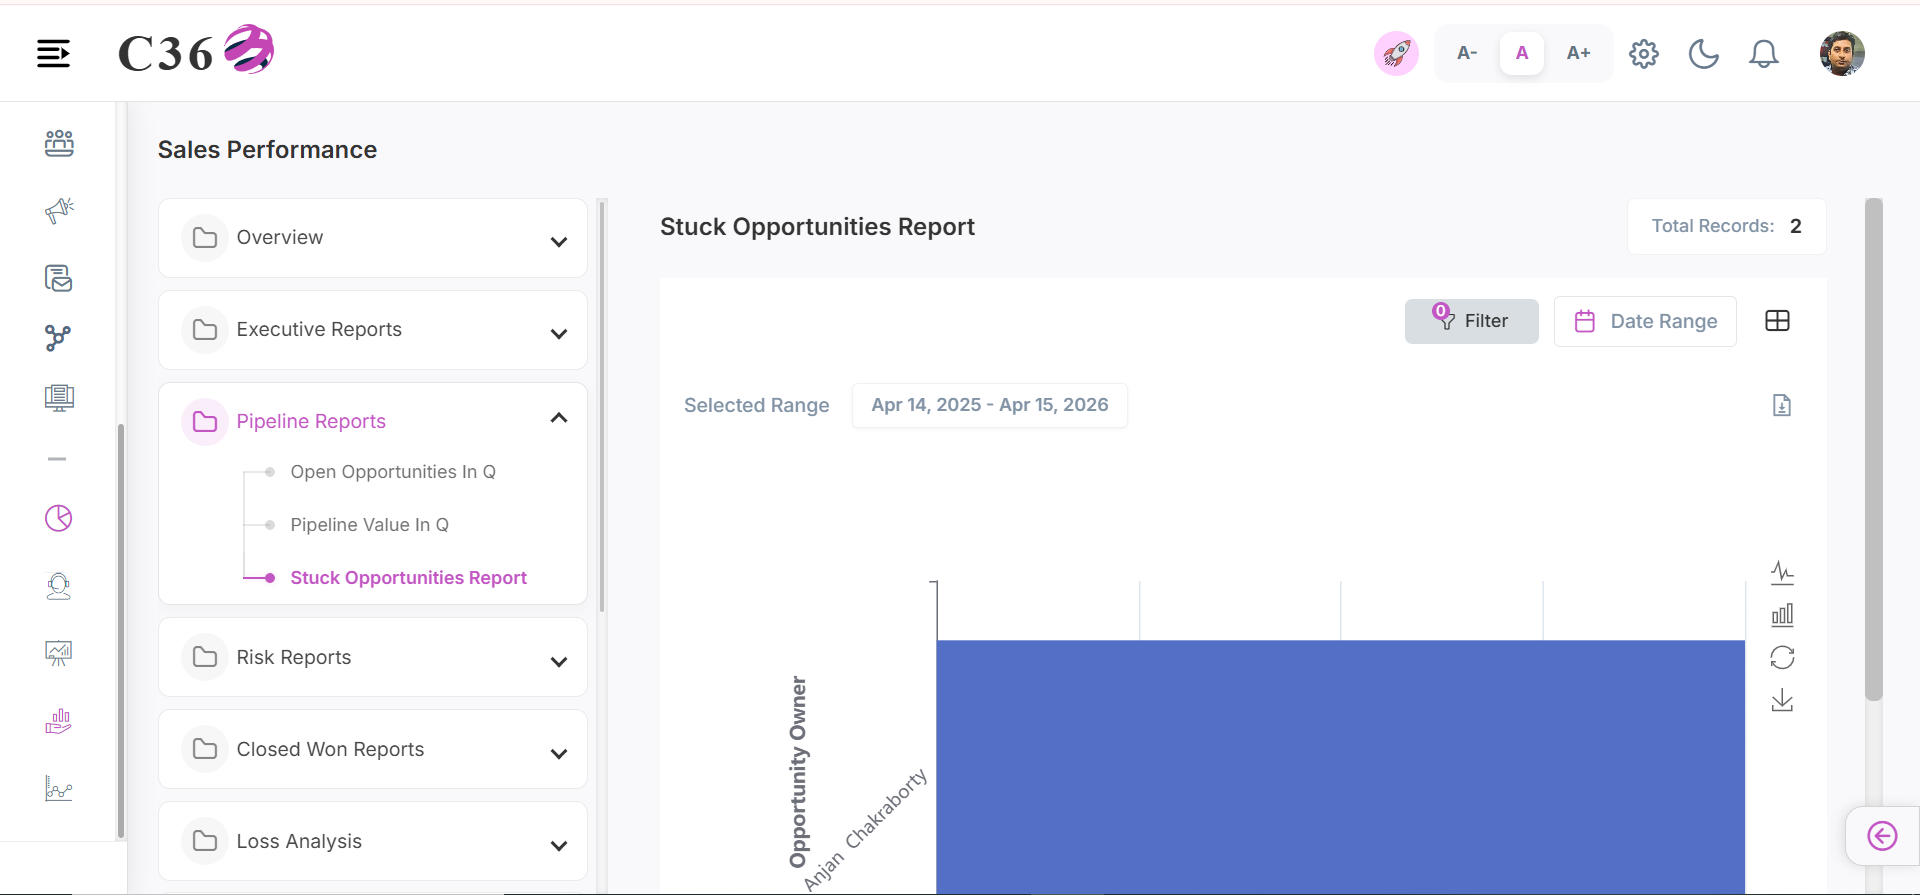
Identifies opportunities that have remained stagnant in the pipeline for an extended period.
- 📊 Chart View
- 📋 Table View
Click to see quick actions
- Can Toggle between Table view and Chart view. - Can Export/Download the report. - Can Filter by Date Range. - Can Filter by Country, Company and Users. - Toggle between Line chart and Bar chart. - Save the Chart as an image. - Can Restore the bar chart.
Click to see quick actions
- Can Toggle between Table view and Chart view. - Can Export/Download the report. - Can Perform search in the table view. - Can Filter by Date Range. - Can Filter by Country, Company and Users.
🧾 Columns included in the table view
| Field Name | Description |
|---|---|
| Opportunity Owner | User responsible for managing and closing the opportunity. |
| Stage | Current phase of the opportunity in the sales pipeline. |
| Close Month | Month in which the opportunity is expected to close. |
| January 2026 | Represents opportunities scheduled to close in January 2026. |
| Total | Total value or count of opportunities for the selected month. |
━━━━━━━━━━━━━━━━━━━━━━━━━━━━━━━━━━━━━━━━━━━━━━━━━━━━━━━━━━━━━━━━━━━━━━━━━━━━━━━━━━━━━
⚠️ Risk Reports
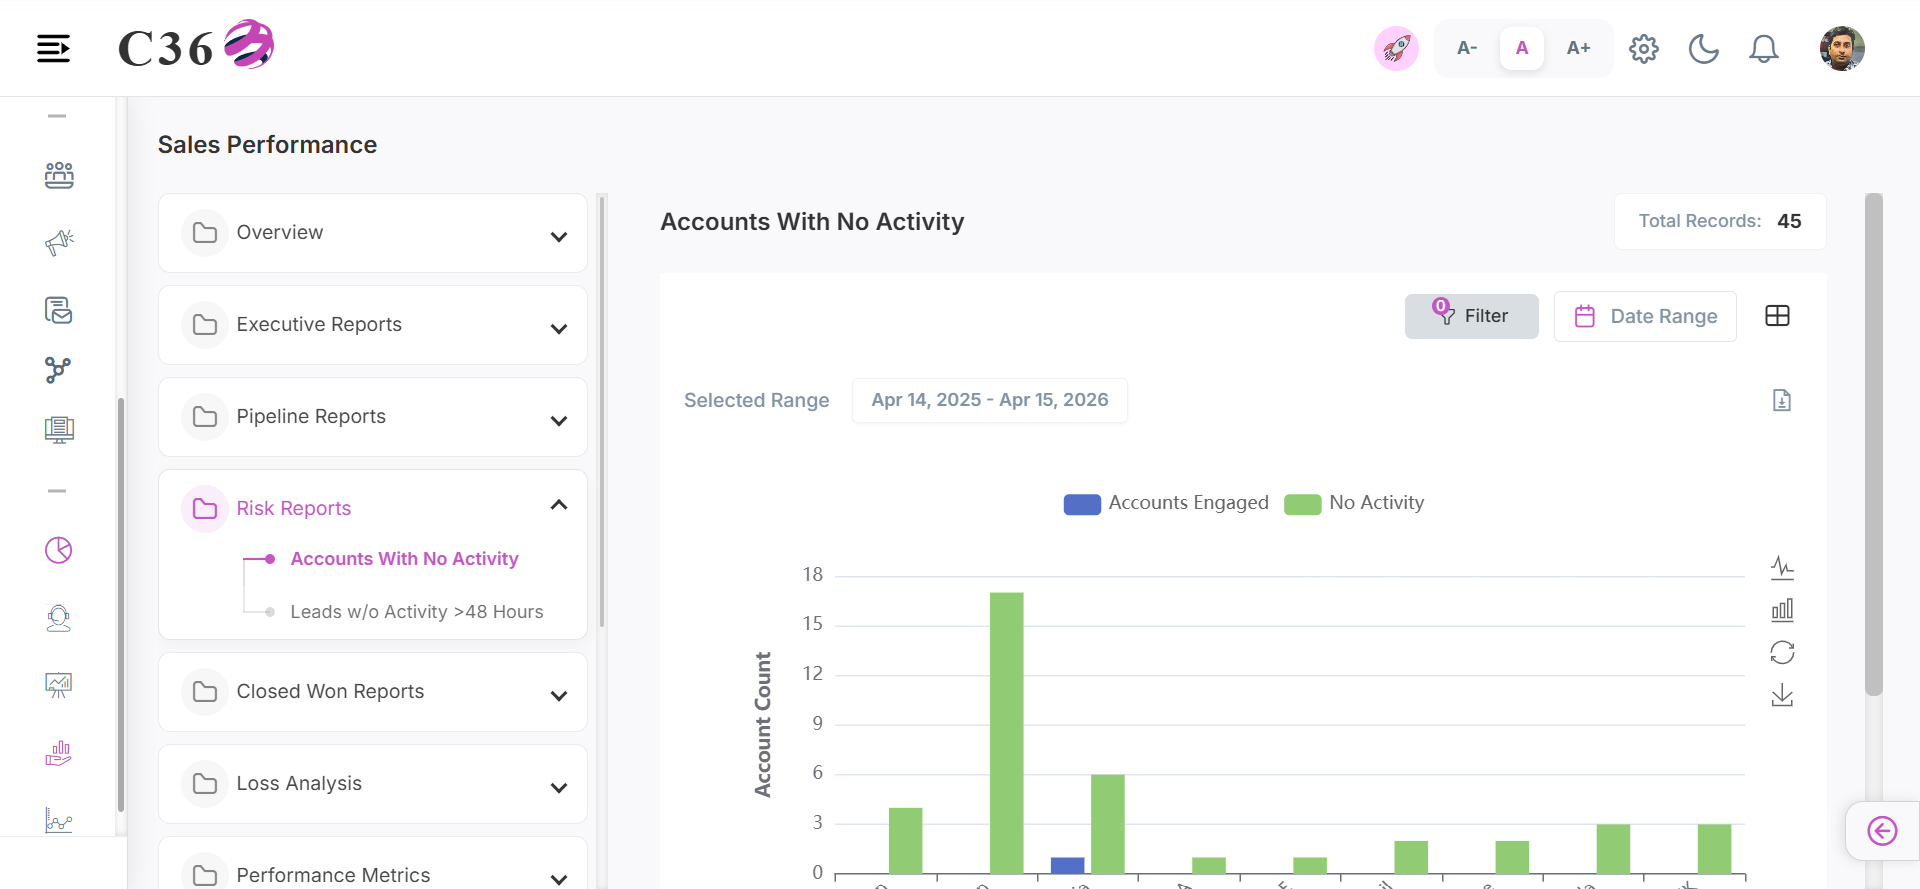
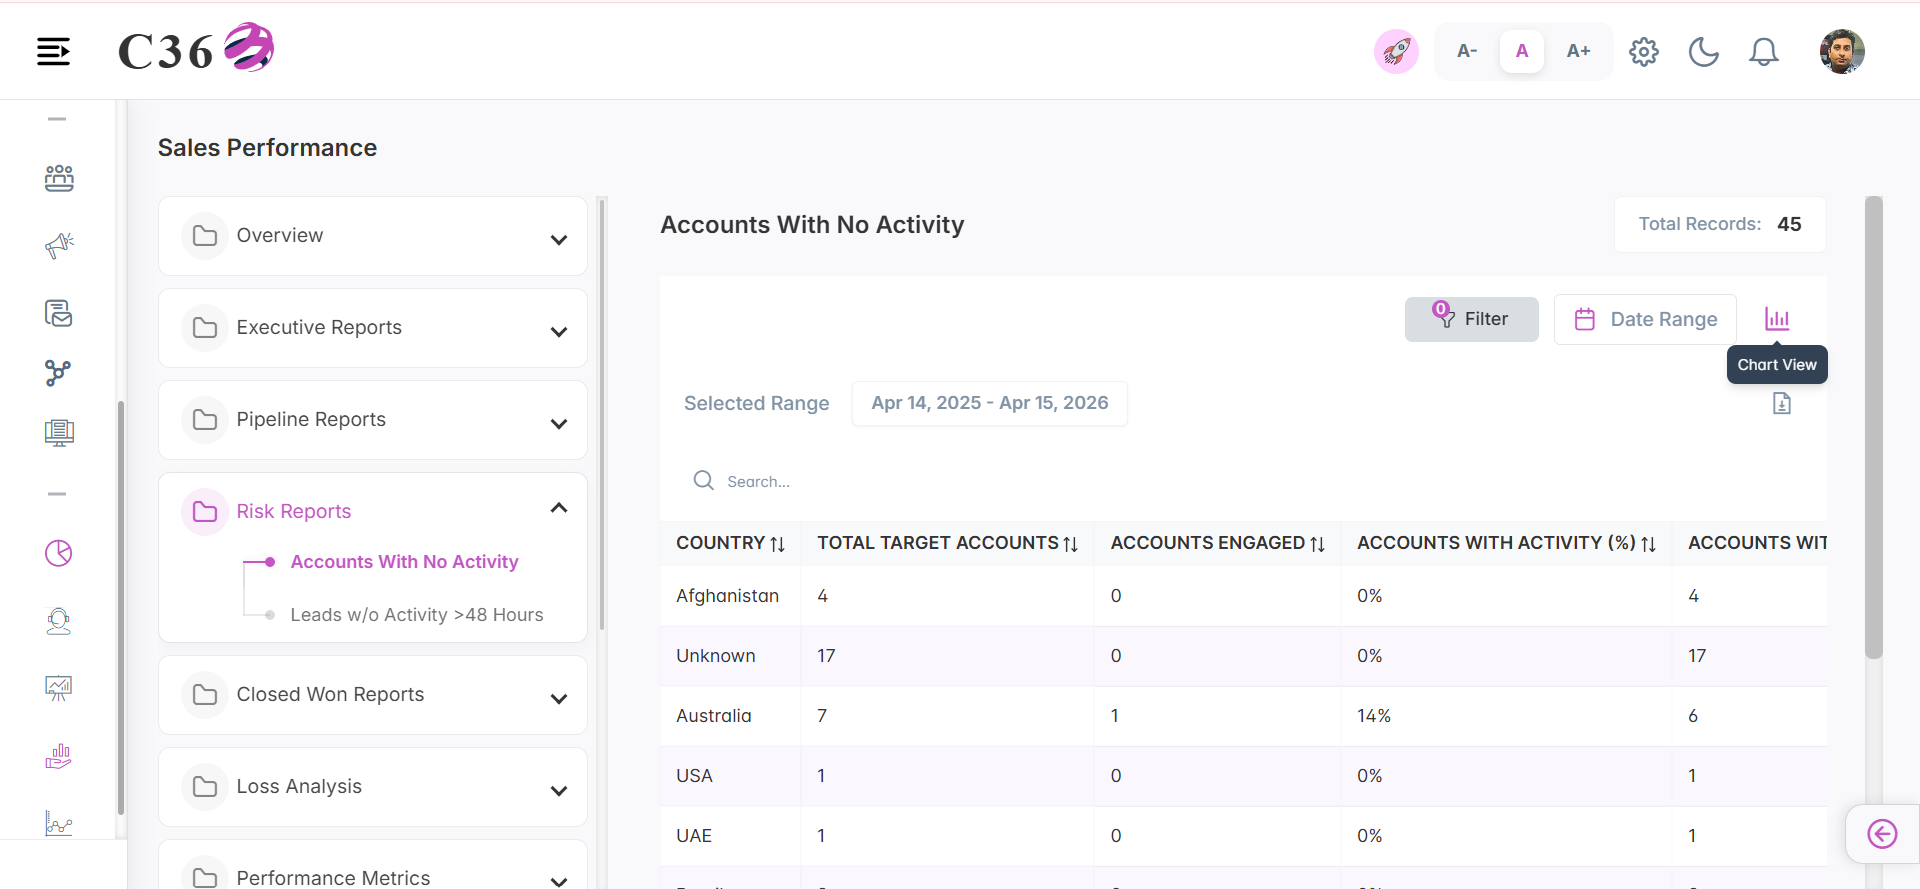
👻 Accounts With No Activity
Highlights assigned accounts that lack recent interactions or engagement from the sales team.
- 📊 Chart View
- 📋 Table View
Click to see quick actions
- Can Toggle between Table view and Chart view. - Can Filter the chart by selecting and unselecting the color buttons. - Can Export/Download the report.
- Can Filter by Date Range. - Can Filter by Country, Company and Users. - Toggle between Line chart and Bar chart. - Save the Chart as an image. - Can Restore the bar chart.
Click to see quick actions
- Can Toggle between Table view and Chart view. - Can Export/Download the report. - Can perform the search in the table view. - Can Filter by Date Range. - Can Filter by Country, Company and Users.
🧾 Columns included in the table view
| Field Name | Description |
|---|---|
| Country | Geographic location of the accounts. |
| Total Target Accounts | Total number of accounts targeted for engagement. |
| Accounts Engaged | Number of accounts with at least one interaction or engagement. |
| Accounts with Activity (%) | Percentage of accounts that have recorded activity. |
| Accounts with No Activity | Number of accounts with no recorded interactions. |
| No Activity (%) | Percentage of accounts without any activity. |
| Last Activity (Avg Days) | Average number of days since the last recorded activity across accounts. |
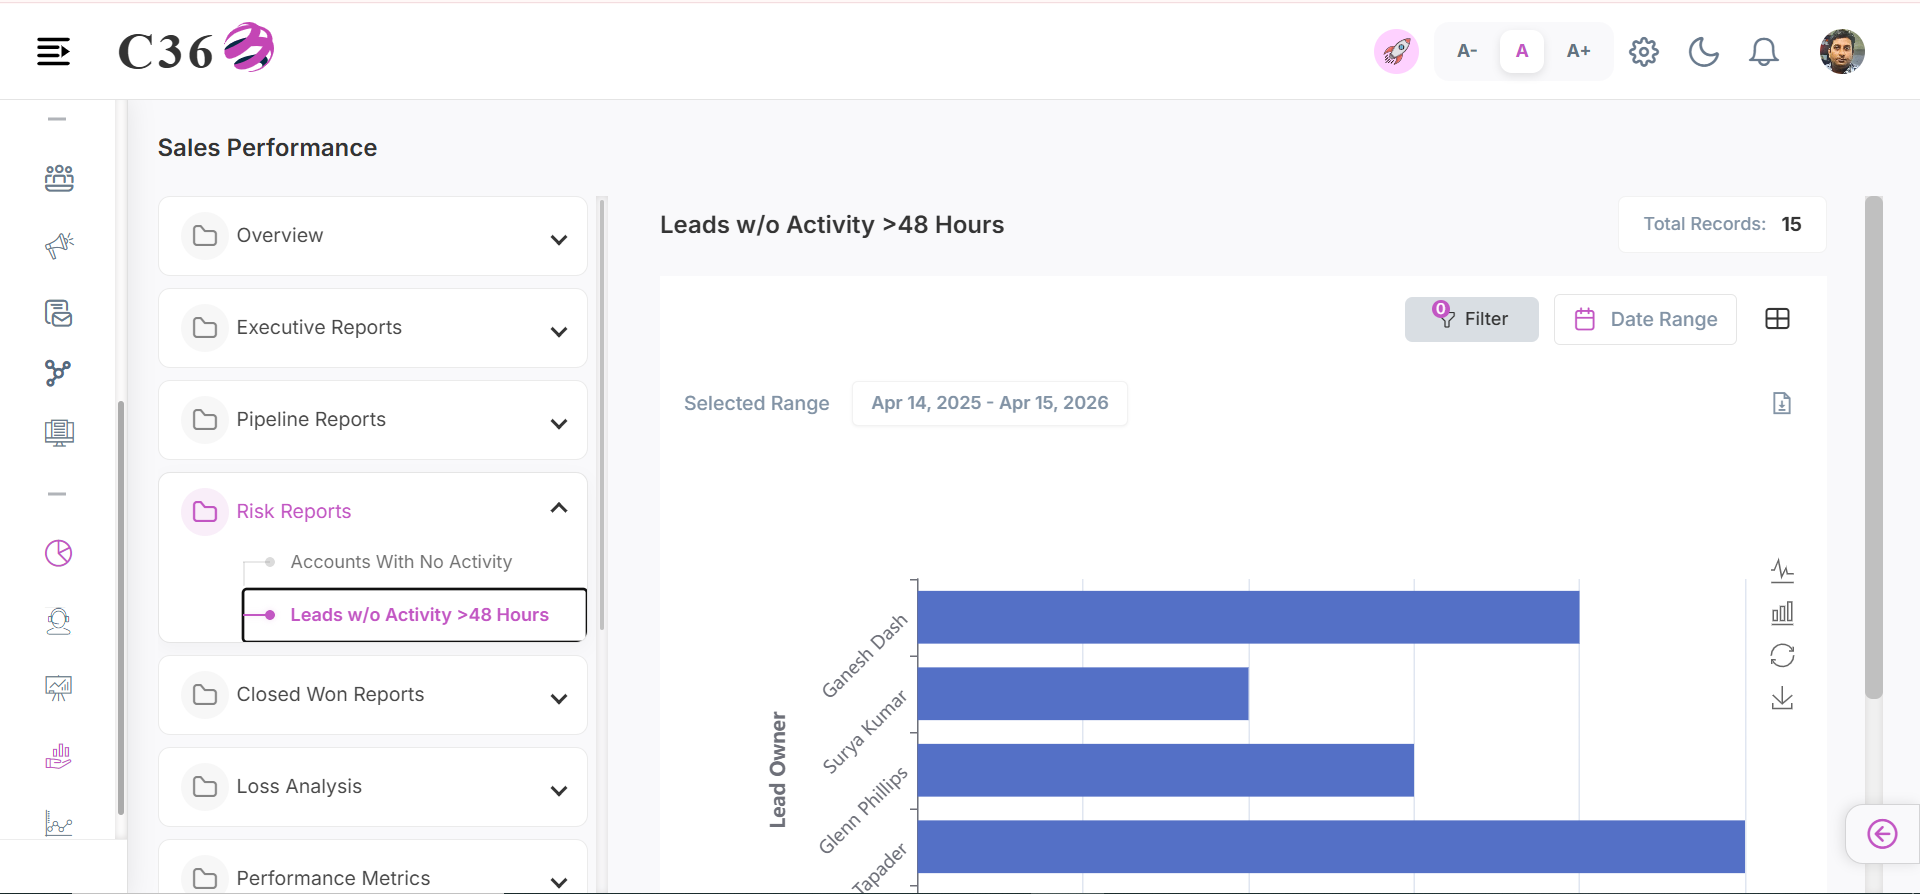
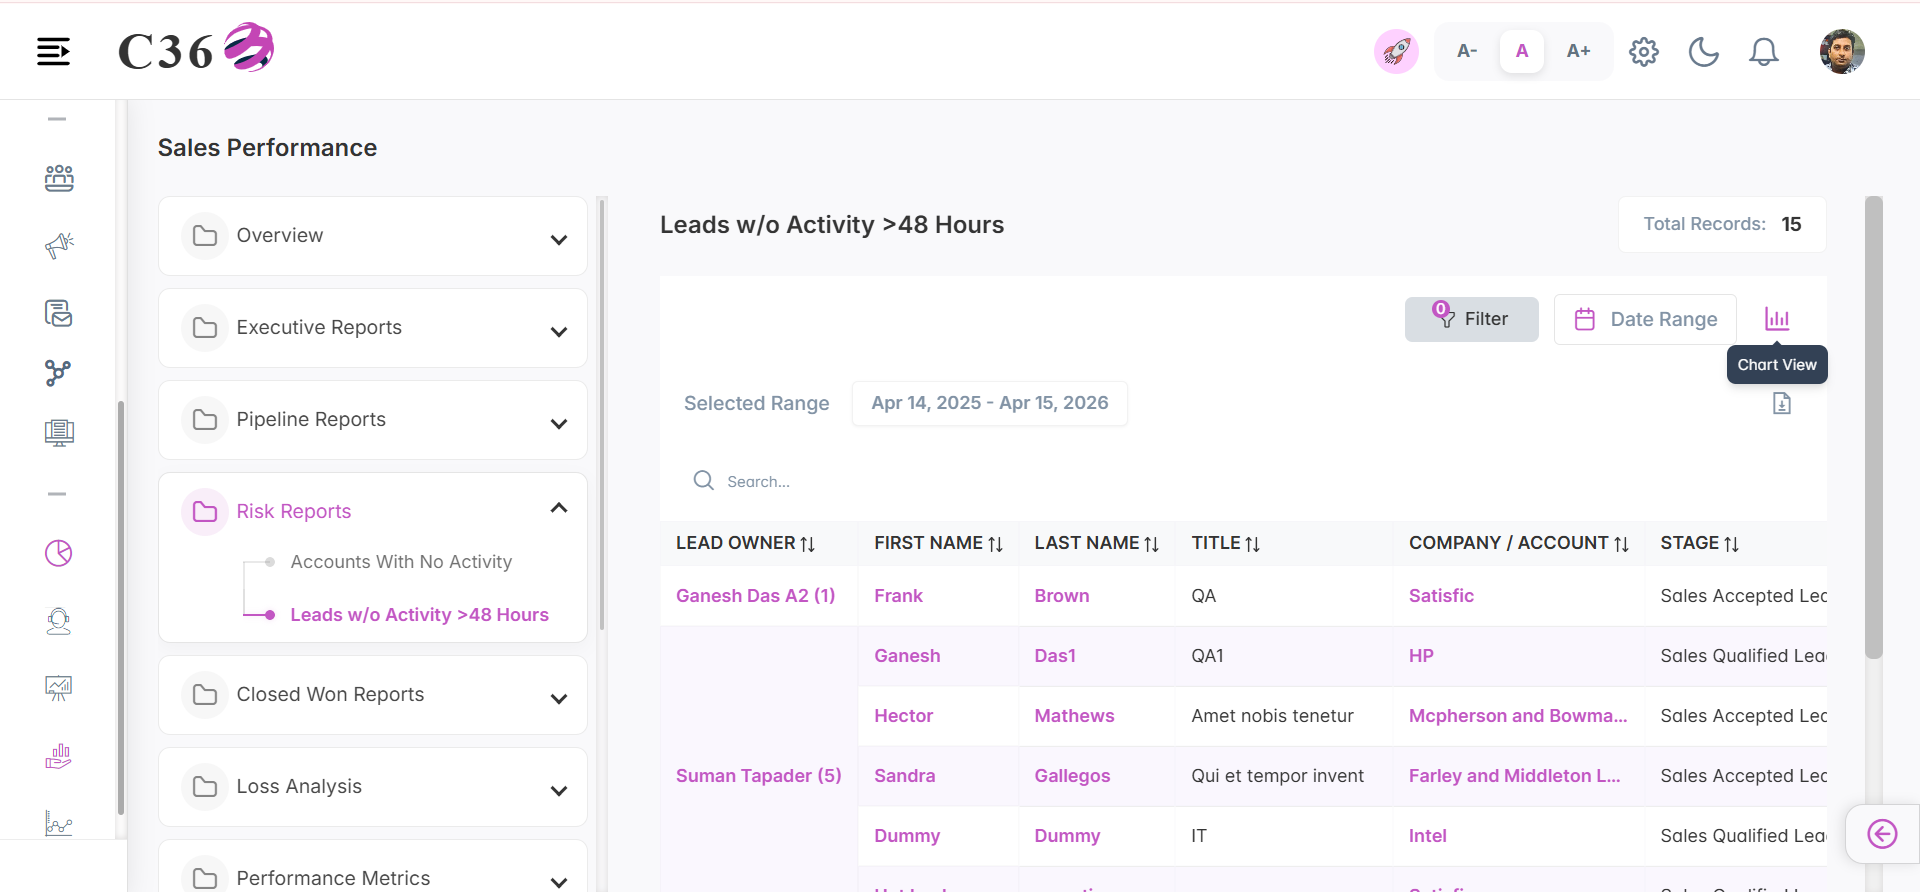
⏰ Leads w/o Activity >48 Hours
Flags active leads that have not received any follow-up or activity in over 48 hours.
- 📊 Chart View
- 📋 Table View
Click to see quick actions
- Can Toggle between Table view and Chart view. - Can Export/Download the report. - Can Filter by Date Range. - Can Filter by Country, Company and Users. - Toggle between Line chart and Bar chart. - Save the Chart as an image. - Can Restore the bar chart.
Click to see quick actions
- Can Toggle between Table view and Chart view. - Can Export/Download the report. - Can Perform the search in the table view. - Can Filter by Date Range. - Can Filter by Country, Company and Users.
🧾 Columns included in the table view
| Field Name | Description |
|---|---|
| Lead Owner | User responsible for managing the lead. |
| First Name | Lead’s given name. |
| Last Name | Lead’s family or surname. |
| Title | Job title or designation of the lead. |
| Company/Account | Organization or business associated with the lead. |
| Stage | Current status of the lead in the lifecycle (e.g., New, Qualified). |
| Street | Street address of the lead. |
| Primary email address for communication with the lead. |
━━━━━━━━━━━━━━━━━━━━━━━━━━━━━━━━━━━━━━━━━━━━━━━━━━━━━━━━━━━━━━━━━━━━━━━━━━━━━━━━━━━━━
🏆 Closed Won Reports
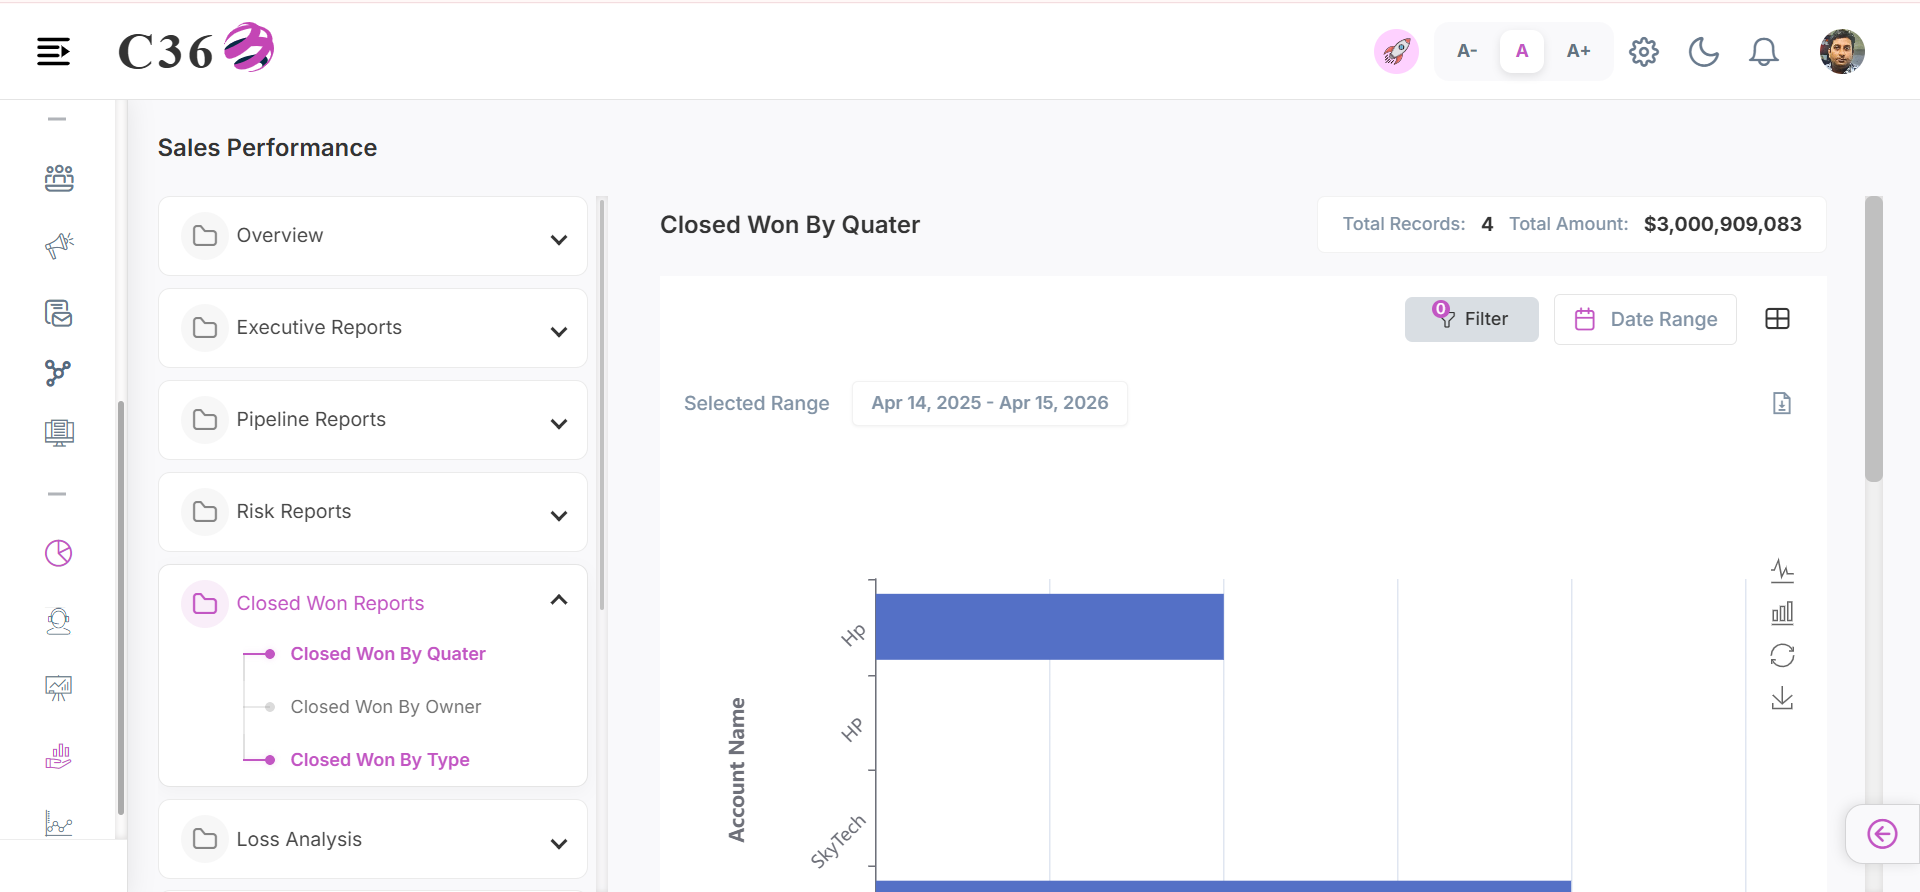
📅 Closed Won By Quarter
Breaks down successful deal conversions on a quarterly basis to track seasonal performance.
- 📊 Chart View
- 📋 Table View
Click to see quick actions
- Can Toggle between Table view and Chart view. - Can Export/Download the report. - Can Filter by Date Range. - Can Filter by Country, Company and Users. - Toggle between Line chart and Bar chart. - Save the Chart as an image. - Can Restore the bar chart.
Click to see quick actions
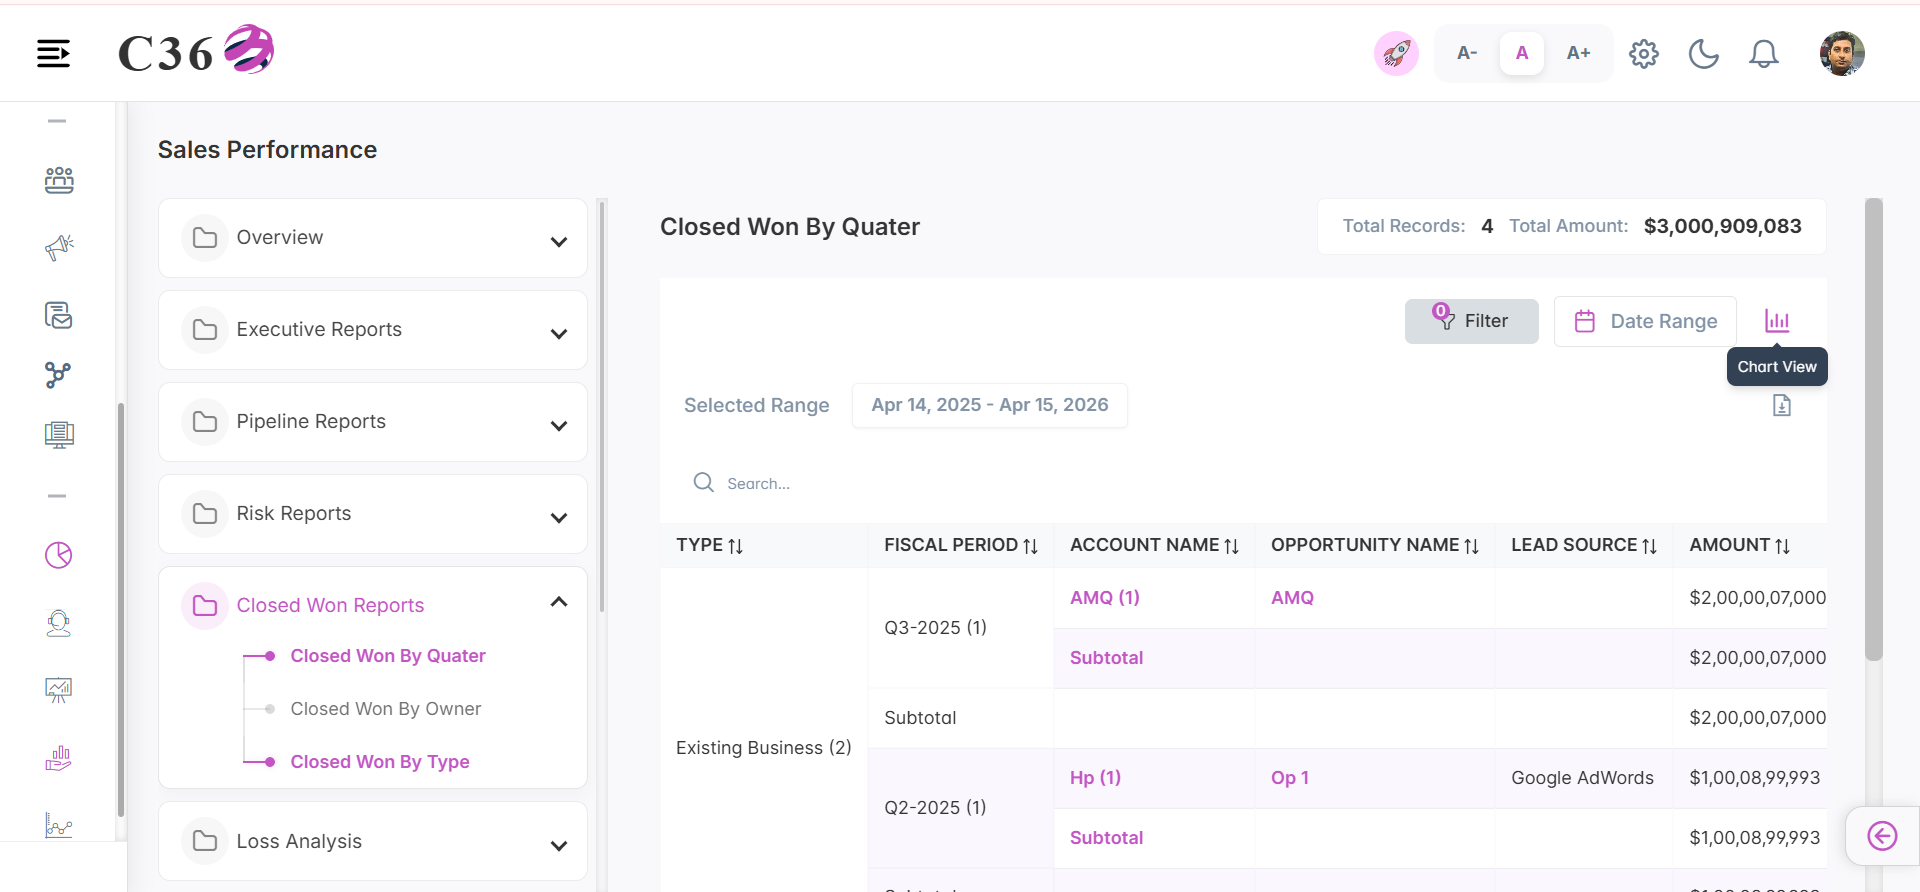
- Can Toggle between Table view and Chart view. - Can Export/Download the report. - Can Perform search in the table view. - Can Filter by Date Range. - Can Filter by Country, Company and Users.
🧾 Columns included in the table view
| Field Name | Description |
|---|---|
| Type | Category of the opportunity (e.g., New Business, Existing Customer). |
| Fiscal Period | Financial period (month/quarter/year) associated with the opportunity. |
| Account Name | Name of the customer or business linked to the opportunity. |
| Opportunity Name | Unique name or title identifying the opportunity. |
| Lead Source | Origin from which the opportunity was generated (e.g., Web, Referral). |
| Amount | Expected revenue value of the opportunity. |
| Close Date | Expected or actual date when the opportunity will be closed. |
| Stage | Current phase of the opportunity in the sales pipeline. |
| Probability | Likelihood (in %) of the opportunity being successfully closed. |
| Age | Number of days since the opportunity was created. |
| Created Date | Date when the opportunity record was created. |
| Opportunity Owner | User responsible for managing and closing the opportunity. |
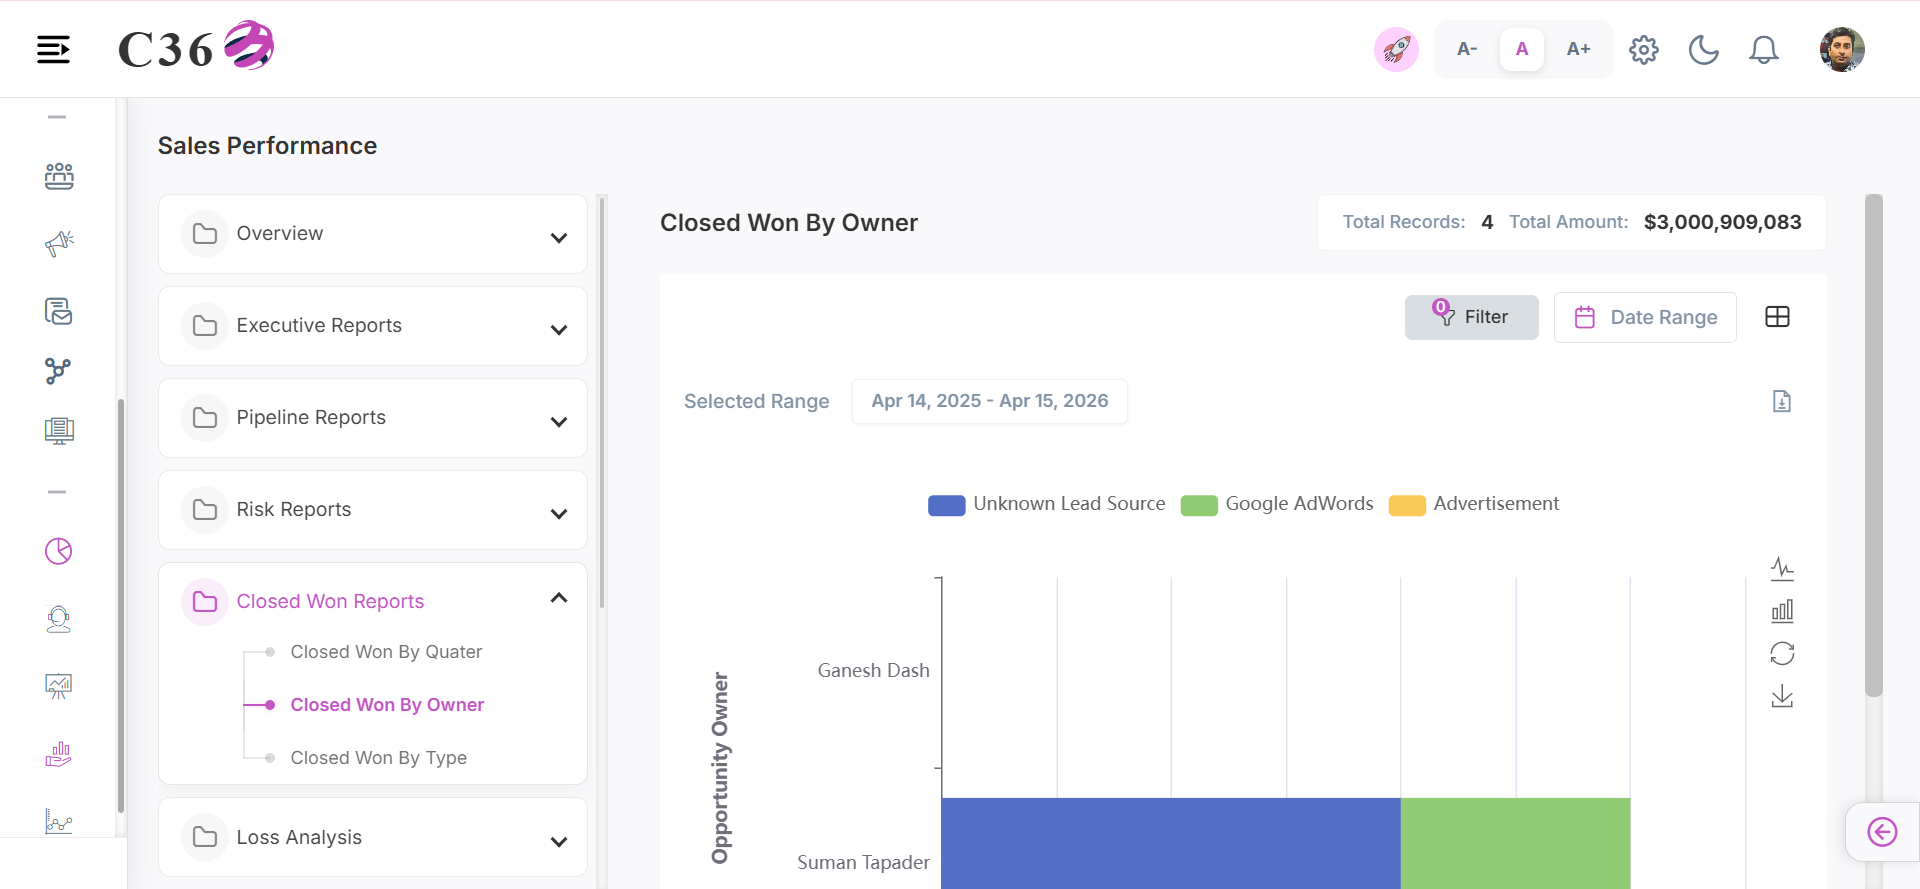
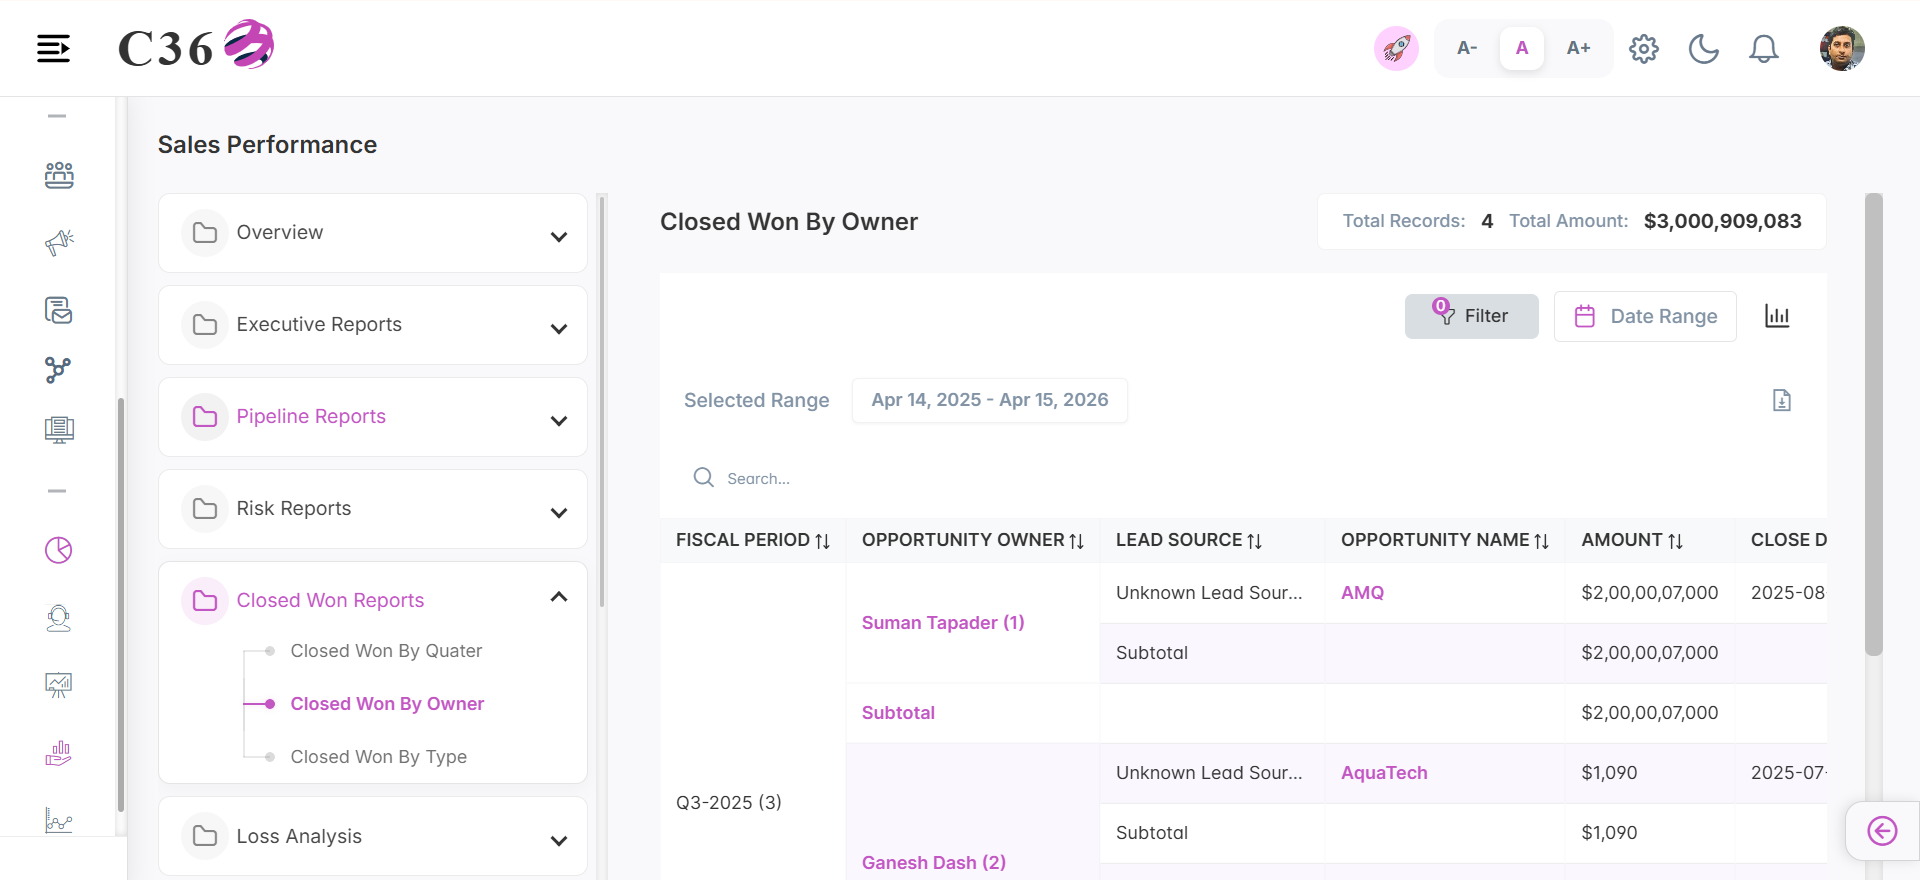
👤 Closed Won By Owner
Details the volume and value of successfully closed deals attributed to each sales representative.
- 📊 Chart View
- 📋 Table View
Click to see quick actions
- Can Toggle between Table view and Chart view. - Can Filter the chart by selecting and unselecting the color buttons. - Can Export/Download the report.
- Can Filter by Date Range. - Can Filter by Country, Company and Users. - Toggle between Line chart and Bar chart. - Save the Chart as an image. - Can Restore the bar chart.
Click to see quick actions
- Can Toggle between Table view and Chart view. - Can Export/Download the report. - Can perform the search in the table view. - Can Filter by Date Range. - Can Filter by Country, Company and Users.
🧾 Columns included in the table view
| Field Name | Description |
|---|---|
| Fiscal Period | Financial period (month/quarter/year) associated with the opportunity. |
| Opportunity Owner | User responsible for managing and closing the opportunity. |
| Lead Source | Origin from which the opportunity was generated (e.g., Web, Referral). |
| Opportunity Name | Unique name or title identifying the opportunity. |
| Amount | Expected revenue value of the opportunity. |
| Closed Date | Actual date when the opportunity was successfully closed. |
| Stage | Current phase of the opportunity in the sales pipeline. |
| Probability | Likelihood (in %) of the opportunity being successfully closed. |
| Age | Number of days since the opportunity was created. |
| Created Date | Date when the opportunity record was created. |
| Account Name | Name of the customer or business linked to the opportunity. |
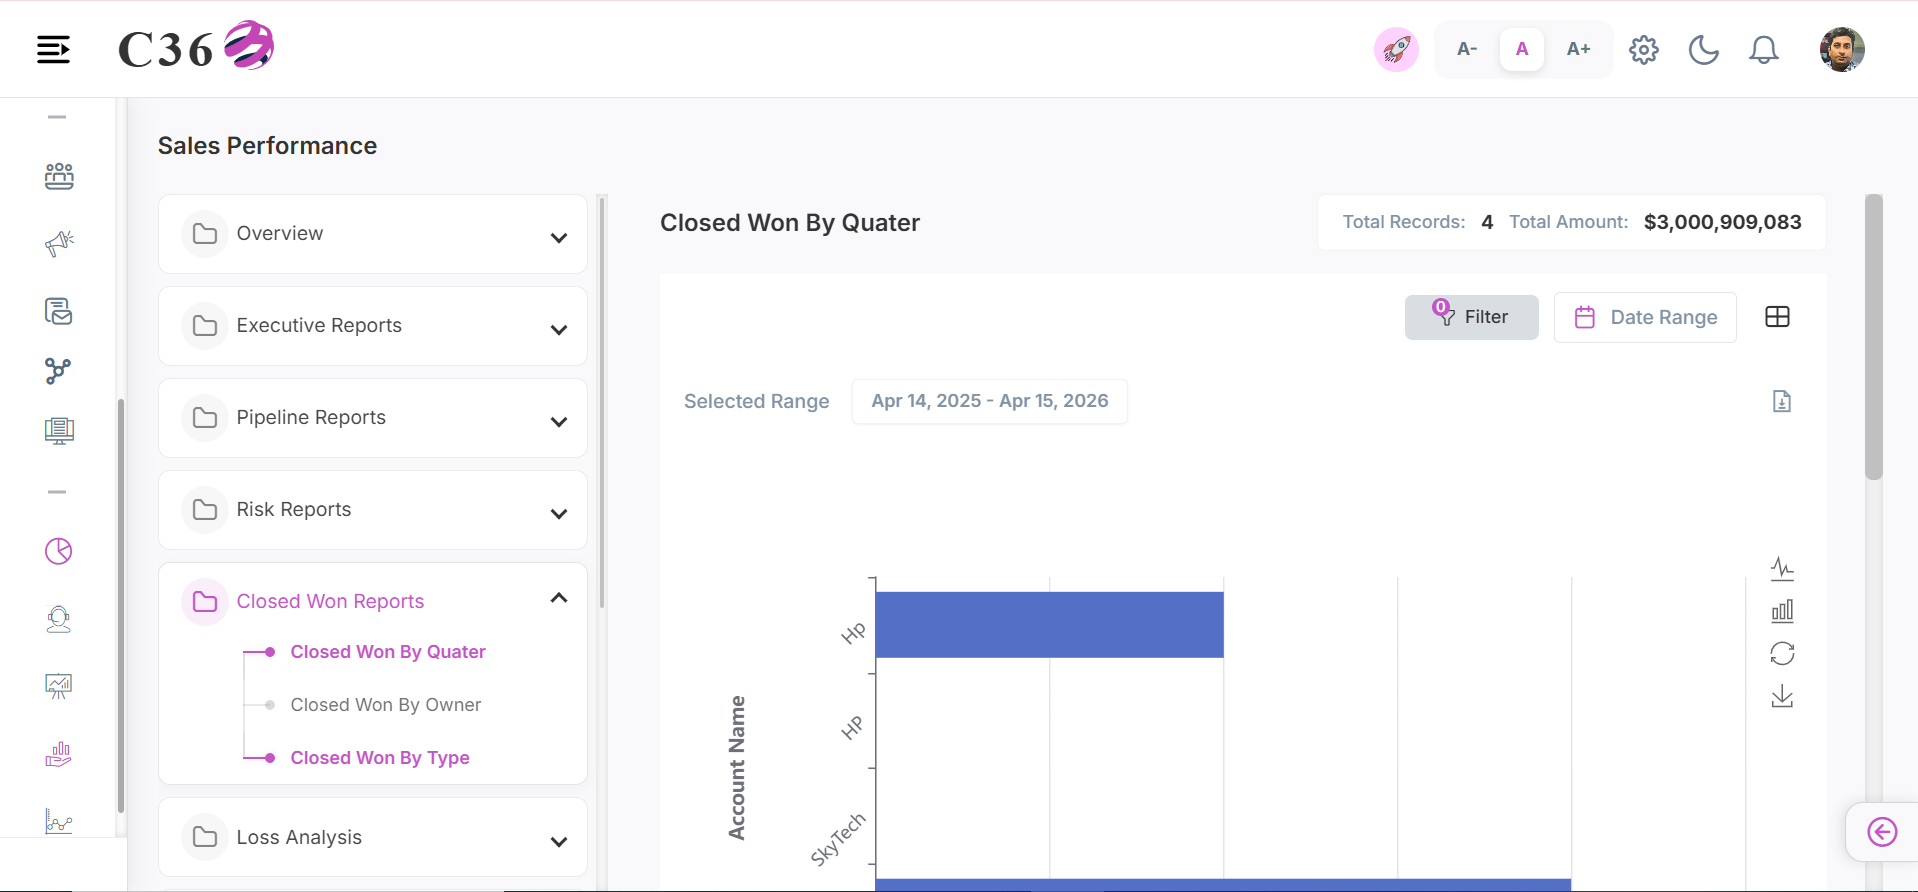
🏷️ Closed Won By Type
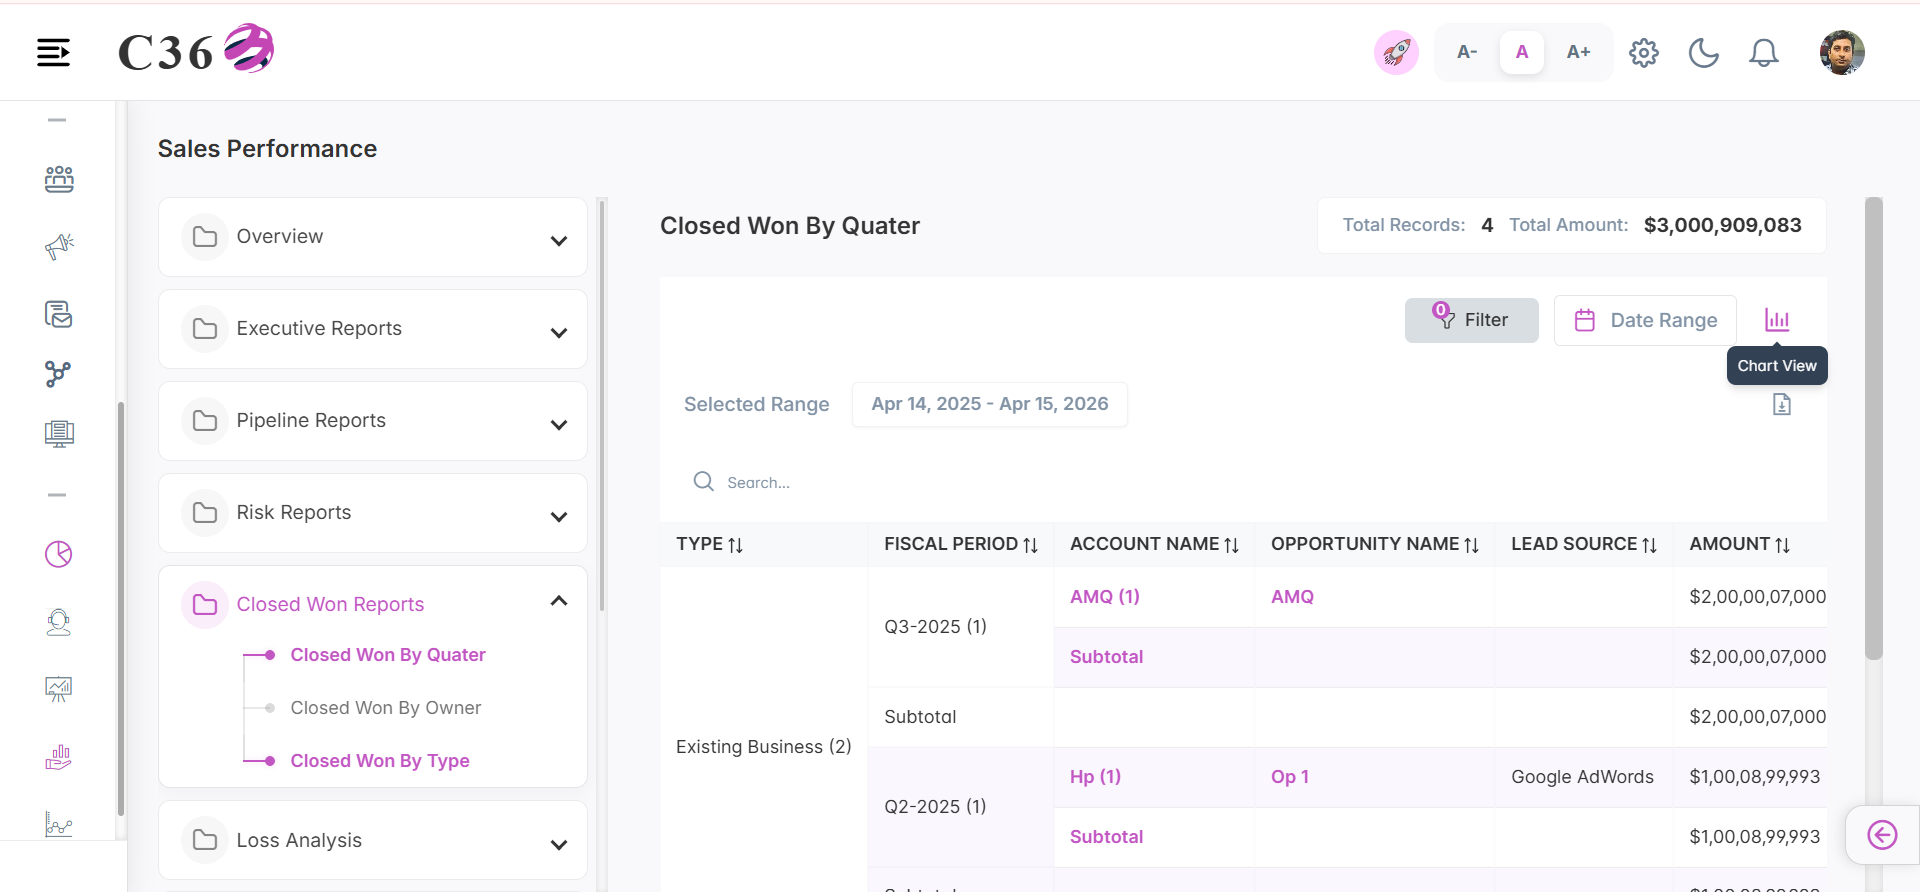
Categorizes finalized sales by opportunity or customer type to identify key revenue drivers.
- 📊 Chart View
- 📋 Table View
Click to see quick actions
- Can Toggle between Table view and Chart view. - Can Export/Download the report. - Can Filter by Date Range. - Can Filter by Country, Company and Users. - Toggle between Line chart and Bar chart. - Save the Chart as an image. - Can Restore the bar chart.
Click to see quick actions
- Can Toggle between Table view and Chart view. - Can Export/Download the report. - Can perform the search in the table view. - Can Filter by Date Range. - Can Filter by Country, Company and Users.
🧾 Columns included in the table view
| Field Name | Description |
|---|---|
| Type | Category of the opportunity (e.g., New Business, Existing Customer). |
| Fiscal Period | Financial period (month/quarter/year) associated with the opportunity. |
| Account Name | Name of the customer or business linked to the opportunity. |
| Opportunity Name | Unique name or title identifying the opportunity. |
| Lead Source | Origin from which the opportunity was generated (e.g., Web, Referral). |
| Amount | Expected revenue value of the opportunity. |
| Close Date | Expected or actual date when the opportunity will be closed. |
| Stage | Current phase of the opportunity in the sales pipeline. |
| Probability | Likelihood (in %) of the opportunity being successfully closed. |
| Age | Number of days since the opportunity was created. |
| Created Date | Date when the opportunity record was created. |
| Opportunity Owner | User responsible for managing and closing the opportunity. |
━━━━━━━━━━━━━━━━━━━━━━━━━━━━━━━━━━━━━━━━━━━━━━━━━━━━━━━━━━━━━━━━━━━━━━━━━━━━━━━━━━━━━
❌ Loss Analysis
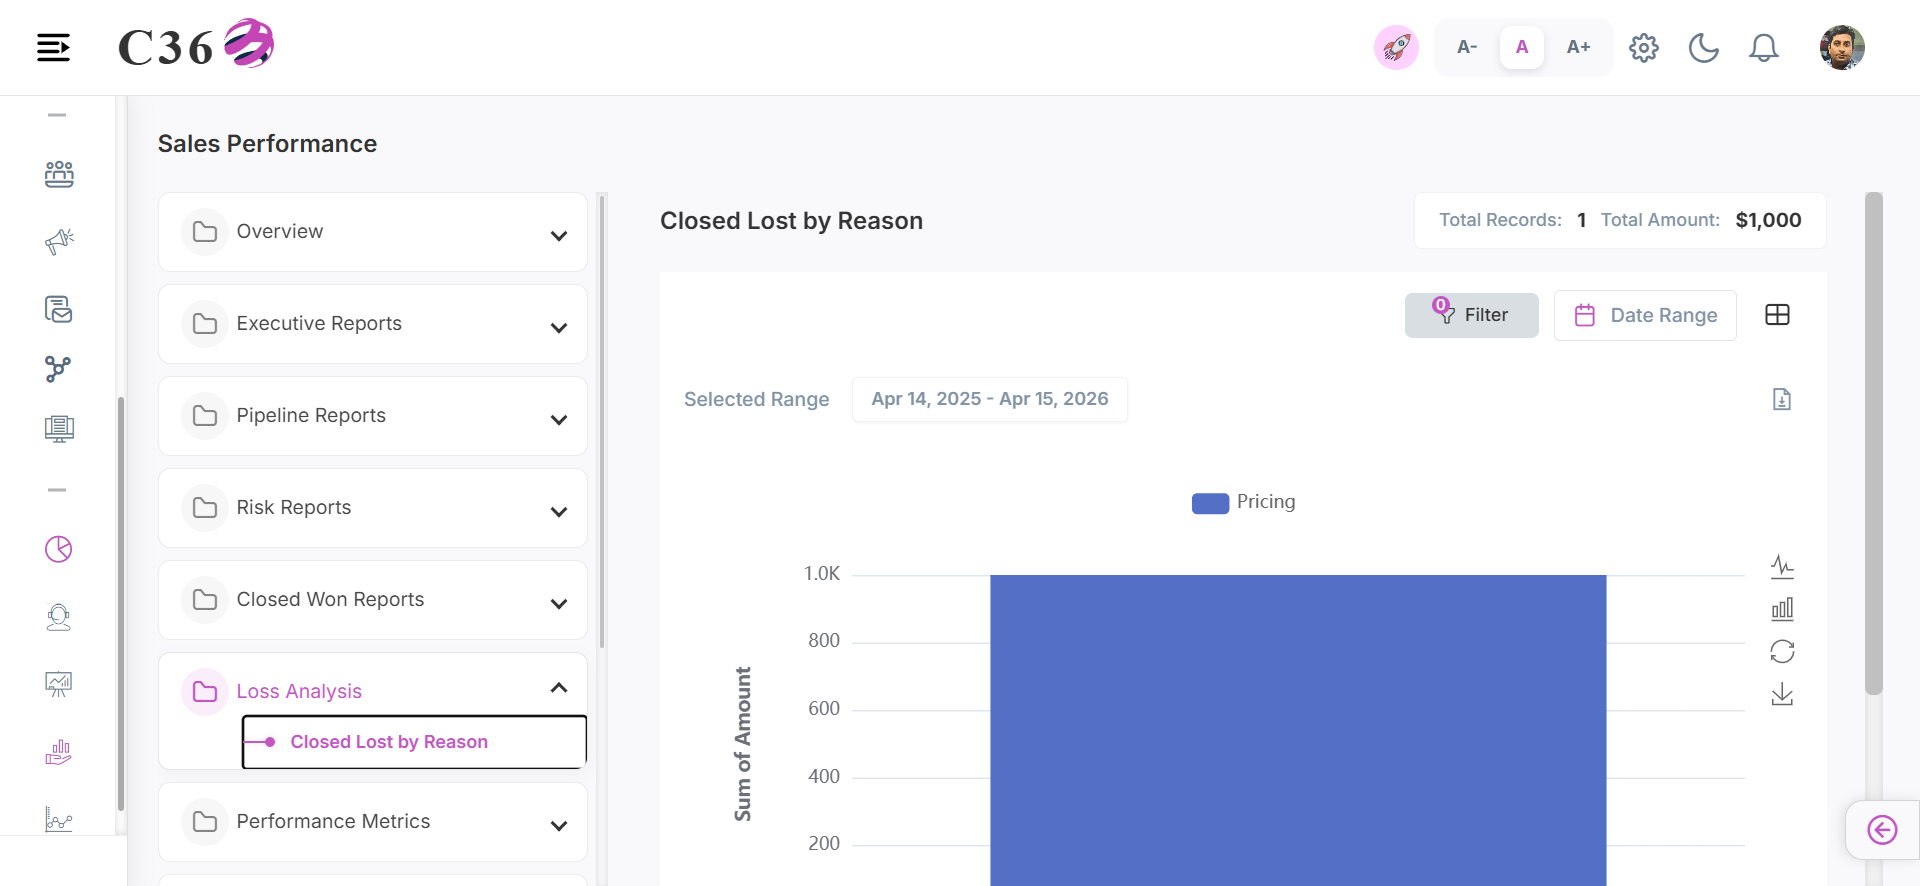
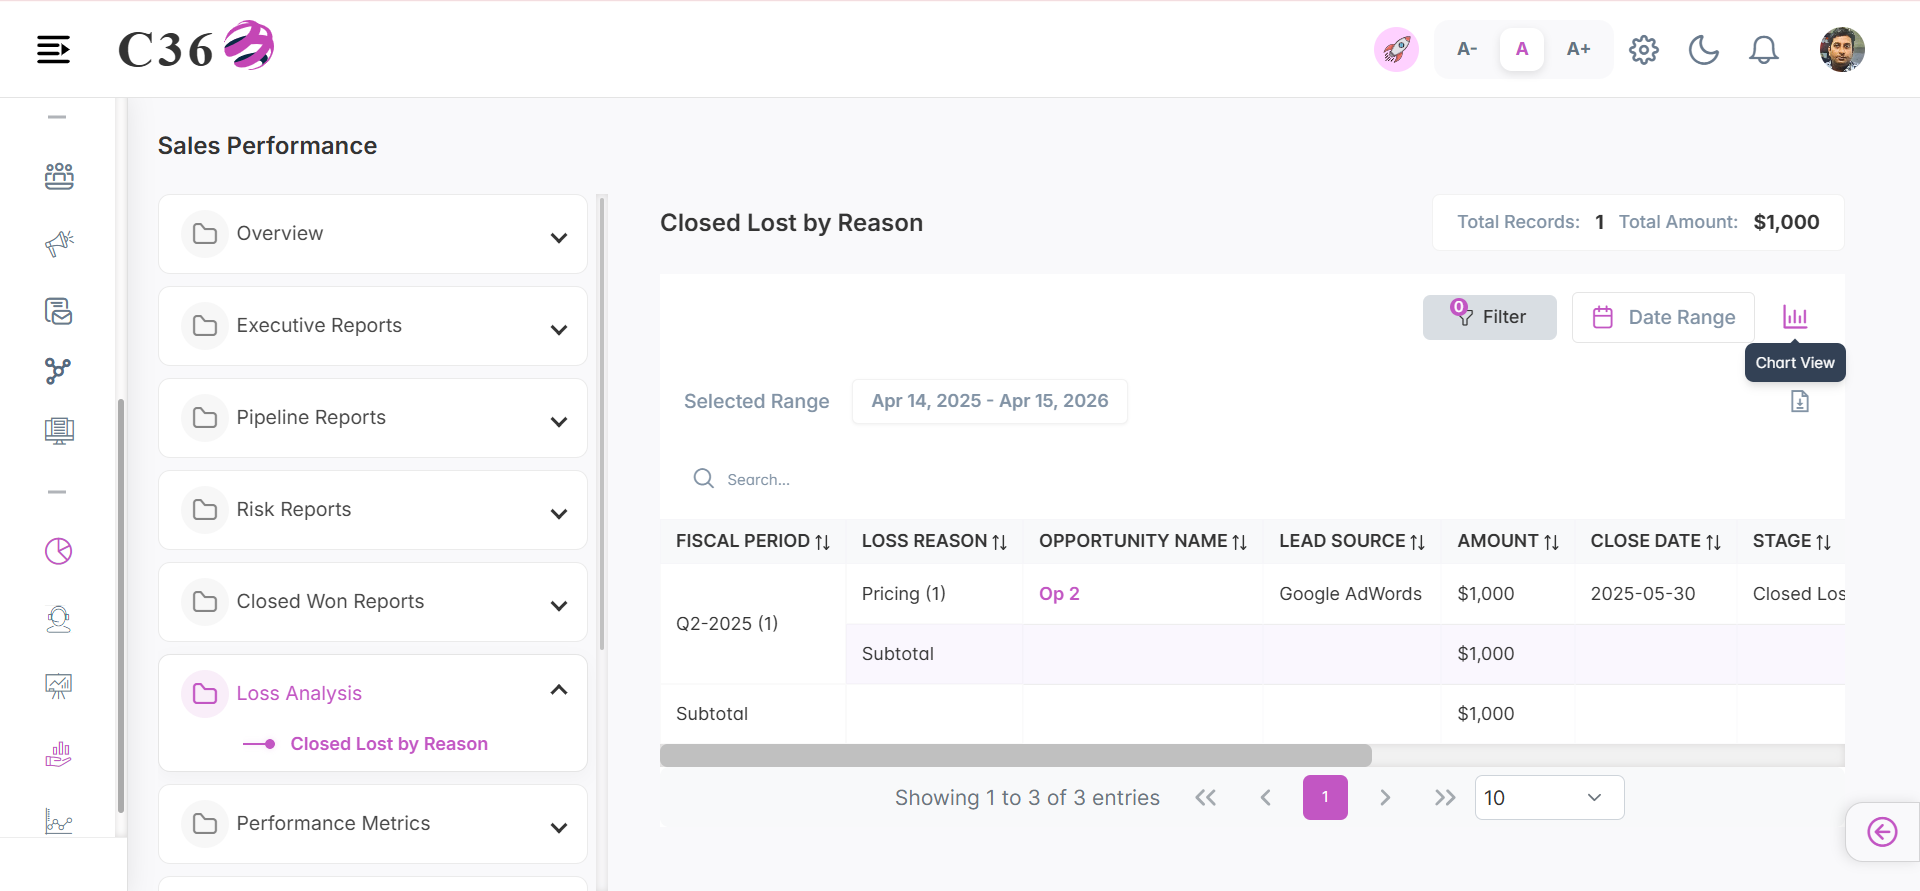
🔍 Closed Lost By Reason
Details the primary factors contributing to lost deals to inform training and product adjustments.
- 📊 Chart View
- 📋 Table View
Click to see quick actions
- Can Toggle between Table view and Chart view. - Can Filter the chart by selecting and unselecting the color buttons. - Can Export/Download the report.
- Can Filter by Date Range. - Can Filter by Country, Company and Users. - Toggle between Line chart and Bar chart. - Save the Chart as an image. - Can Restore the bar chart.
Click to see quick actions
- Can Toggle between Table view and Chart view. - Can Export/Download the report. - Can perform the search in the table view. - Can Filter by Date Range. - Can Filter by Country, Company and Users.
🧾 Columns included in the table view
| Field Name | Description |
|---|---|
| Fiscal Period | Financial period (month/quarter/year) associated with the opportunity. |
| Closed Reason | Reason why the opportunity was closed (won or lost). |
| Opportunity Name | Unique name or title identifying the opportunity. |
| Lead Source | Origin from which the opportunity was generated (e.g., Web, Referral). |
| Amount | Expected or actual revenue value of the opportunity. |
| Close Date | Expected or actual date when the opportunity will be closed. |
| Stage | Current phase of the opportunity in the sales pipeline. |
| Probability | Likelihood (in %) of the opportunity being successfully closed. |
| Age | Number of days since the opportunity was created. |
| Created Date | Date when the opportunity record was created. |
| Opportunity Owner | User responsible for managing and closing the opportunity. |
━━━━━━━━━━━━━━━━━━━━━━━━━━━━━━━━━━━━━━━━━━━━━━━━━━━━━━━━━━━━━━━━━━━━━━━━━━━━━━━━━━━━━
⏱️ Performance Metrics
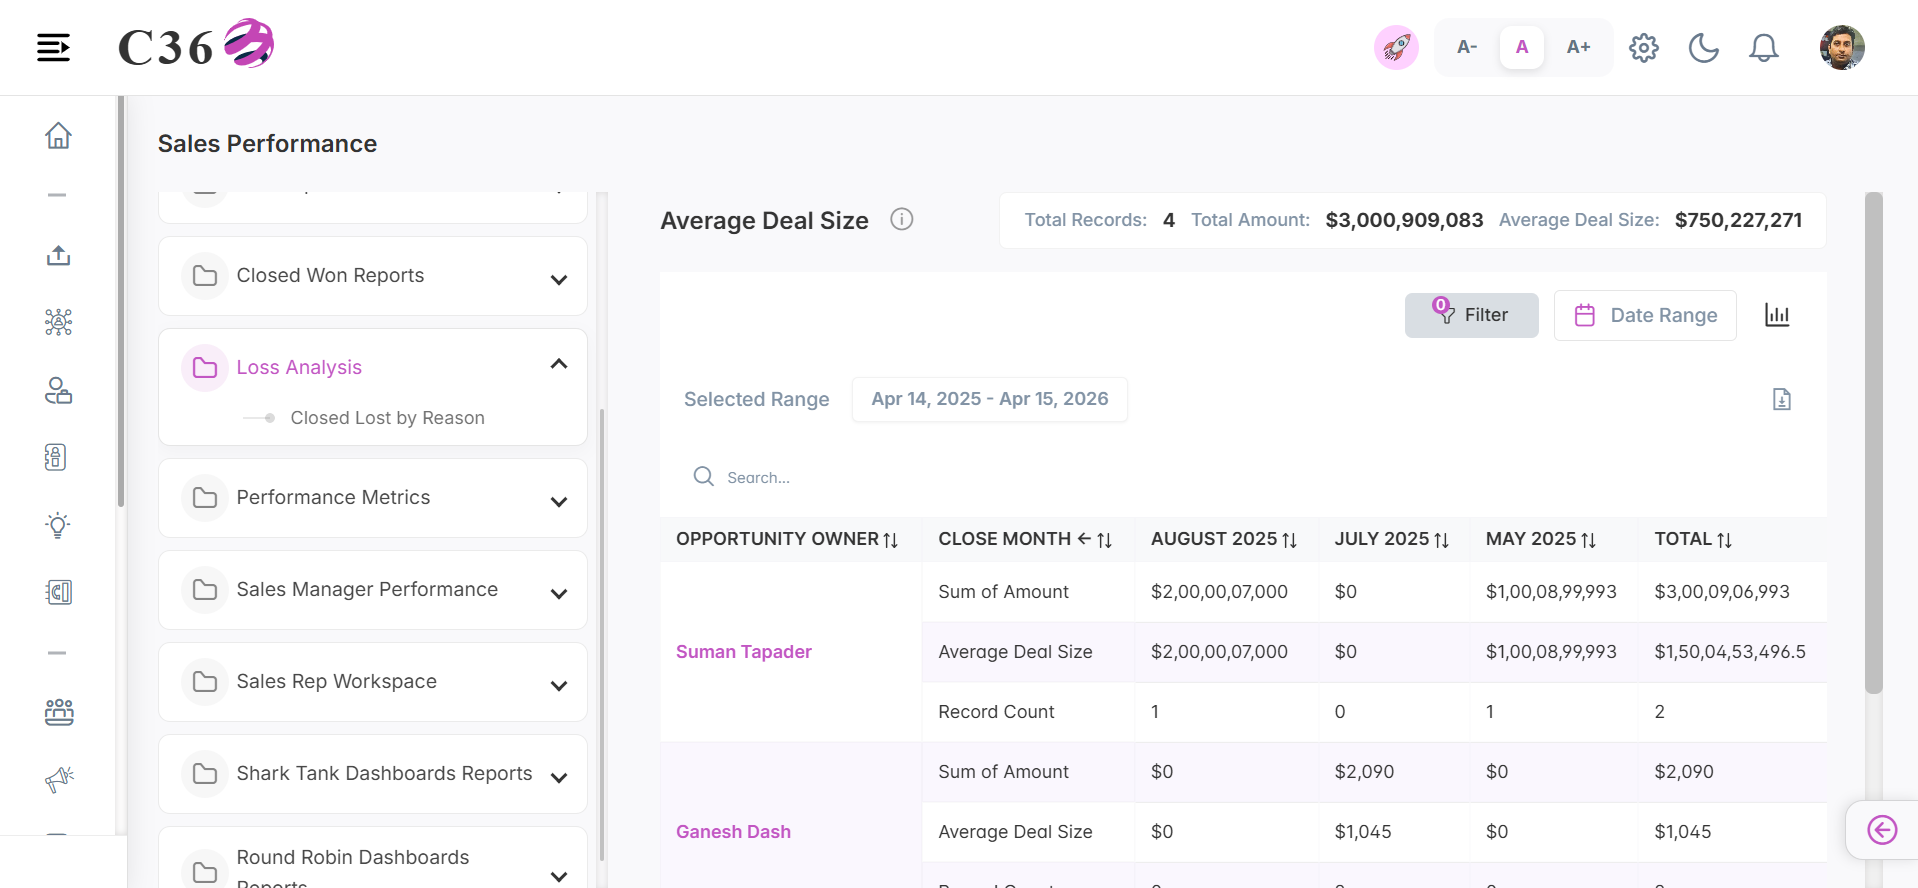
📏 Average Deal Size
Measures the standard value of closed deals to establish benchmarks for revenue expectations.
- 📊 Chart View
- 📋 Table View
Click to see quick actions
- Can Toggle between Table view and Chart view. - Can Export/Download the report. - Can Filter by Date Range. - Can Filter by Country, Company and Users. - Toggle between Line chart and Bar chart. - Save the Chart as an image. - Can Restore the bar chart.
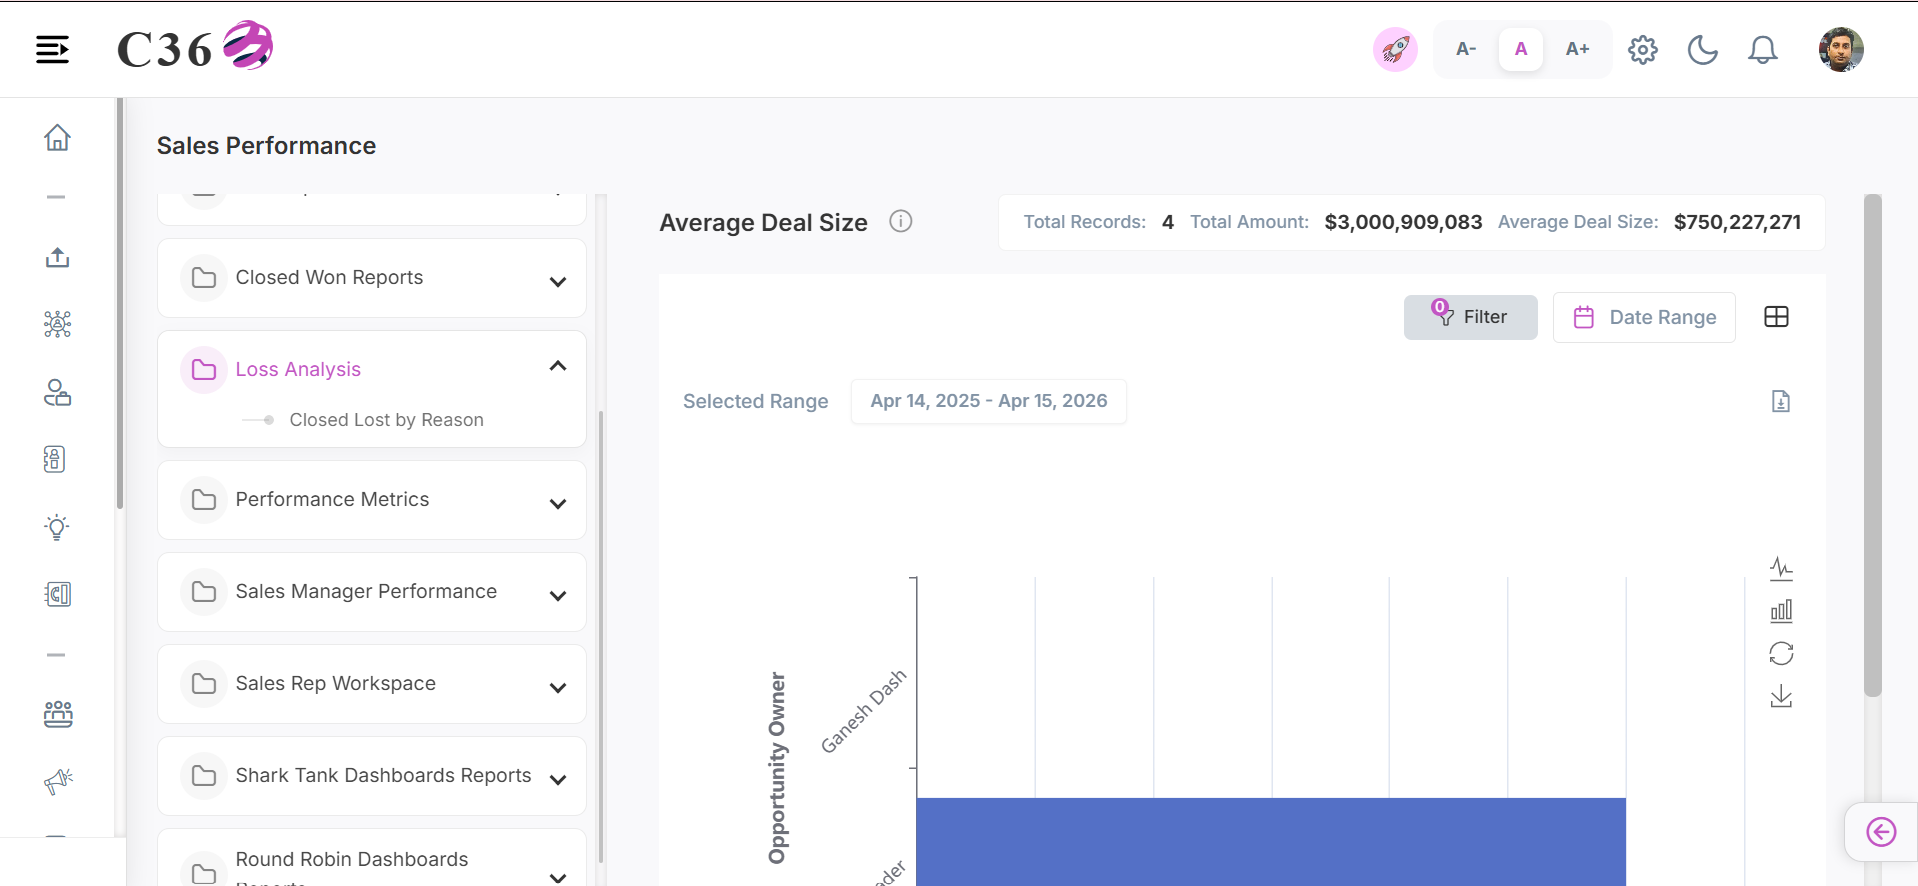
Click to see quick actions
- Can Toggle between Table view and Chart view. - Can Export/Download the report. - Can perform search in the table view. - Can Filter by Date Range. - Can Filter by Country, Company and Users.
🧾 Columns included in the table view
| Field Name | Description |
|---|---|
| Opportunity Owner | User responsible for managing and closing the opportunity. |
| Close Month | Month in which the opportunity is expected to close. |
| January 2026 | Represents opportunities scheduled to close in January 2026. |
| Total | Total value or count of opportunities for the selected month. |
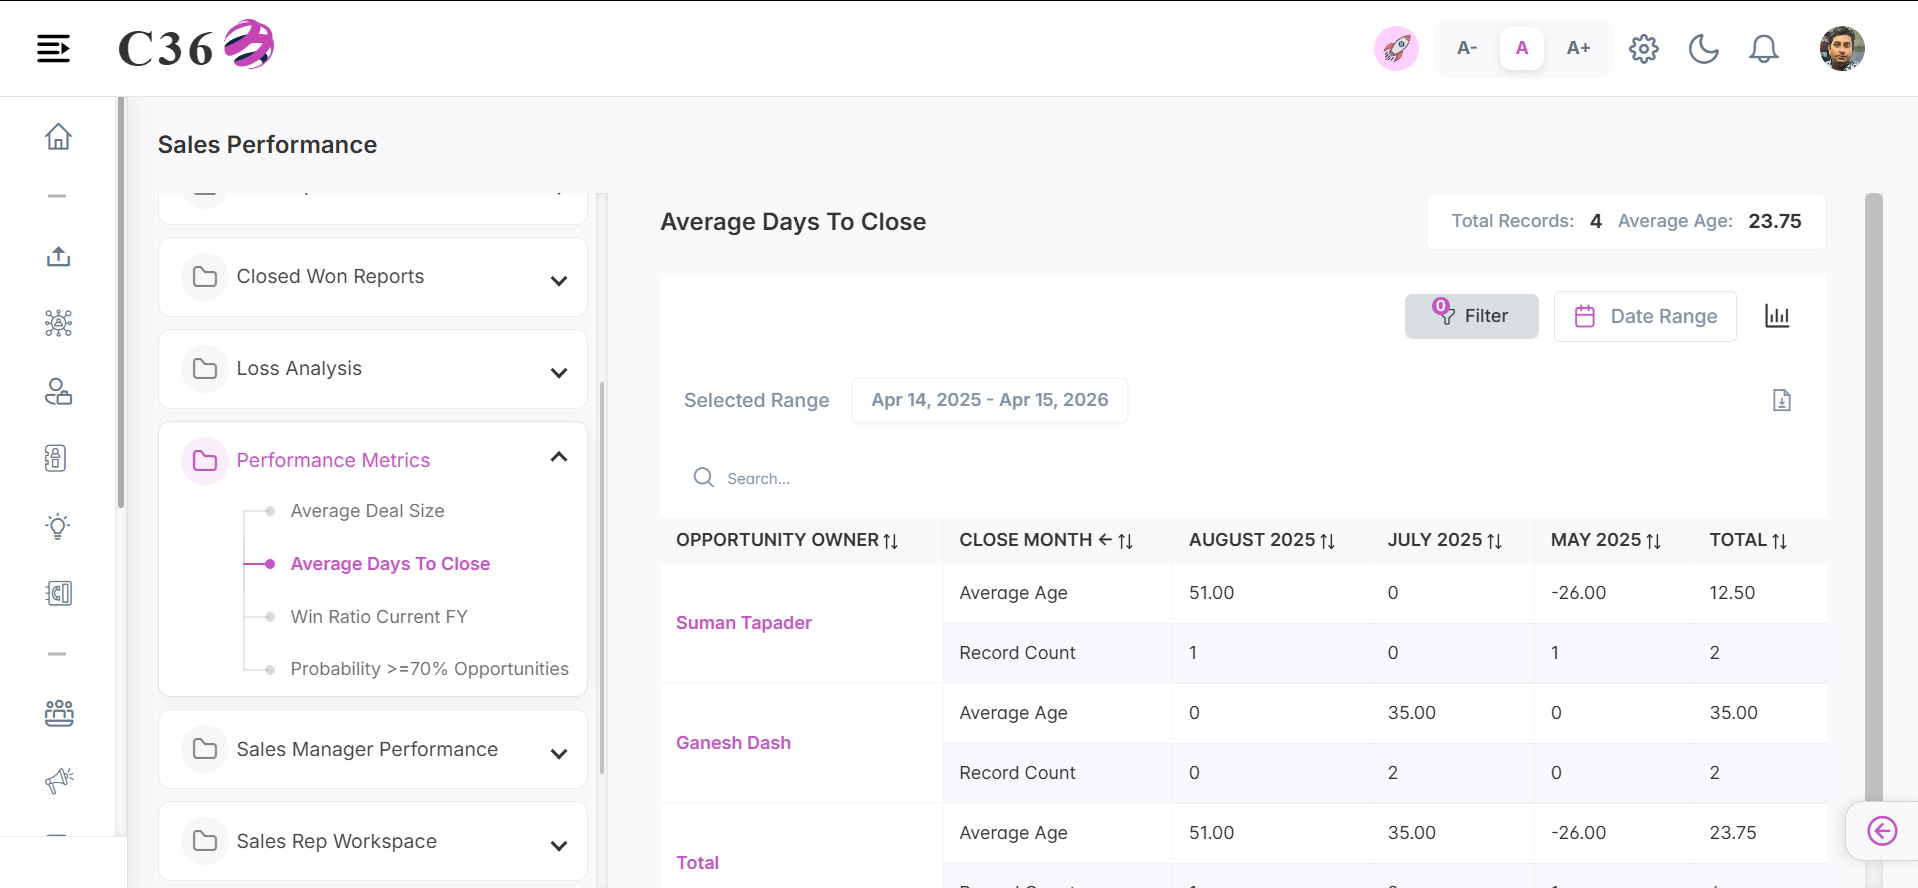
🗓️ Average Days To Close
Calculates the typical time required to convert an opportunity from creation to a successful close.
- 📊 Chart View
- 📋 Table View
Click to see quick actions
- Can Toggle between Table view and Chart view. - Can Export/Download the report. - Can Filter by Date Range. - Can Filter by Country, Company and Users. - Toggle between Line chart and Bar chart. - Save the Chart as an image. - Can Restore the bar chart.
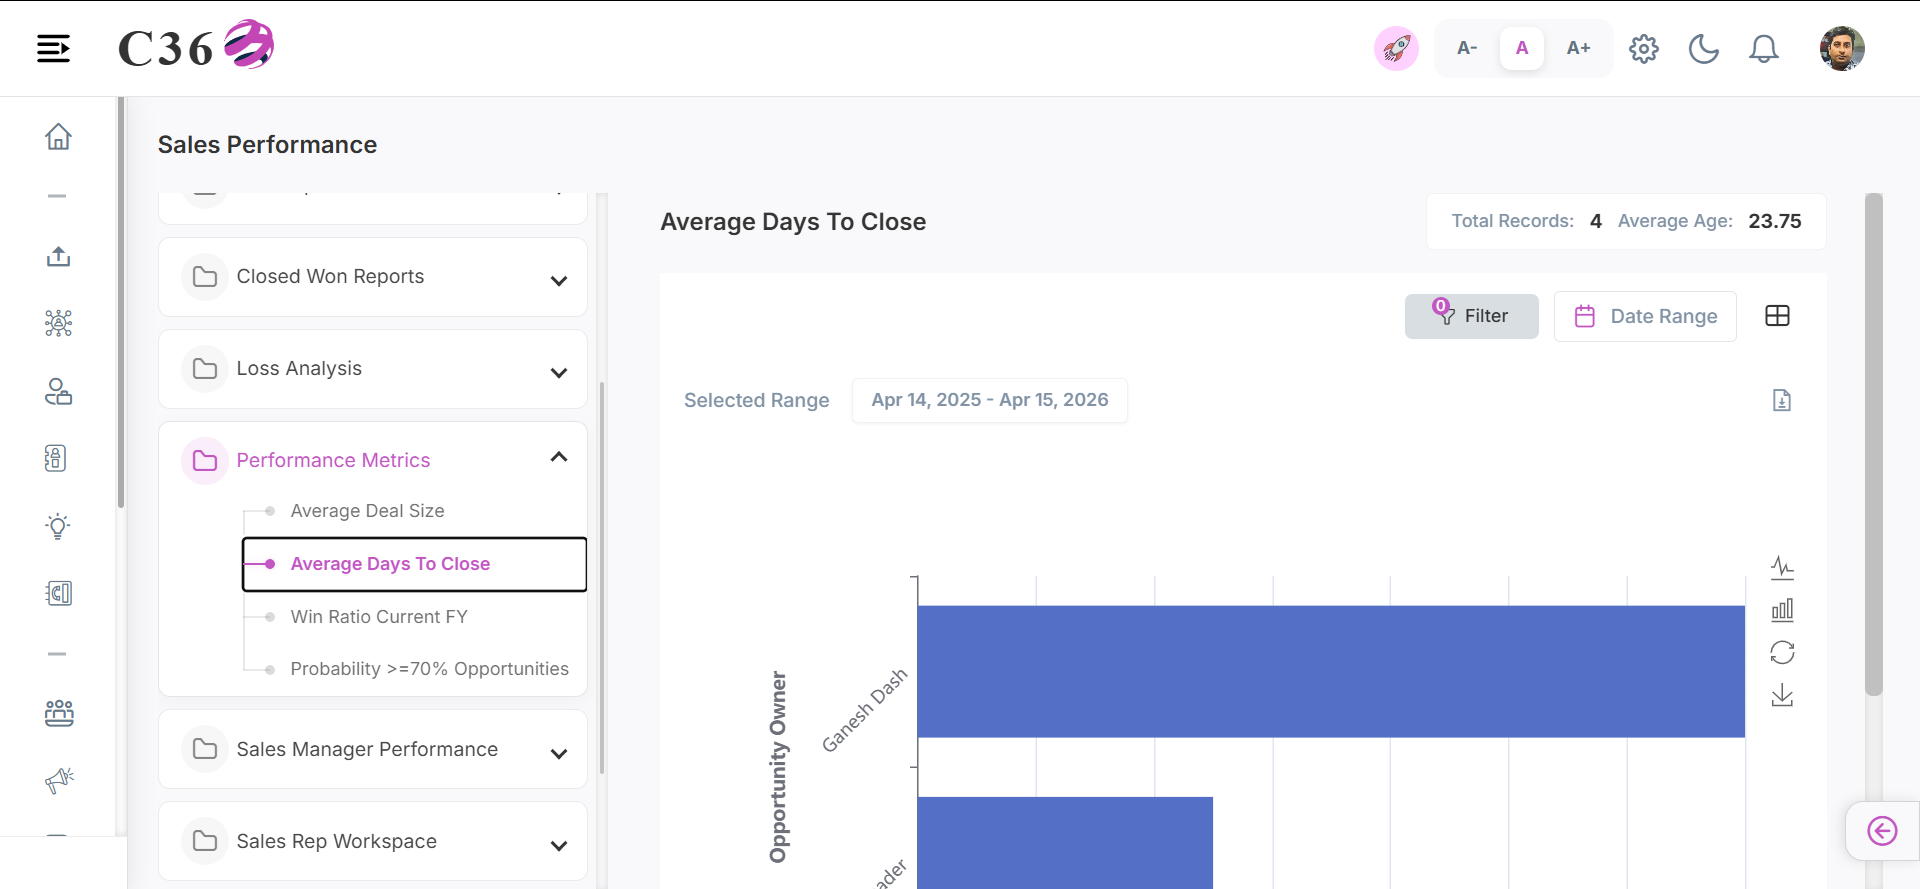
Click to see quick actions
- Can Toggle between Table view and Chart view. - Can Export/Download the report. - Can perform the search in the table view. - Can Filter by Date Range. - Can Filter by Country, Company and Users.
🧾 Columns included in the table view
| Field Name | Description |
|---|---|
| Opportunity Owner | User responsible for managing and closing the opportunity. |
| Close Month | Month in which the opportunity is expected to close. |
| January 2026 | Represents opportunities scheduled to close in January 2026. |
| Total | Total value or count of opportunities for the selected month. |
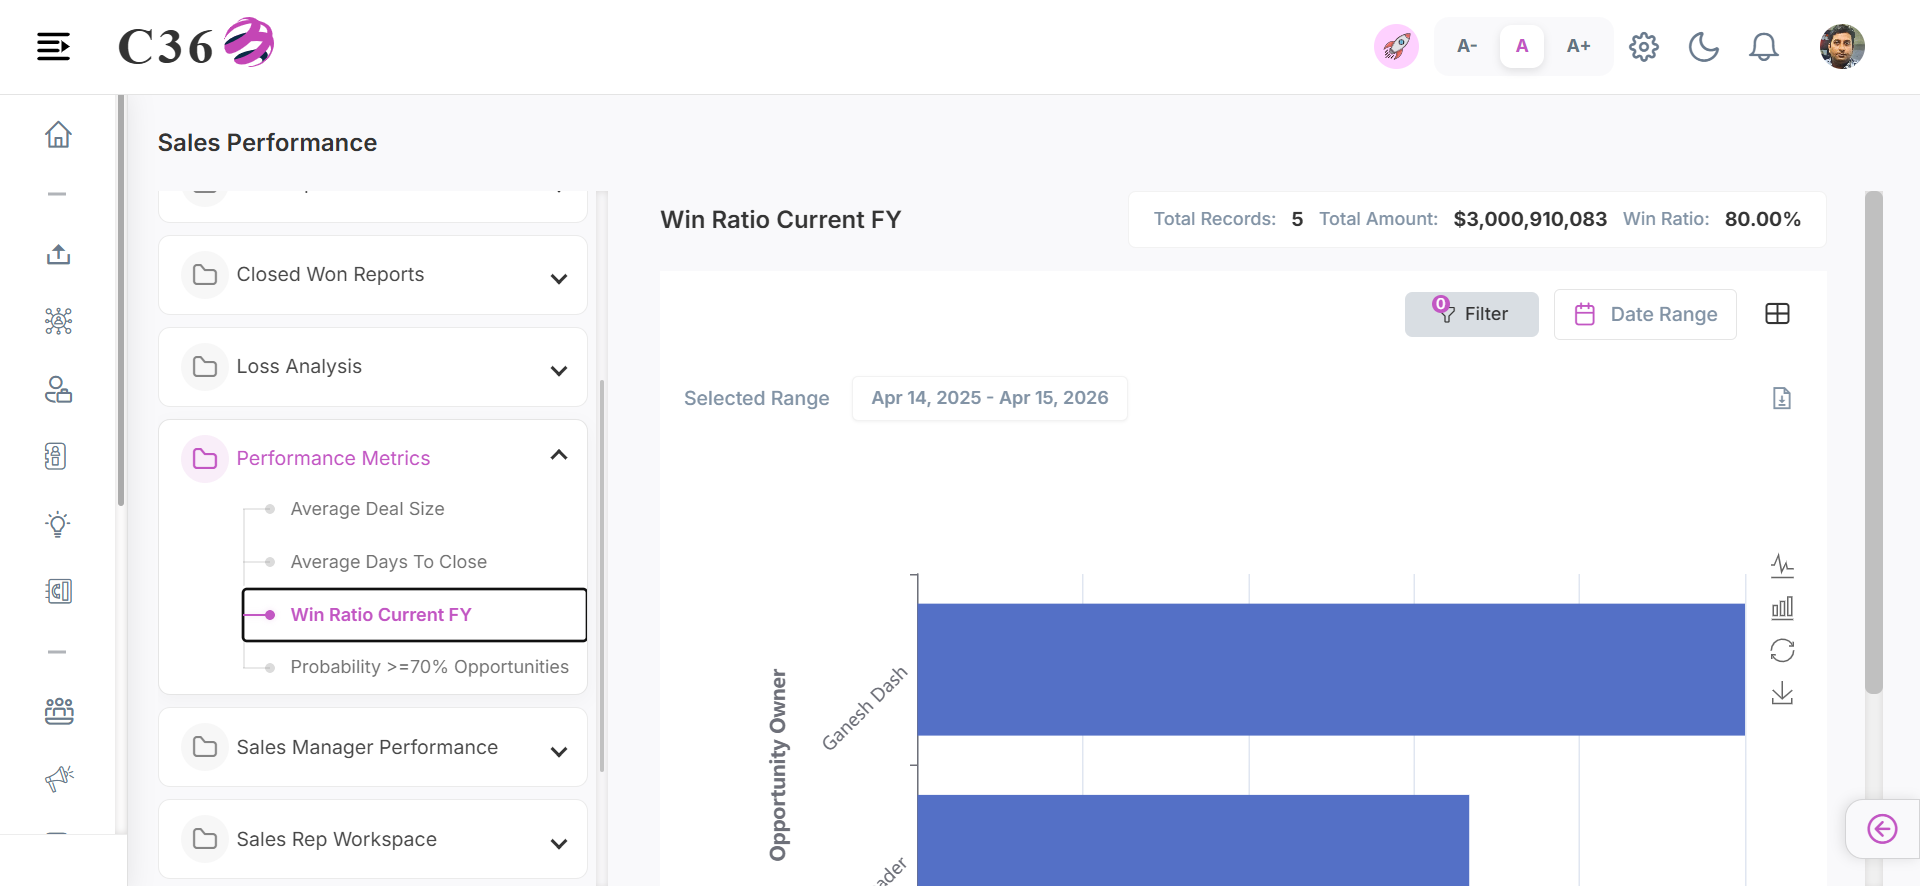
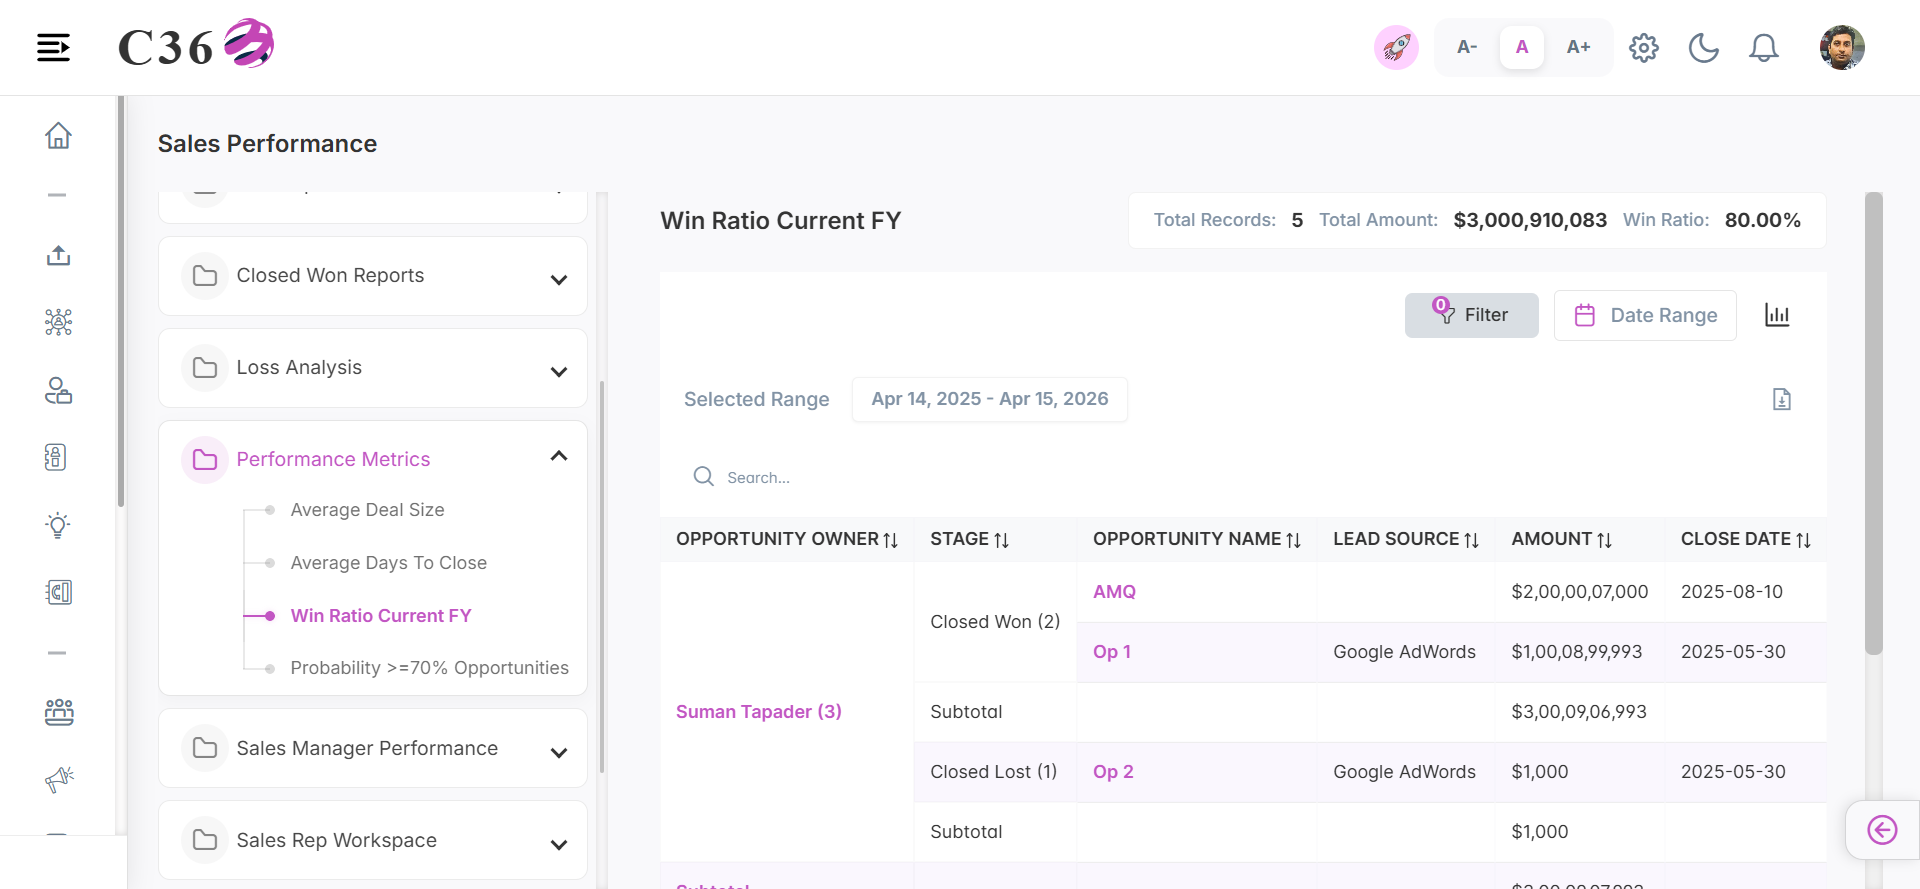
🏅 Win Ratio Current FY
Showcases the overall win rate for the current financial year to evaluate annualized performance.
- 📊 Chart View
- 📋 Table View
Click to see quick actions
- Can Toggle between Table view and Chart view. - Can Export/Download the report. - Can Filter by Date Range. - Can Filter by Country, Company and Users. - Toggle between Line chart and Bar chart. - Save the Chart as an image. - Can Restore the bar chart.
Click to see quick actions
- Can Toggle between Table view and Chart view. - Can Export/Download the report. - Can perform the search in the table view. - Can Filter by Date Range. - Can Filter by Country, Company and Users.
🧾 Columns included in the table view
| Field Name | Description |
|---|---|
| Opportunity Owner | User responsible for managing and closing the opportunity. |
| Stage | Current phase of the opportunity in the sales pipeline. |
| Opportunity Name | Unique name or title identifying the opportunity. |
| Lead Source | Origin from which the opportunity was generated (e.g., Web, Referral). |
| Amount | Expected or actual revenue value of the opportunity. |
| Closed Date | Actual date when the opportunity was closed. |
| Probability | Likelihood (in %) of the opportunity being successfully closed. |
| Age | Number of days since the opportunity was created. |
| Created Date | Date when the opportunity record was created. |
| Win Ratio | Percentage of won opportunities compared to total opportunities. |
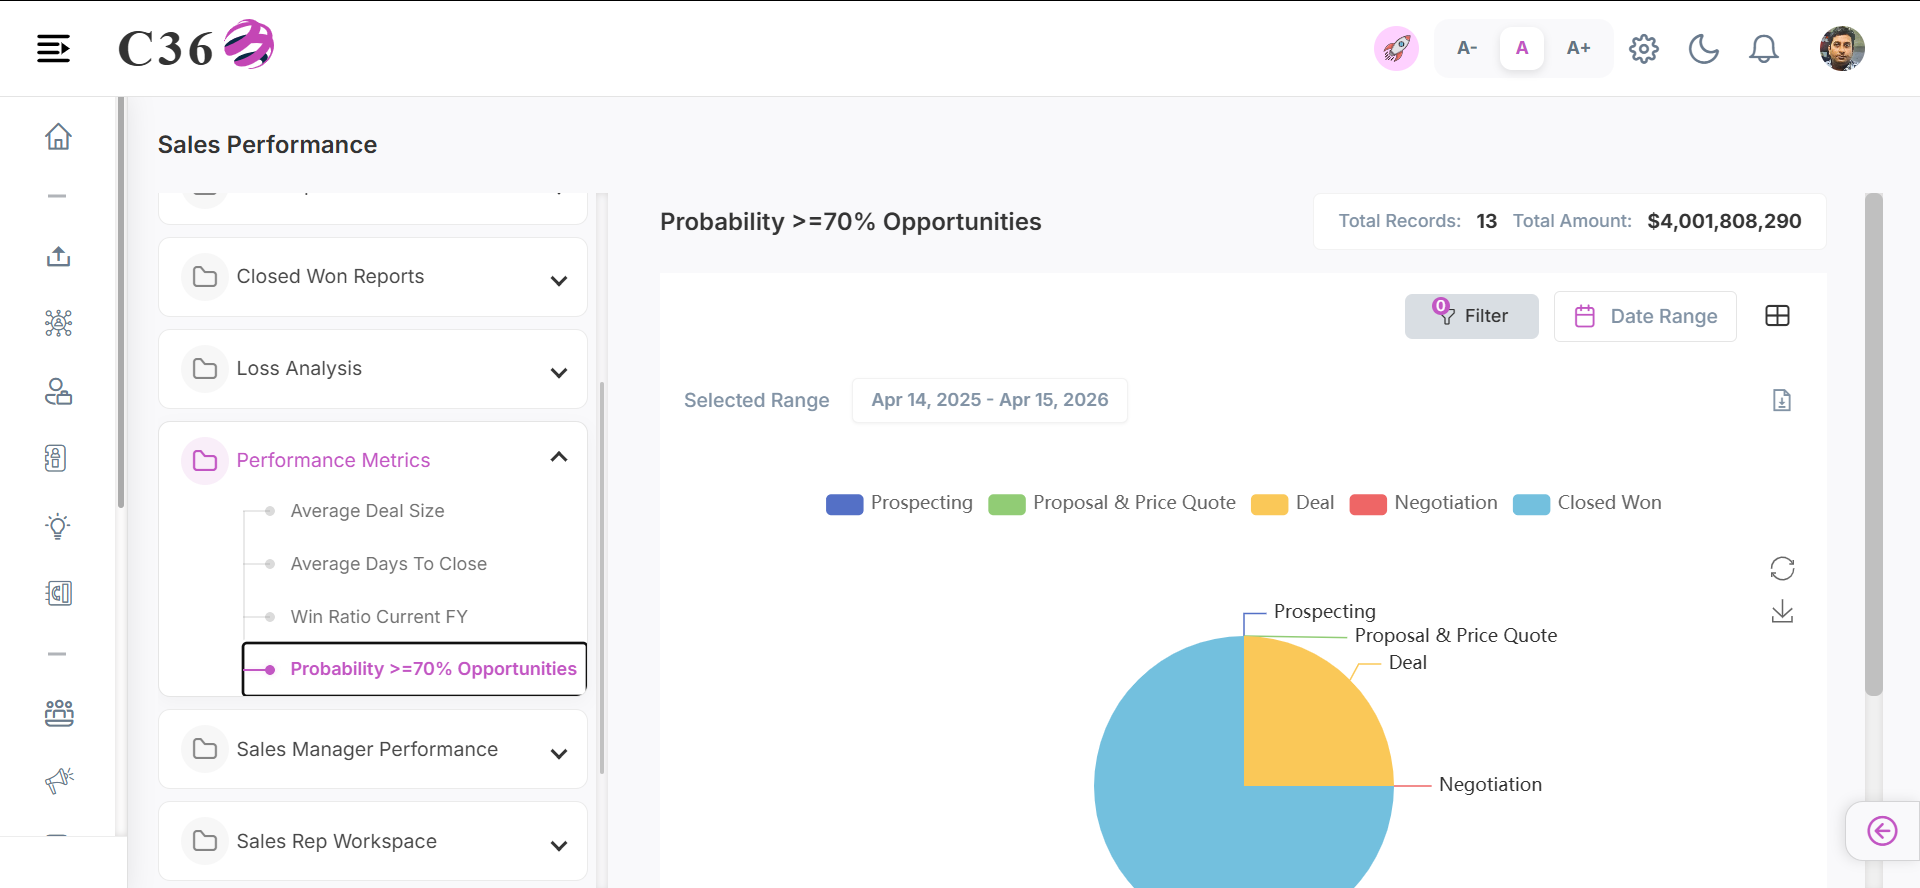
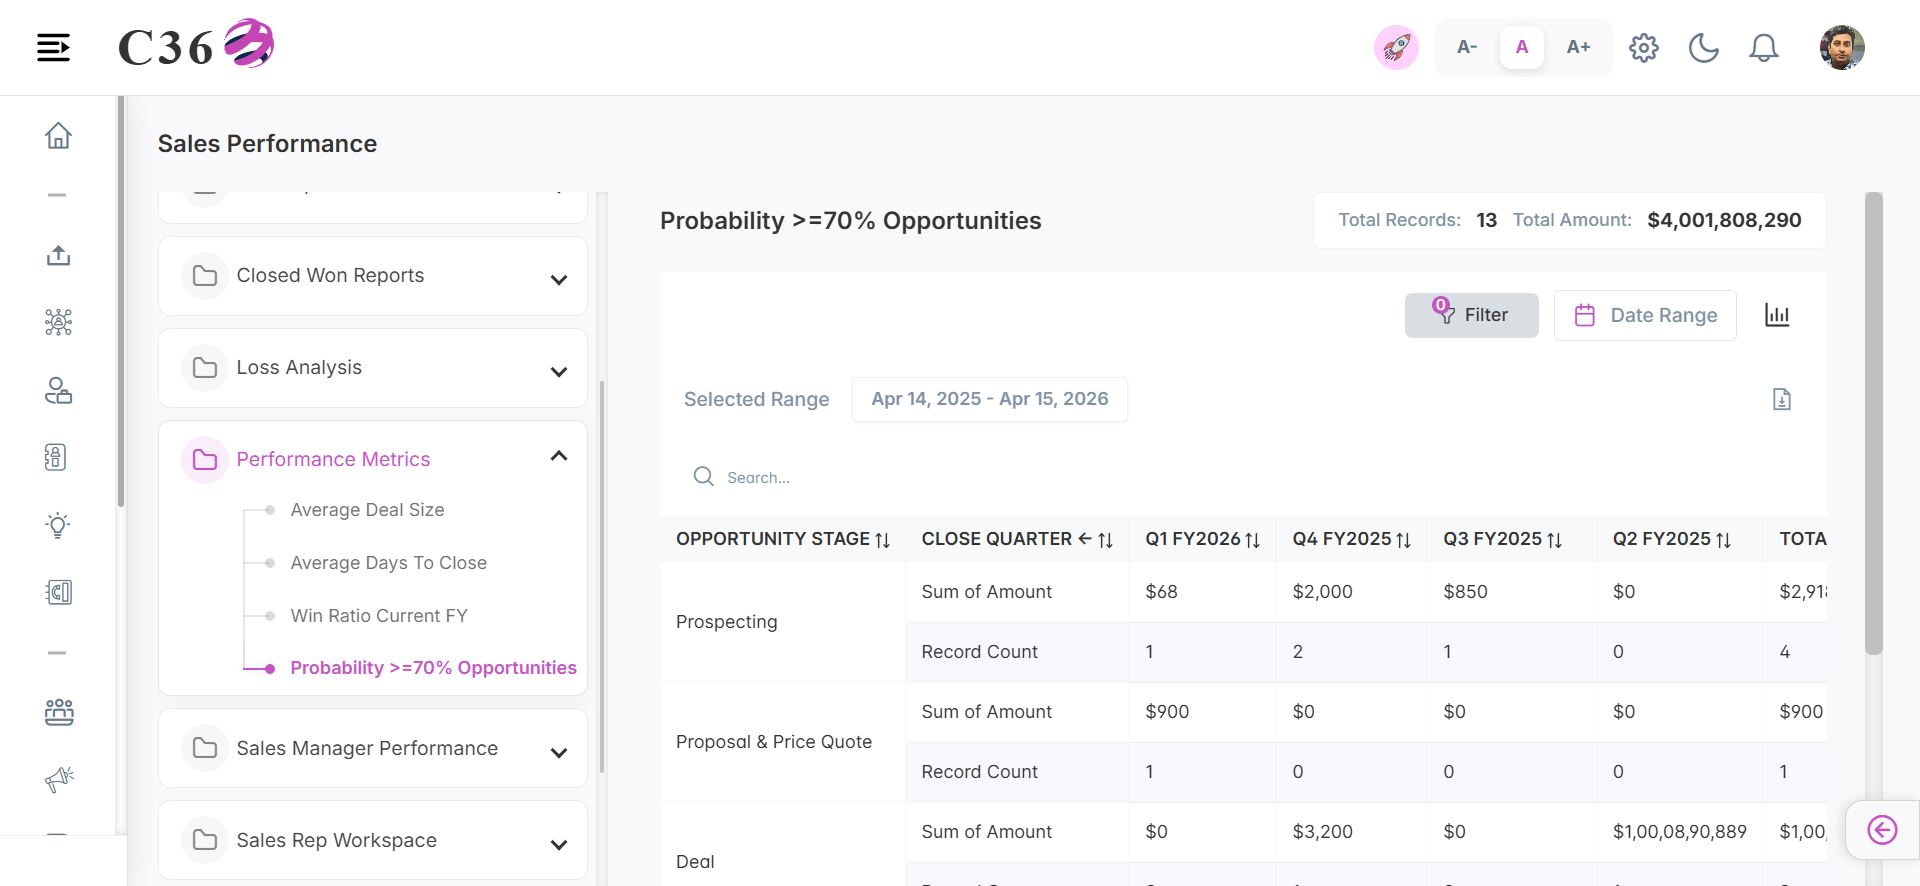
🎯 Probability >= 70% Opportunities
Focuses on high-confidence opportunities that have a 70% or greater likelihood of closing successfully.
- 📊 Chart View
- 📋 Table View
Click to see quick actions
- Can Toggle between Table view and Chart view. - Can Filter the pie chart by selecting and unselecting the color buttons. - Can restore the bar chart. - Save the chart as an image. - Can Export/Download the report. - Can Filter by Date Range. - Can Filter by Country, Company and Users.
Click to see quick actions
- Can Toggle between Table view and Chart view. - Can Export/Download the report. - Can perform search in the table view. - Can Filter by Date Range. - Can Filter by Country, Company and Users.
🧾 Columns included in the table view
| Field Name | Description |
|---|---|
| Opportunity Stage | Current phase of the opportunity in the sales pipeline. |
| Close Quarter | Quarter in which the opportunity is expected to close. |
| Q1 FY 2026 | Represents opportunities scheduled to close in the first quarter of FY 2026. |
| Total | Total value or count of opportunities for the selected quarter. |
━━━━━━━━━━━━━━━━━━━━━━━━━━━━━━━━━━━━━━━━━━━━━━━━━━━━━━━━━━━━━━━━━━━━━━━━━━━━━━━━━━━━━
👔 Sales Manager Performance
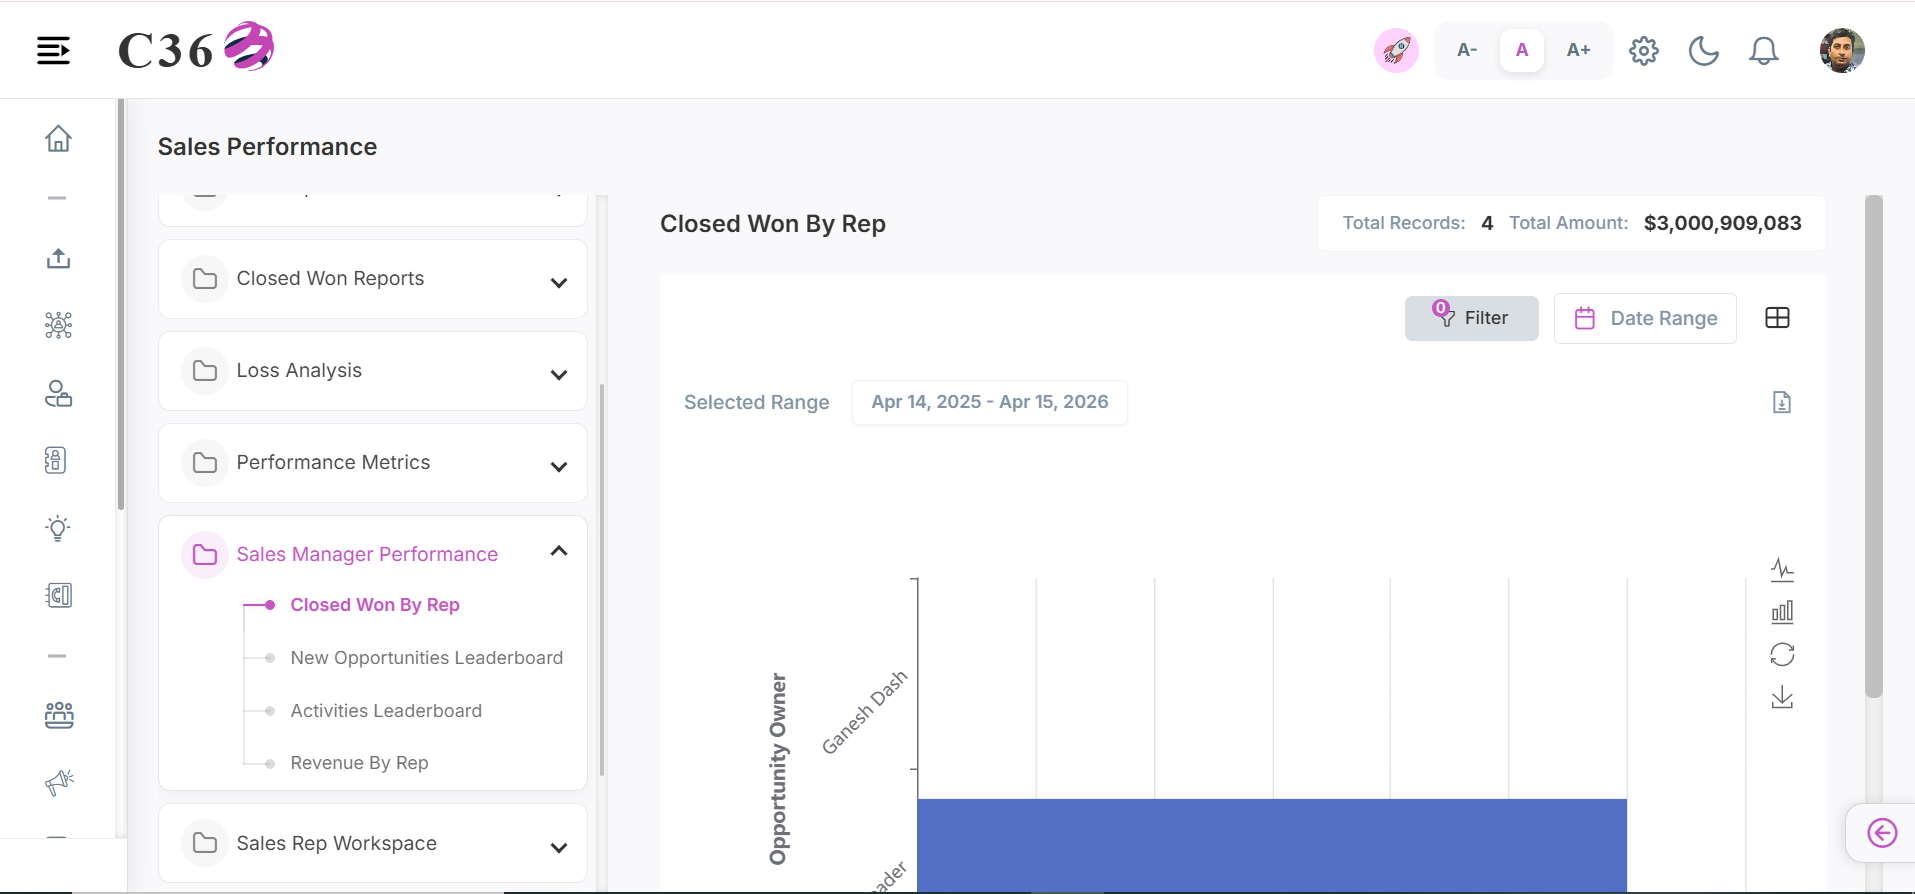
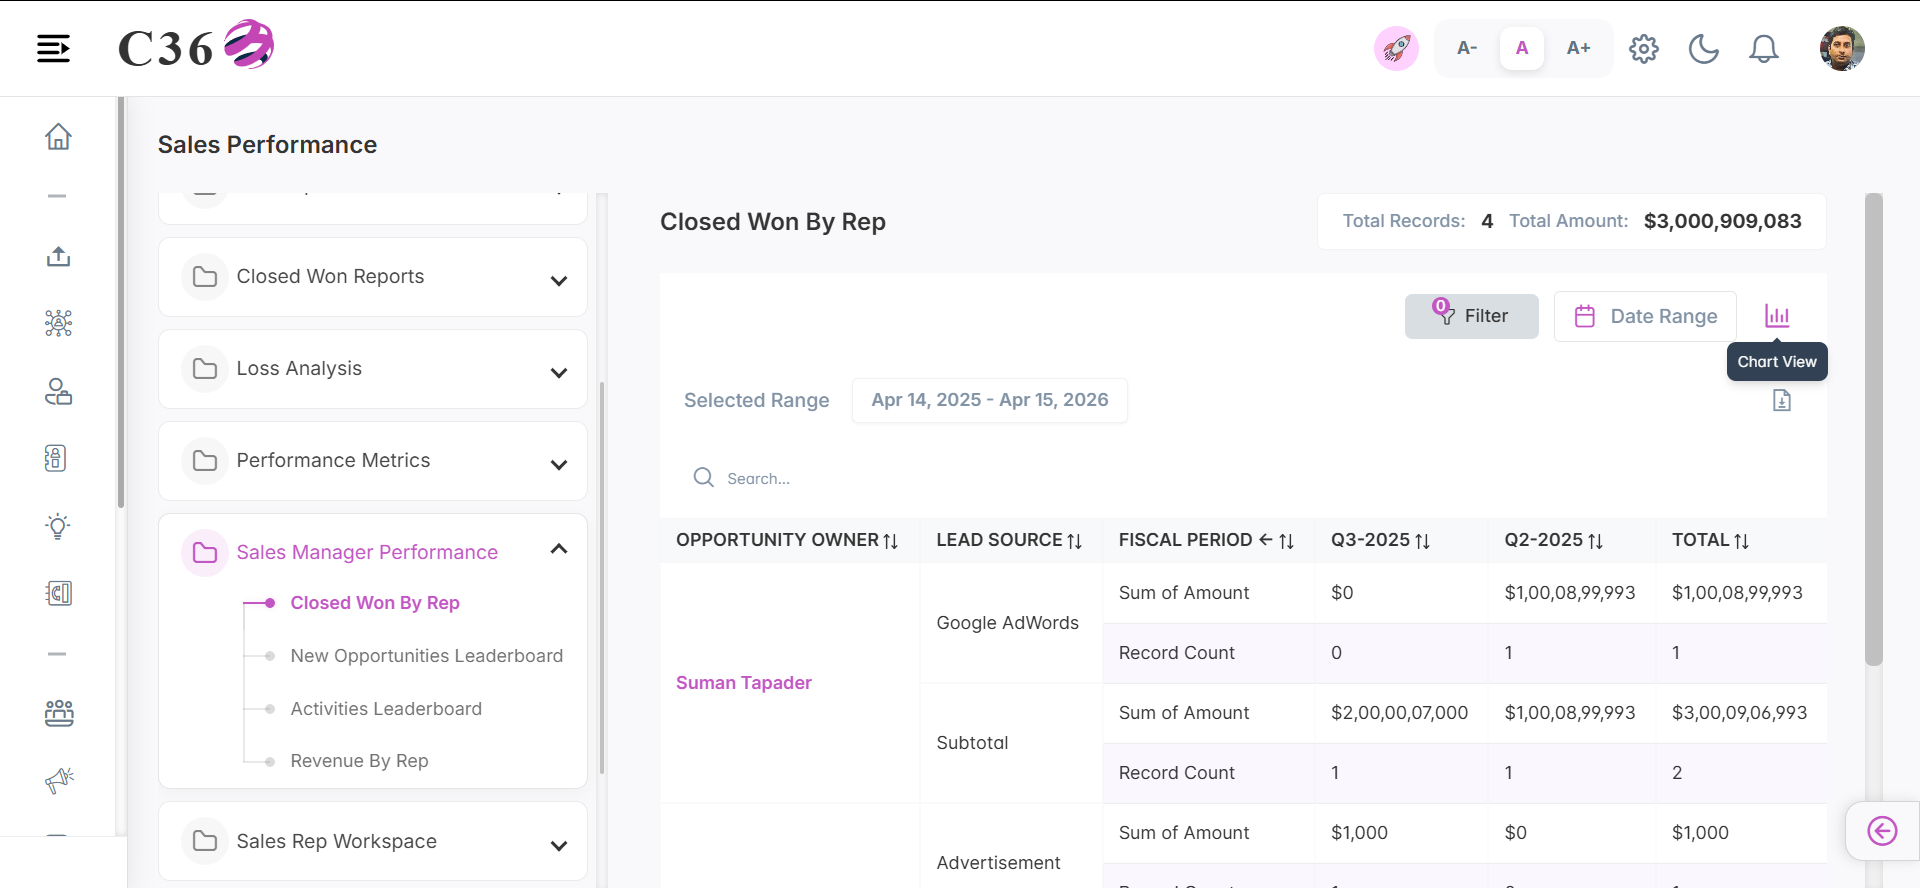
👏 Closed Won By Rep
Spotlights individual rep success by highlighting the total number of deals they have won.
- 📊 Chart View
- 📋 Table View
Click to see quick actions
- Can Toggle between Table view and Chart view. - Can Export/Download the report. - Can Filter by Date Range. - Can Filter by Country, Company and Users. - Toggle between Line chart and Bar chart. - Save the Chart as an image. - Can Restore the bar chart.
Click to see quick actions
- Can Toggle between Table view and Chart view. - Can Export/Download the report. - Can perform search in the table view. - Can Filter by Date Range. - Can Filter by Country, Company and Users.
🧾 Columns included in the table view
| Field Name | Description |
|---|---|
| Opportunity Owner | User responsible for managing and closing the opportunity. |
| Lead Source | Origin from which the opportunity was generated (e.g., Web, Referral). |
| Fiscal Period | Financial period (month/quarter/year) associated with the opportunity. |
| Q1 2026 | Represents opportunities within the first quarter of the year 2026. |
| Total | Total value or count of opportunities for the selected fiscal period. |
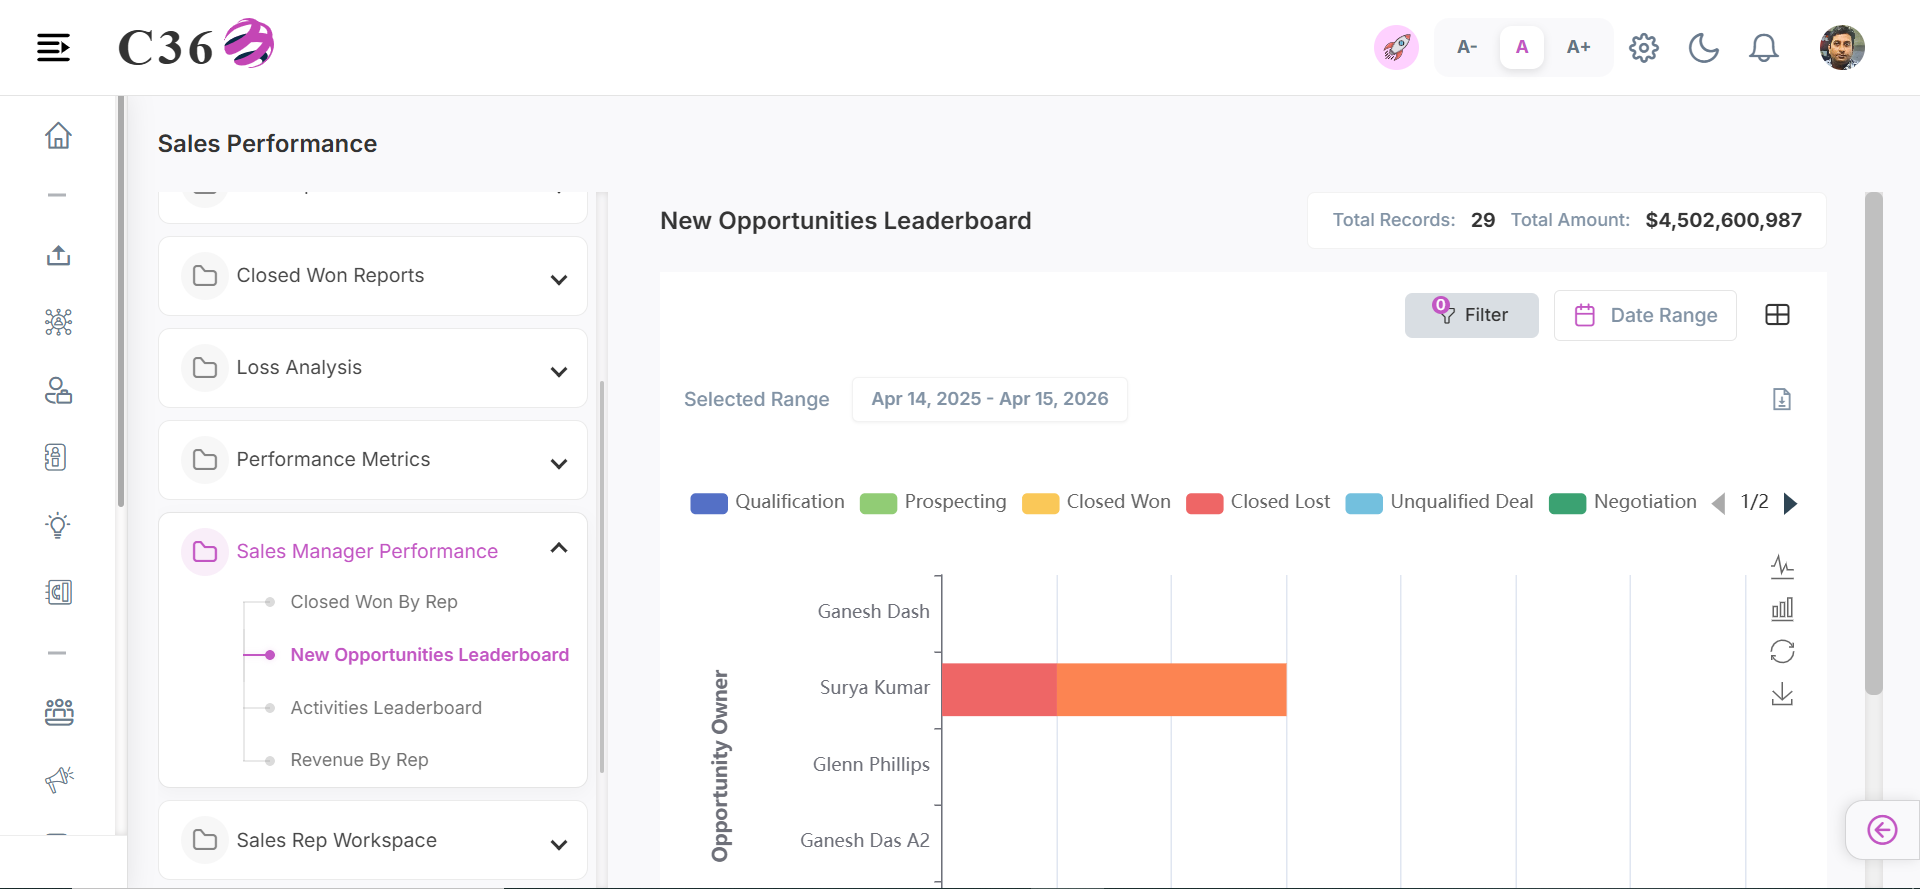
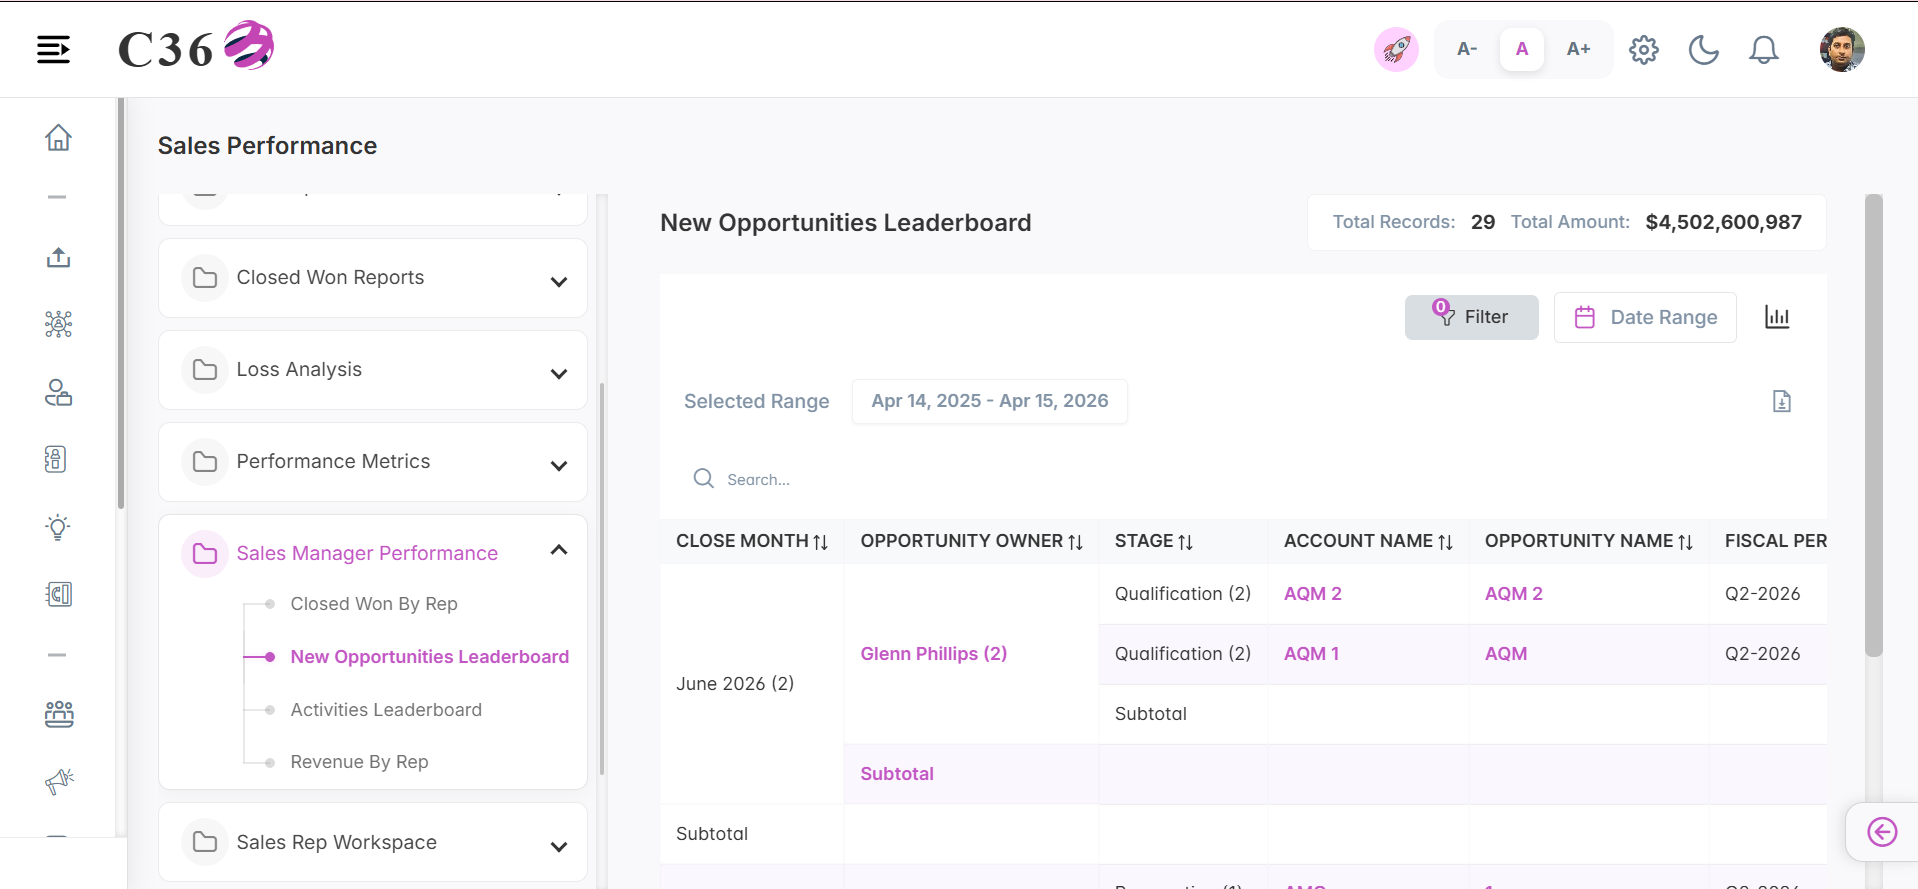
🌟 New Opportunities Leaderboard
Ranks sales representatives based on the volume of new opportunities they have successfully generated.
- 📊 Chart View
- 📋 Table View
Click to see quick actions
- Can Toggle between Table view and Chart view. - Can Filter the chart by selecting and unselecting the color buttons. - Can Export/Download the report.
- Can Filter by Date Range. - Can Filter by Country, Company and Users. - Toggle between Line chart and Bar chart. - Save the Chart as an image. - Can Restore the bar chart.
Click to see quick actions
- Can Toggle between Table view and Chart view. - Can Export/Download the report. - Can Perform the search in the table view. - Can Filter by Date Range. - Can Filter by Country, Company and Users.
🧾 Columns included in the table view
| Field Name | Description |
|---|---|
| Close Month | Month in which the opportunity is expected to close. |
| Opportunity Owner | User responsible for managing and closing the opportunity. |
| Stage | Current phase of the opportunity in the sales pipeline. |
| Account Name | Name of the customer or business linked to the opportunity. |
| Opportunity Name | Unique name or title identifying the opportunity. |
| Fiscal Period | Financial period (month/quarter/year) associated with the opportunity. |
| Amount | Expected revenue value of the opportunity. |
| Probability | Likelihood (in %) of the opportunity being successfully closed. |
| Age | Number of days since the opportunity was created. |
| Close Date | Expected or actual date when the opportunity will be closed. |
| Created Date | Date when the opportunity record was created. |
| Lead Source | Origin from which the opportunity was generated (e.g., Web, Referral). |
| Type | Category of the opportunity (e.g., New Business, Existing Customer). |
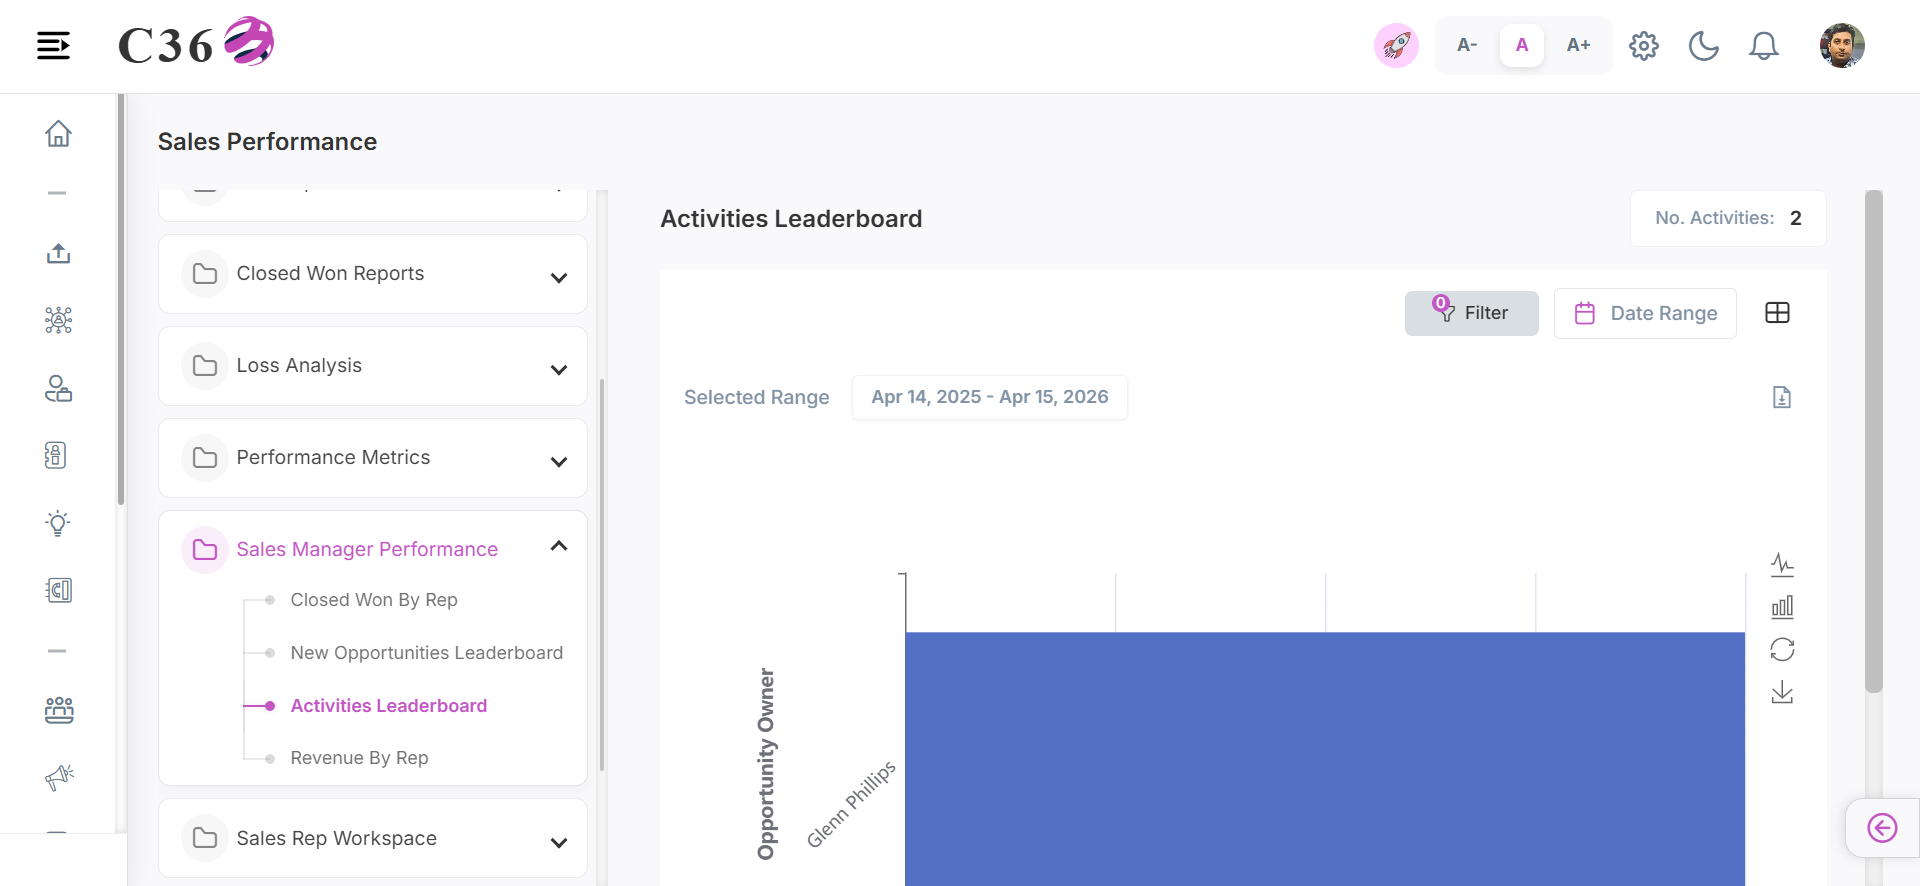
🏃♂️ Activities Leaderboard
Ranks team members by the total number of logged sales activities and active engagements.
- 📊 Chart View
- 📋 Table View
Click to see quick actions
- Can Toggle between Table view and Chart view. - Can Export/Download the report. - Can Filter by Date Range. - Can Filter by Country, Company and Users. - Toggle between Line chart and Bar chart. - Save the Chart as an image. - Can Restore the bar chart.
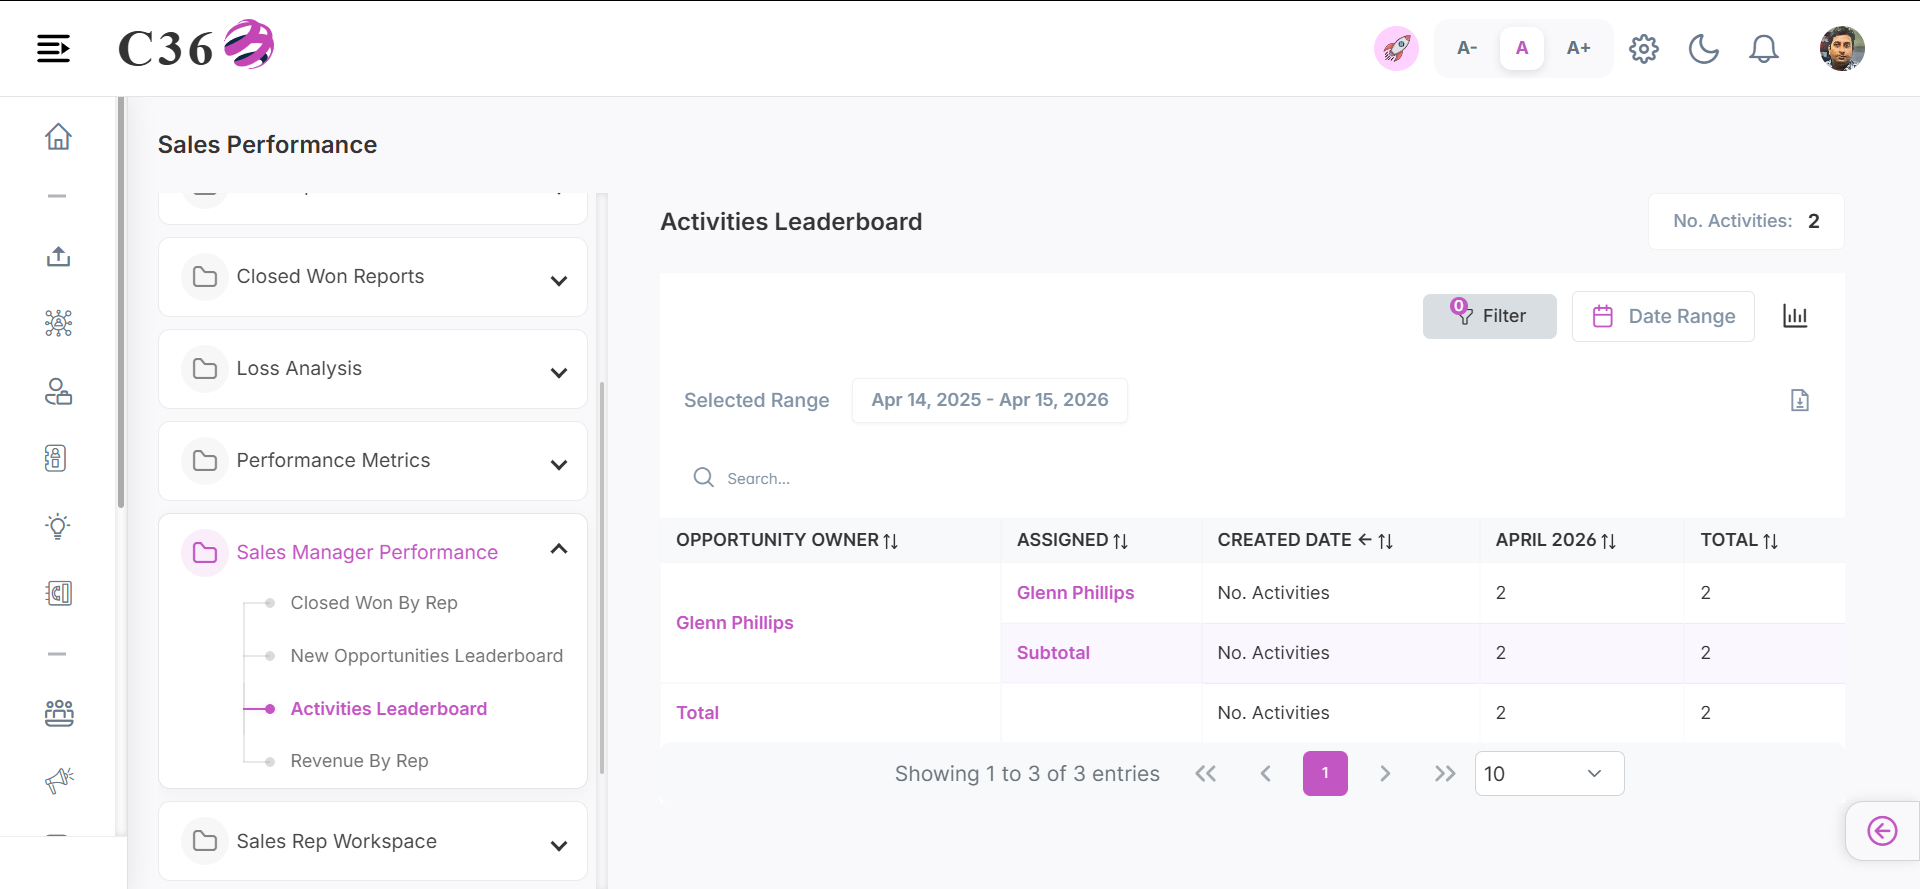
Click to see quick actions
- Can Toggle between Table view and Chart view. - Can Export/Download the report. - Can perform search in the table view. - Can Filter by Date Range. - Can Filter by Country, Company and Users.
🧾 Columns included in the table view
| Field Name | Description |
|---|---|
| Opportunity Owner | User responsible for managing and owning the opportunity. |
| Assigned | Indicates when or to whom the opportunity was assigned. |
| Created Date | Date when the opportunity record was created. |
| January 2026 | Represents opportunities created or assigned in January 2026. |
| Total | Total value or count of opportunities for the selected period. |
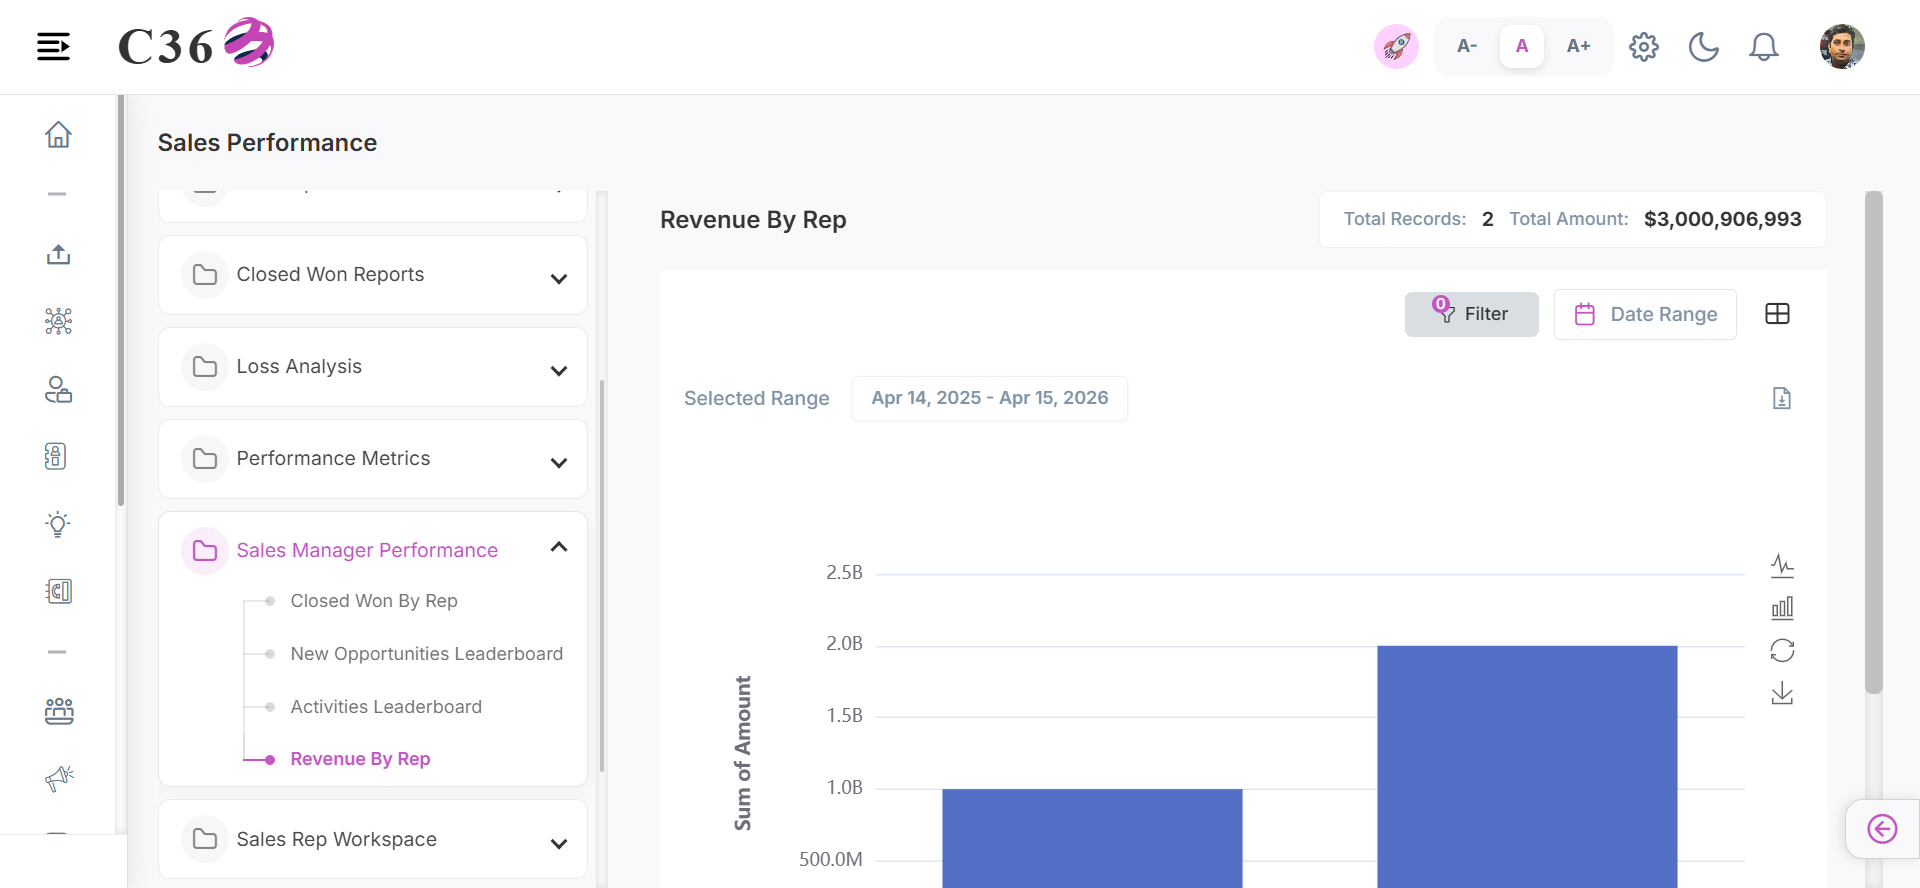
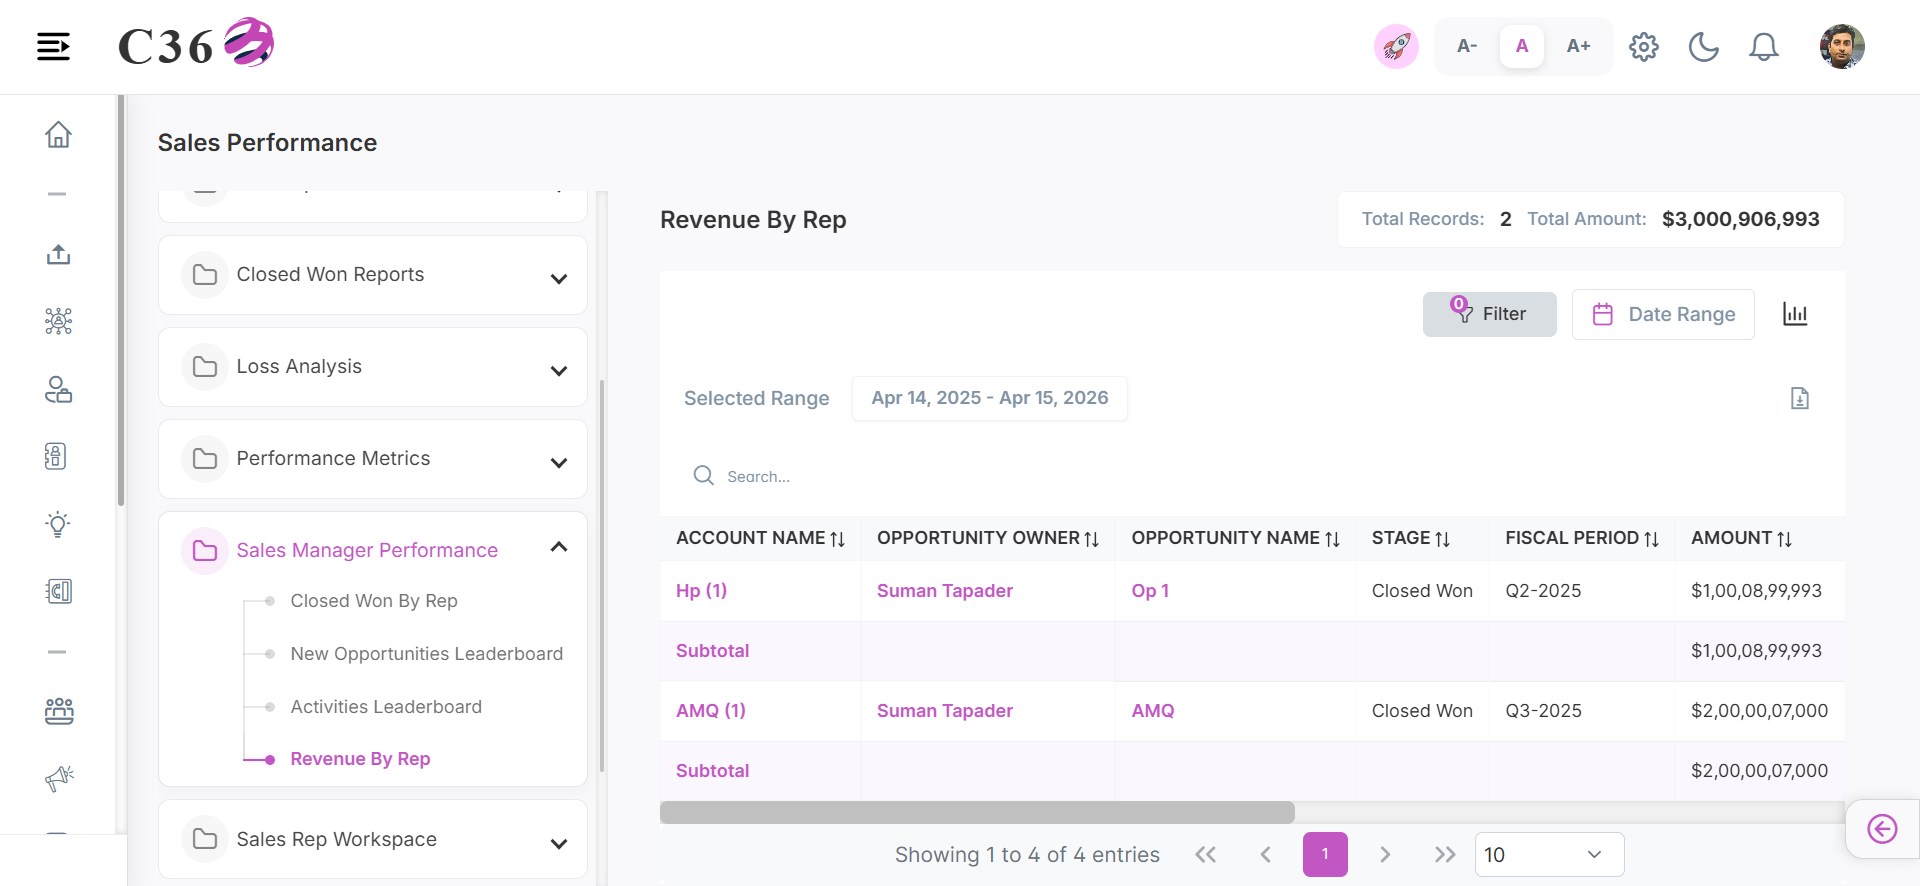
💵 Revenue By Rep
Displays the total financial contribution generated by individual sales representatives.
- 📊 Chart View
- 📋 Table View
Click to see quick actions
- Can Toggle between Table view and Chart view. - Can Export/Download the report. - Can Filter by Date Range. - Can Filter by Country, Company and Users. - Toggle between Line chart and Bar chart. - Save the Chart as an image. - Can Restore the bar chart.
Click to see quick actions
- Can Toggle between Table view and Chart view. - Can Export/Download the report. - Can perform search in the table view. - Can Filter by Date Range. - Can Filter by Country, Company and Users.
🧾 Columns included in the table view
| Field Name | Description |
|---|---|
| Account Name | Name of the customer or business linked to the opportunity. |
| Opportunity Owner | User responsible for managing and closing the opportunity. |
| Opportunity Name | Unique name or title identifying the opportunity. |
| Stage | Current phase of the opportunity in the sales pipeline. |
| Fiscal Period | Financial period (month/quarter/year) associated with the opportunity. |
| Amount | Expected revenue value of the opportunity. |
| Probability | Likelihood (in %) of the opportunity being successfully closed. |
| Age | Number of days since the opportunity was created. |
| Close Date | Expected or actual date when the opportunity will be closed. |
| Created Date | Date when the opportunity record was created. |
| Lead Source | Origin from which the opportunity was generated (e.g., Web, Referral). |
| Type | Category of the opportunity (e.g., New Business, Existing Customer). |
━━━━━━━━━━━━━━━━━━━━━━━━━━━━━━━━━━━━━━━━━━━━━━━━━━━━━━━━━━━━━━━━━━━━━━━━━━━━━━━━━━━━━
🧑💻 Sales Rep Workspace
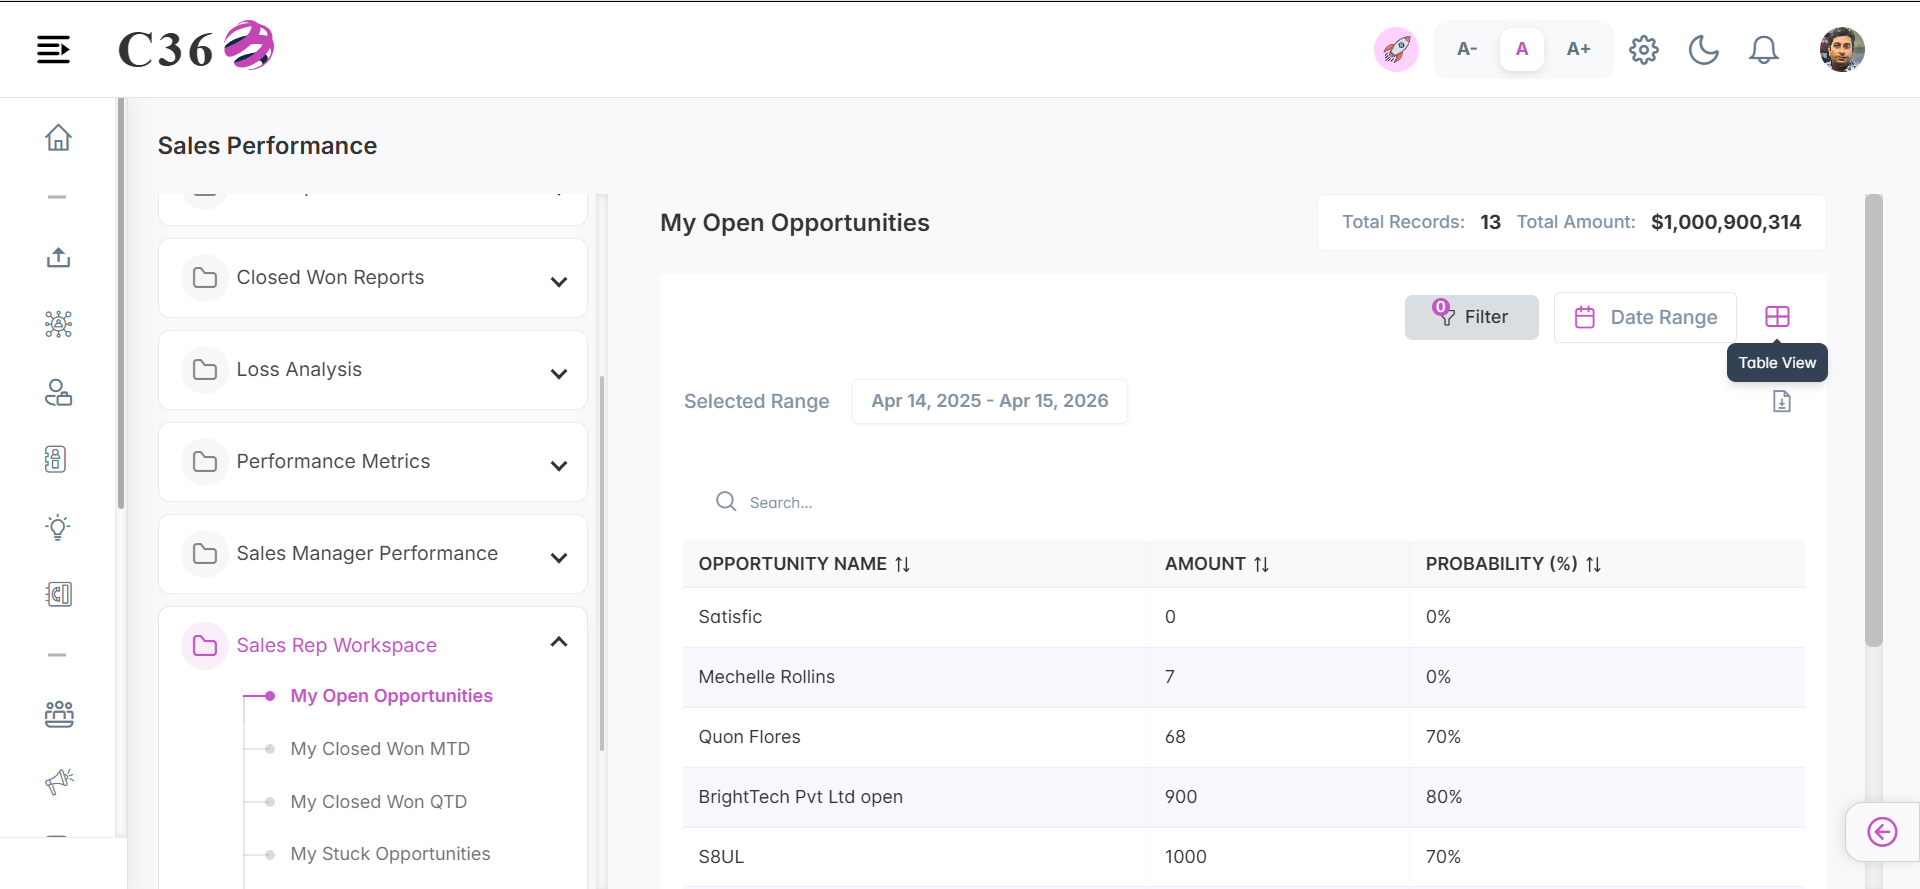
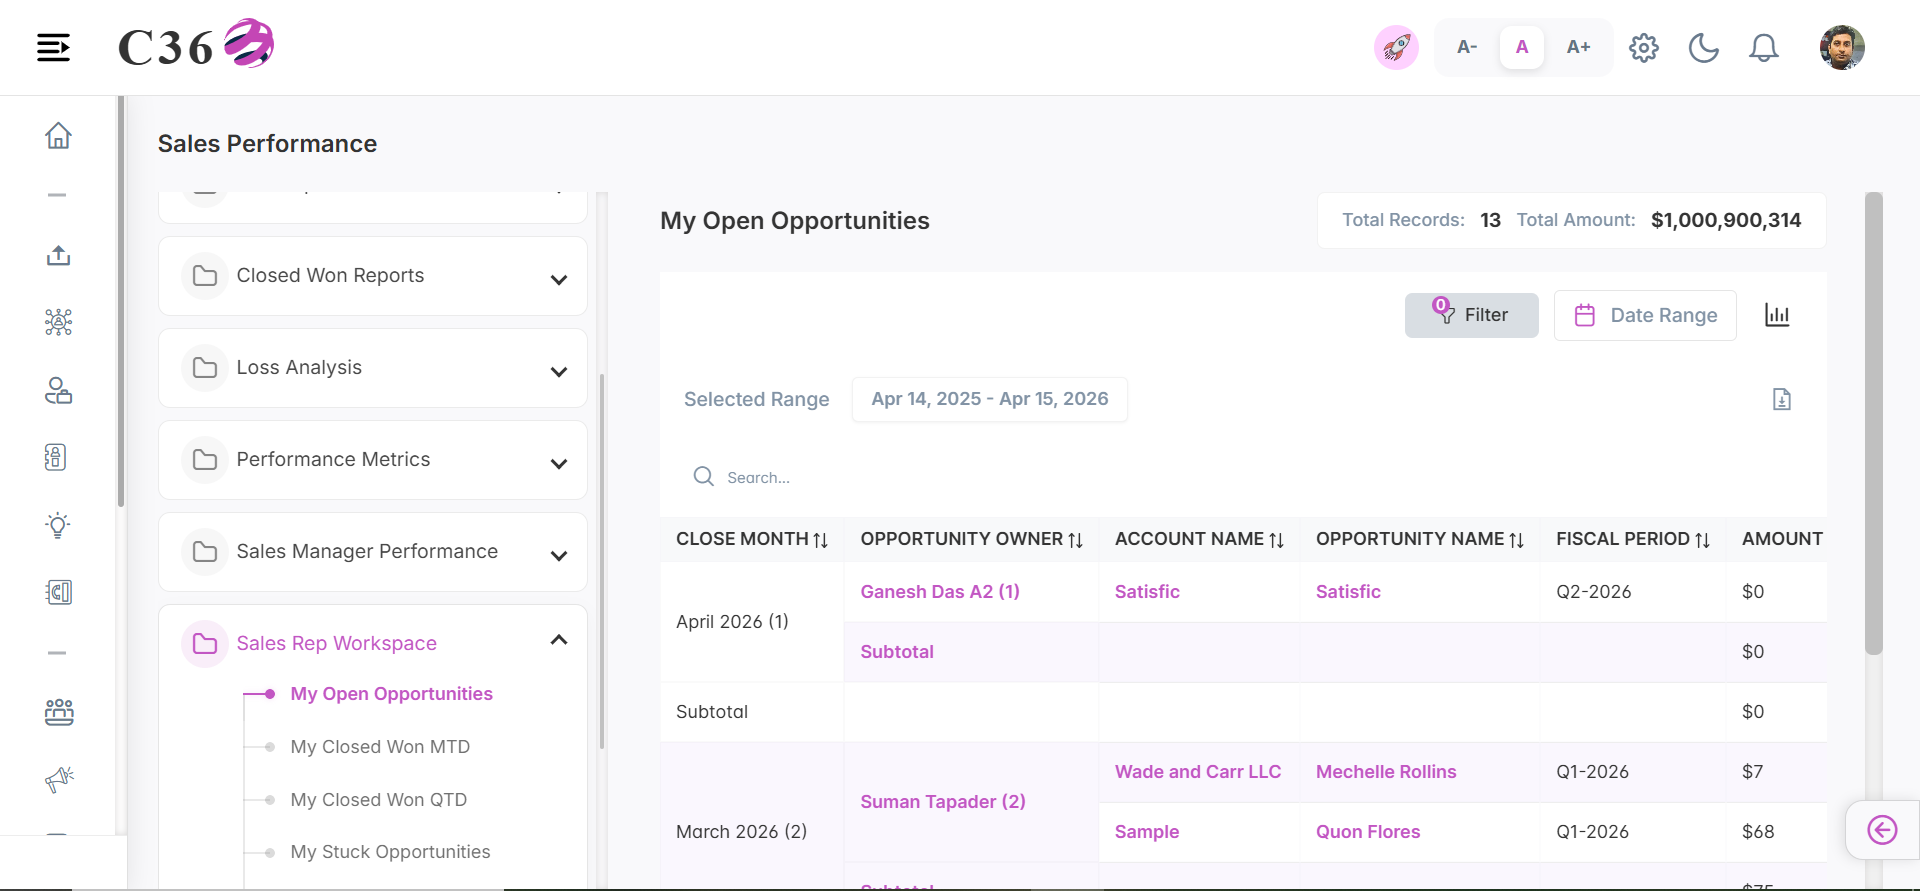
📂 My Open Opportunities
Provides a personalized view of all active opportunities currently assigned to the user.
- 📊 Chart View
- 📋 Table View
Click to see quick actions
- Can Toggle between Table view and Chart view. - Can Export/Download the report. - Can perform search in the table view. - Can Filter by Date Range. - Can Filter by Country, Company and Users.
Click to see quick actions
- Can Toggle between Table view and Chart view. - Can Export/Download the report. - Can perform search in the table view. - Can Filter by Date Range. - Can Filter by Country, Company and Users.
🧾 Columns included in the table view
| Field Name | Description |
|---|---|
| Close Month | Month in which the opportunity is expected to close. |
| Opportunity Owner | User responsible for managing and closing the opportunity. |
| Account Name | Name of the customer or business linked to the opportunity. |
| Opportunity Name | Unique name or title identifying the opportunity. |
| Fiscal Period | Financial period (month/quarter/year) associated with the opportunity. |
| Amount | Expected revenue value of the opportunity. |
| Probability | Likelihood (in %) of the opportunity being successfully closed. |
| Age | Number of days since the opportunity was created. |
| Close Date | Expected or actual date when the opportunity will be closed. |
| Created Date | Date when the opportunity record was created. |
| Lead Source | Origin from which the opportunity was generated (e.g., Web, Referral). |
| Type | Category of the opportunity (e.g., New Business, Existing Customer). |
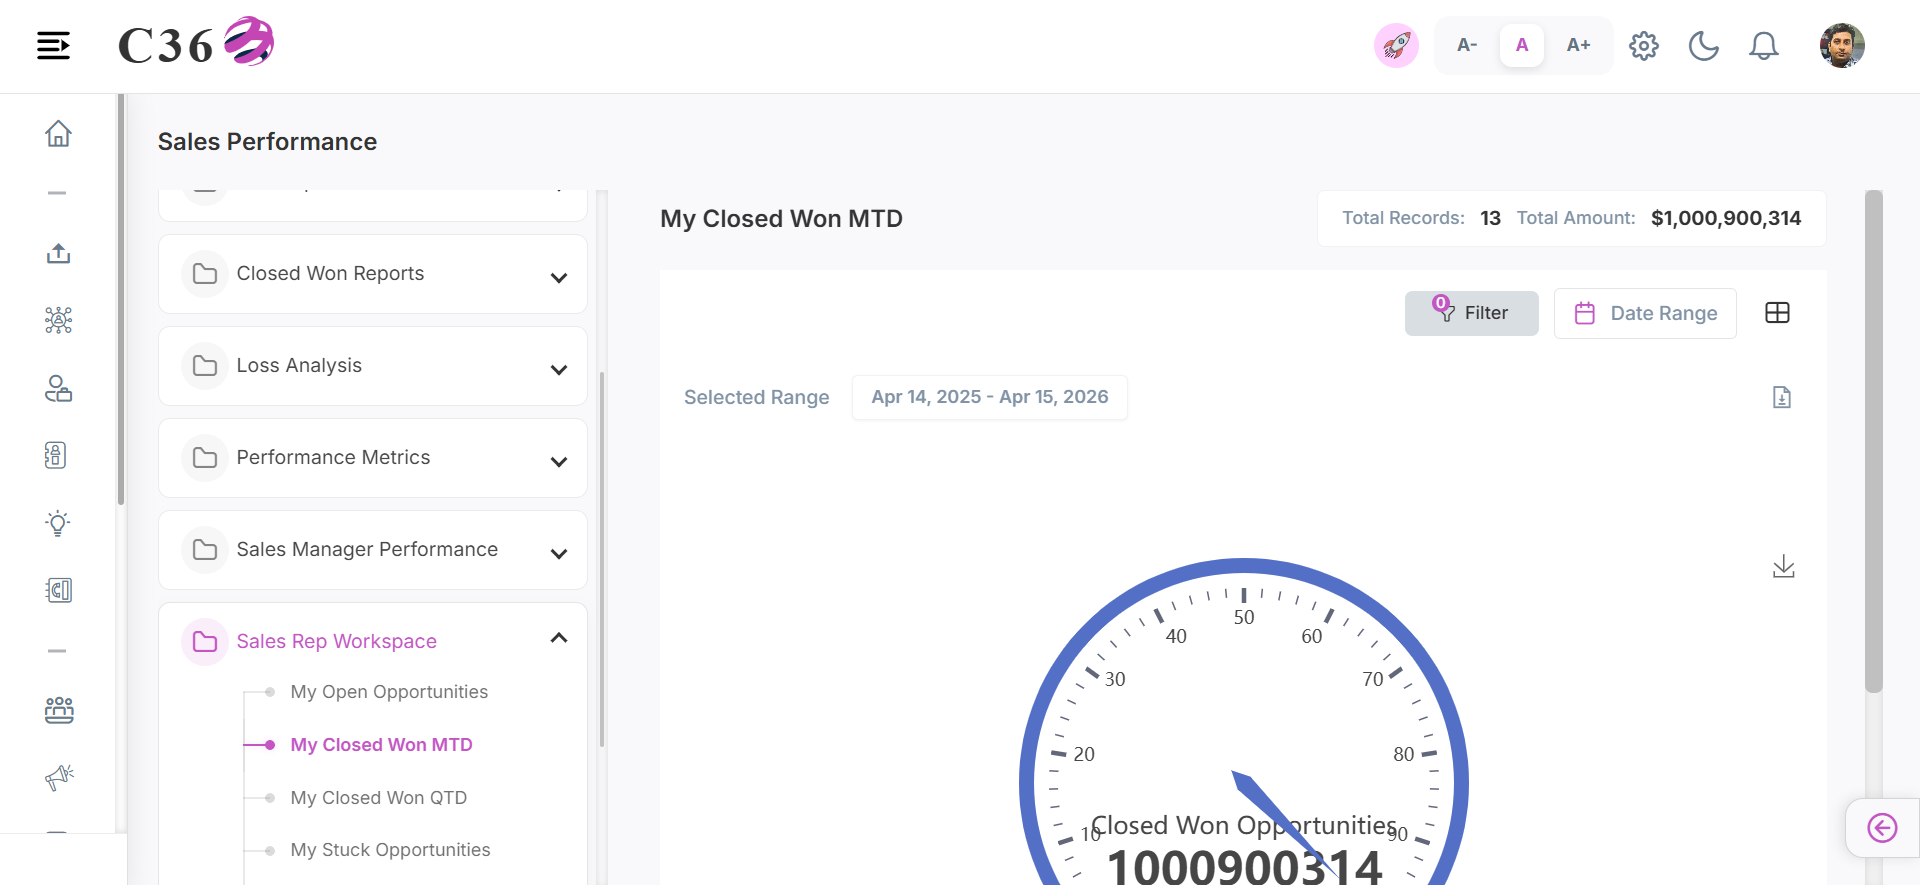
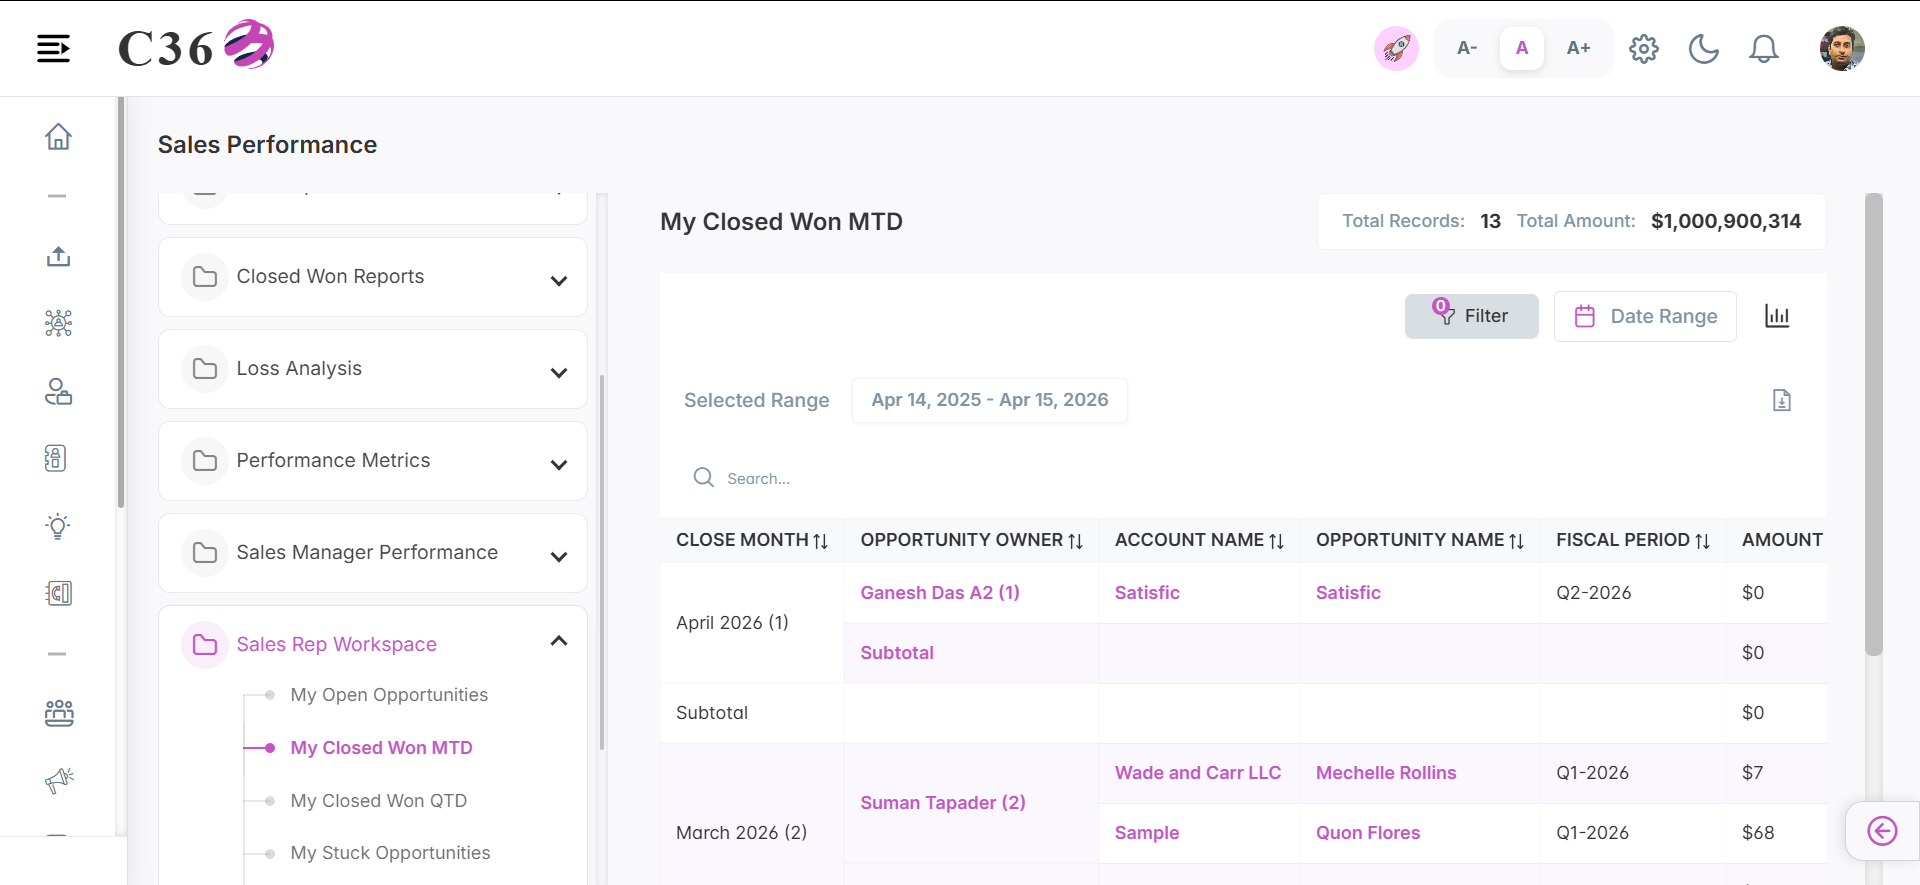
🗓️ My Closed Won MTD
Summarizes the user's successful deal closures from the beginning of the current month to date.
- 📊 Chart View
- 📋 Table View
Click to see quick actions
- Can Toggle between Table view and Chart view. - Can Export/Download the report. - Save the Chart as an image. - Can Filter by Date Range. - Can Filter by Country, Company and Users.
Click to see quick actions
- Can Toggle between Table view and Chart view. - Can Export/Download the report. - Can perform search in the table view. - Can Filter by Date Range. - Can Filter by Country, Company and Users.
🧾 Columns included in the table view
| Field Name | Description |
|---|---|
| Close Month | Month in which the opportunity is expected to close. |
| Opportunity Owner | User responsible for managing and closing the opportunity. |
| Account Name | Name of the customer or business linked to the opportunity. |
| Opportunity Name | Unique name or title identifying the opportunity. |
| Fiscal Period | Financial period (month/quarter/year) associated with the opportunity. |
| Amount | Expected revenue value of the opportunity. |
| Probability | Likelihood (in %) of the opportunity being successfully closed. |
| Age | Number of days since the opportunity was created. |
| Close Date | Expected or actual date when the opportunity will be closed. |
| Created Date | Date when the opportunity record was created. |
| Lead Source | Origin from which the opportunity was generated (e.g., Web, Referral). |
| Type | Category of the opportunity (e.g., New Business, Existing Customer). |
📅 My Closed Won QTD
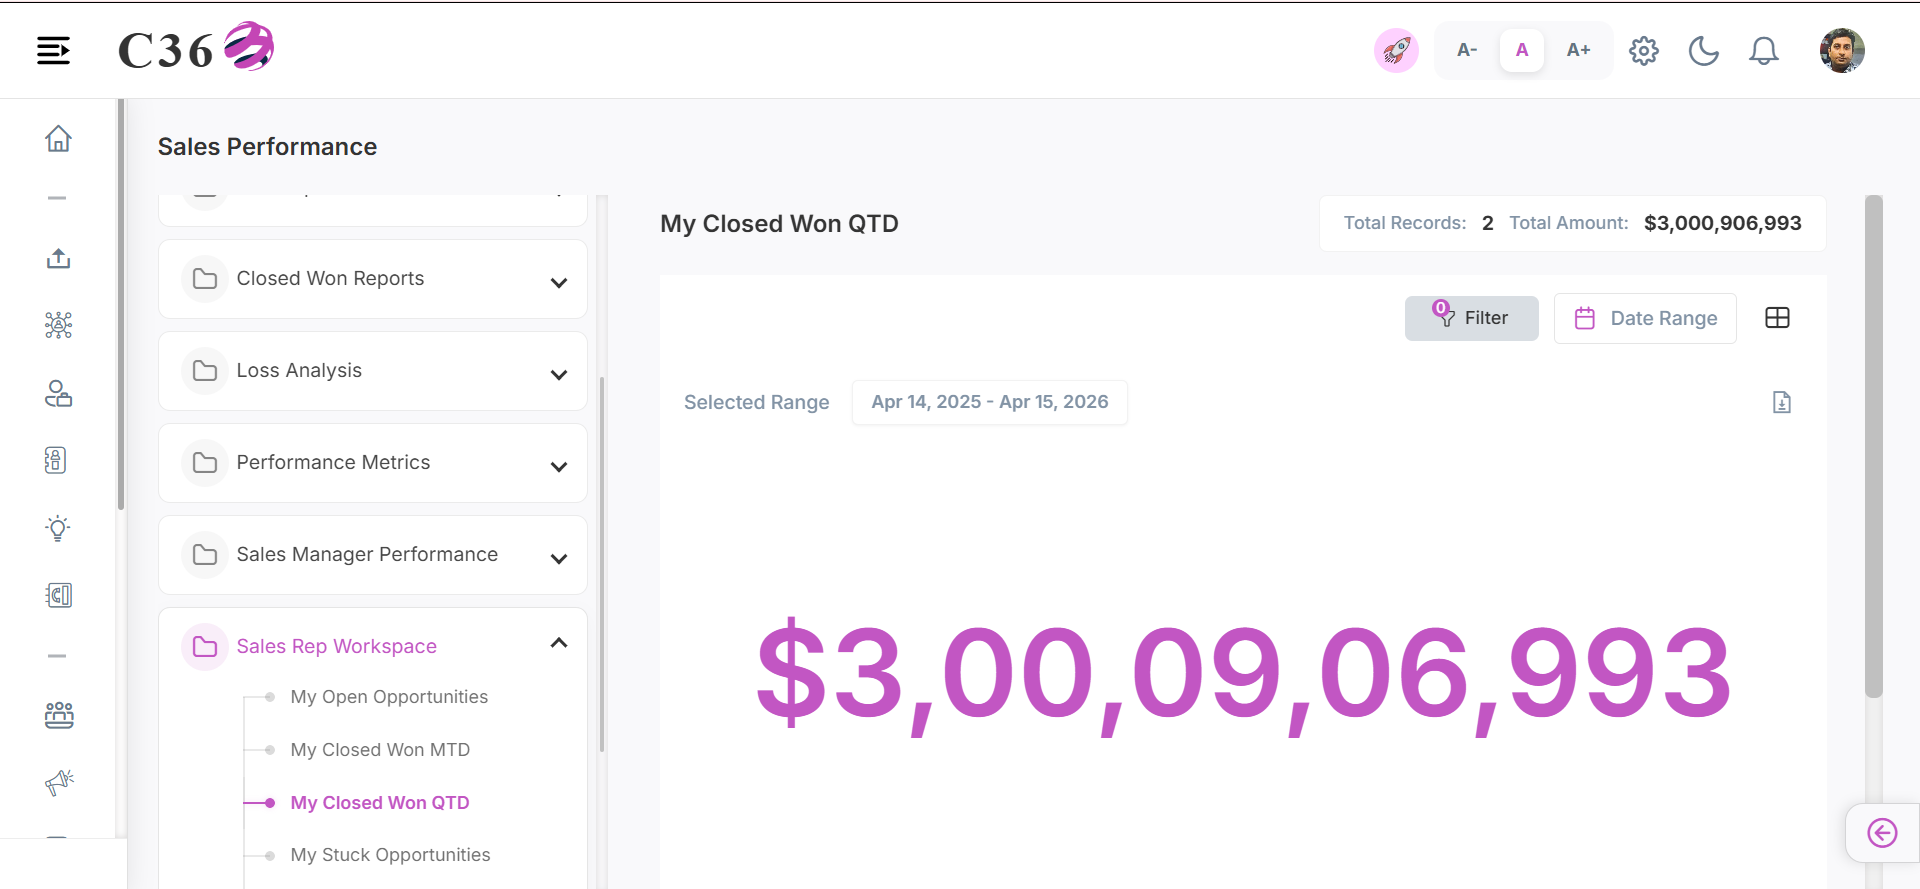
Summarizes the user's successful deal closures from the beginning of the current quarter to date.
- 📊 Chart View
- 📋 Table View
Click to see quick actions
- Can Toggle between Table view and Chart view. - Can Export/Download the report. - Save the Chart as an image. - Can Filter by Date Range. - Can Filter by Country, Company and Users.
Click to see quick actions
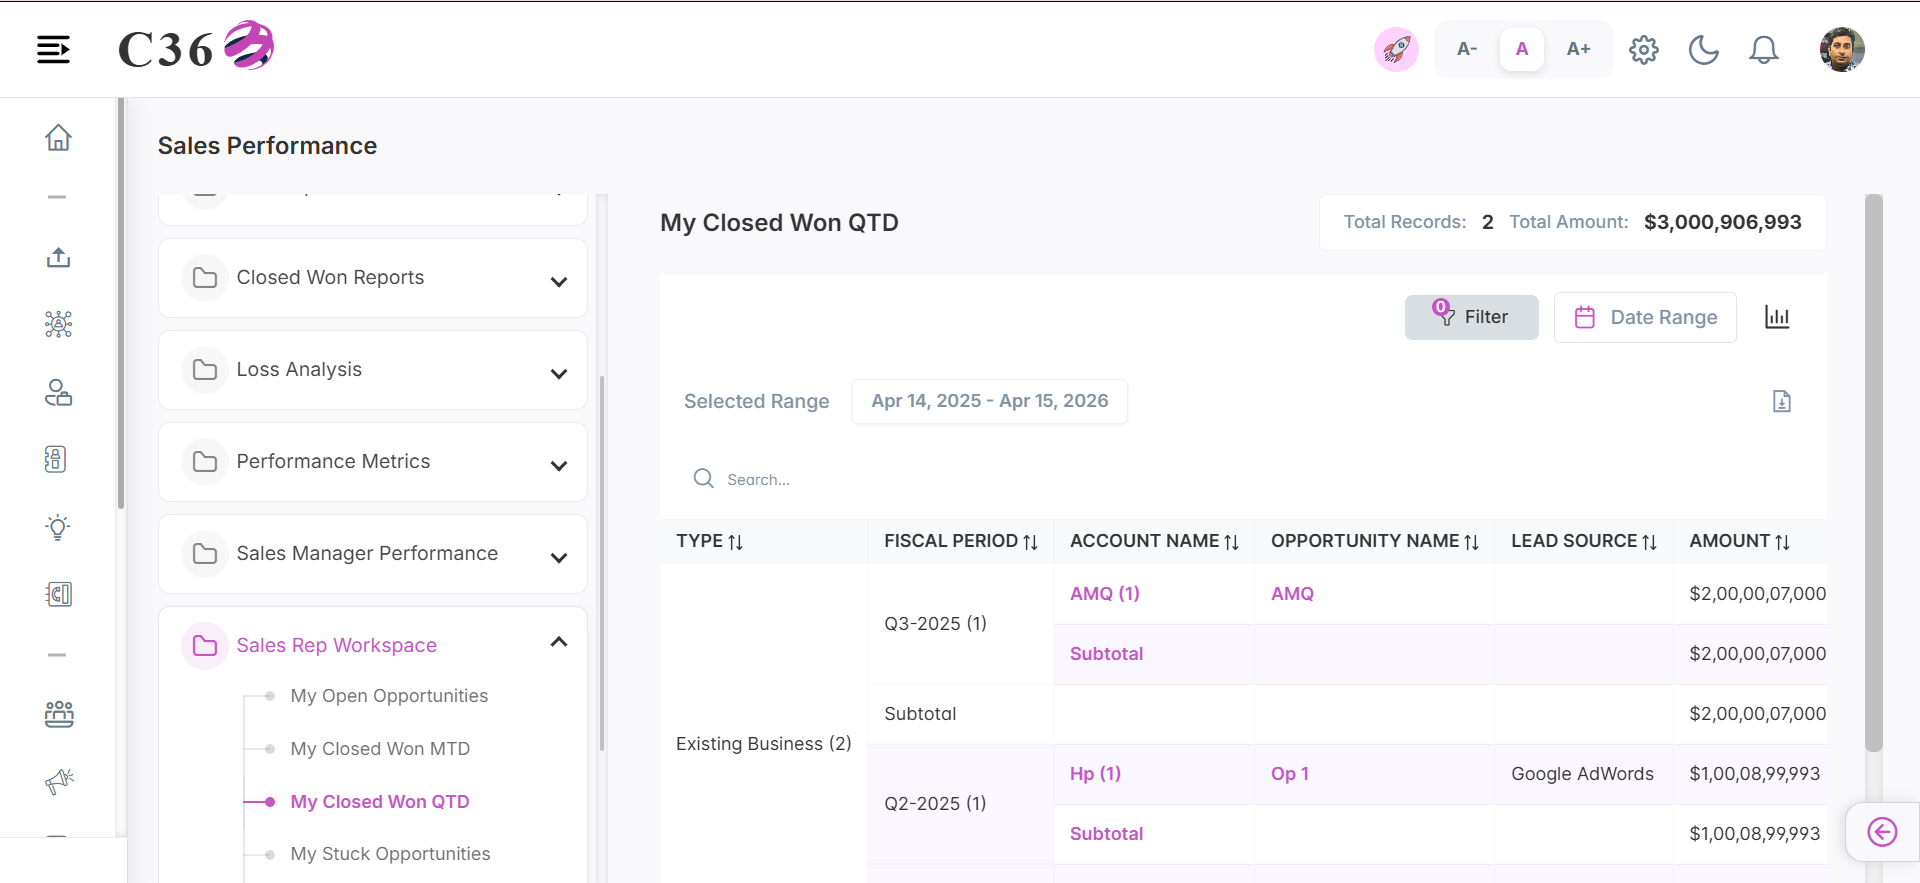
- Can Toggle between Table view and Chart view. - Can Export/Download the report. - Can perform search in the table view. - Can Filter by Date Range. - Can Filter by Country, Company and Users.
🧾 Columns included in the table view
| Field Name | Description |
|---|---|
| Type | Category of the opportunity (e.g., New Business, Existing Customer). |
| Fiscal Period | Financial period (month/quarter/year) associated with the opportunity. |
| Account Name | Name of the customer or business linked to the opportunity. |
| Opportunity Name | Unique name or title identifying the opportunity. |
| Lead Source | Origin from which the opportunity was generated (e.g., Web, Referral). |
| Amount | Expected revenue value of the opportunity. |
| Close Date | Expected or actual date when the opportunity will be closed. |
| Stage | Current phase of the opportunity in the sales pipeline. |
| Probability | Likelihood (in %) of the opportunity being successfully closed. |
| Age | Number of days since the opportunity was created. |
| Created Date | Date when the opportunity record was created. |
| Opportunity Owner | User responsible for managing and closing the opportunity. |
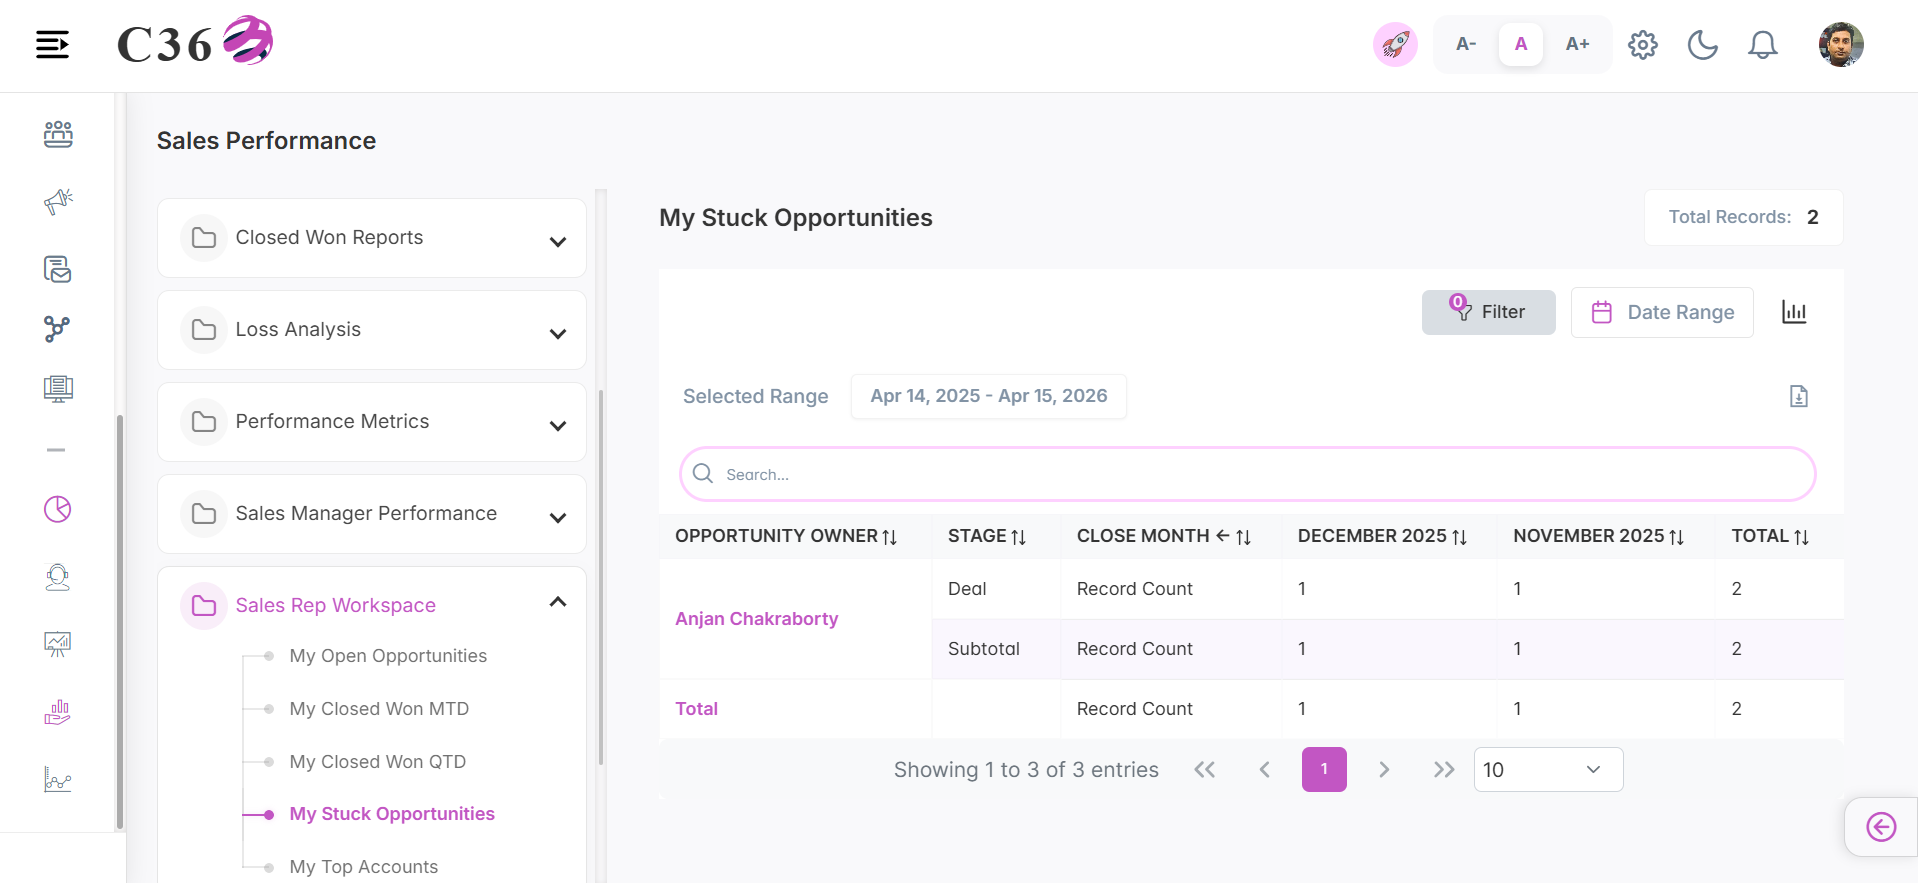
🛑 My Stuck Opportunities
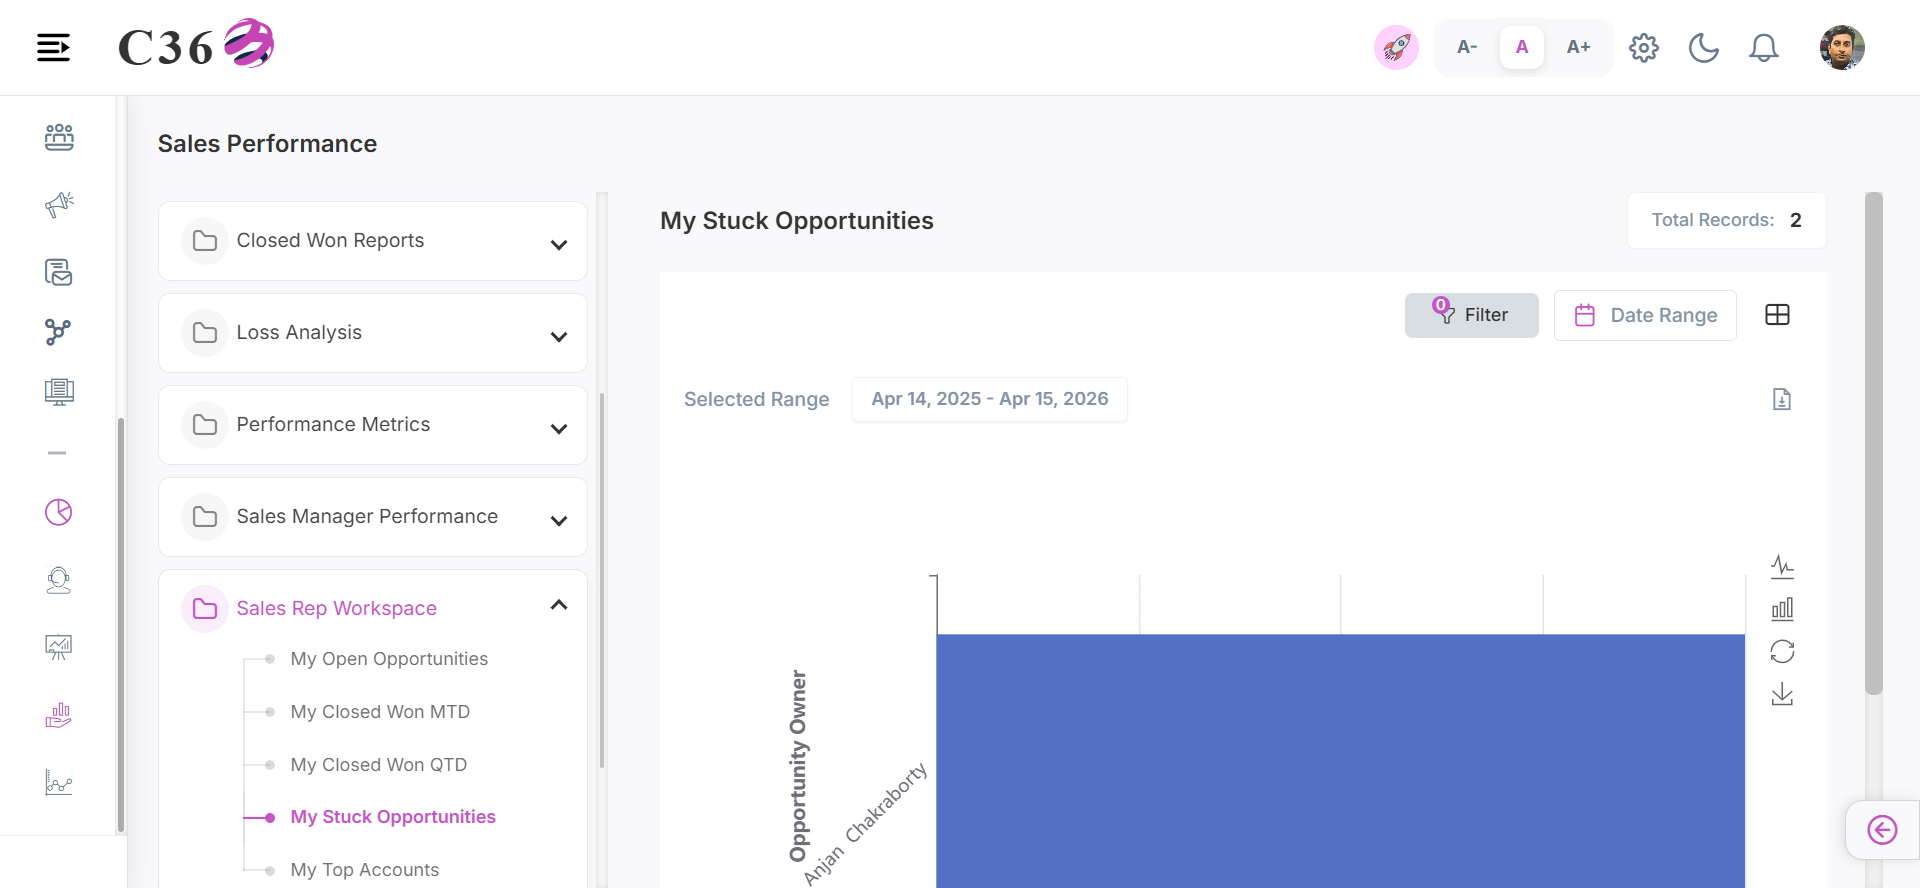
Alerts the user to their own opportunities that have stalled and require immediate attention.
- 📊 Chart View
- 📋 Table View
Click to see quick actions
- Can Toggle between Table view and Chart view. - Can Export/Download the report. - Can Filter by Date Range. - Can Filter by Country, Company and Users. - Toggle between Line chart and Bar chart. - Save the Chart as an image. - Can Restore the bar chart.
Click to see quick actions
- Can Toggle between Table view and Chart view. - Can Export/Download the report. - Can perform search in the table. - Can Filter by Date Range. - Can Filter by Country, Company and Users.
🧾 Columns included in the table view
| Field Name | Description |
|---|---|
| Opportunity Owner | User responsible for managing and closing the opportunity. |
| Stage | Current phase of the opportunity in the sales pipeline. |
| Close Month | Month in which the opportunity is expected to close. |
| January 2026 | Represents opportunities scheduled to close in January 2026. |
| Total | Total value or count of opportunities for the selected month. |
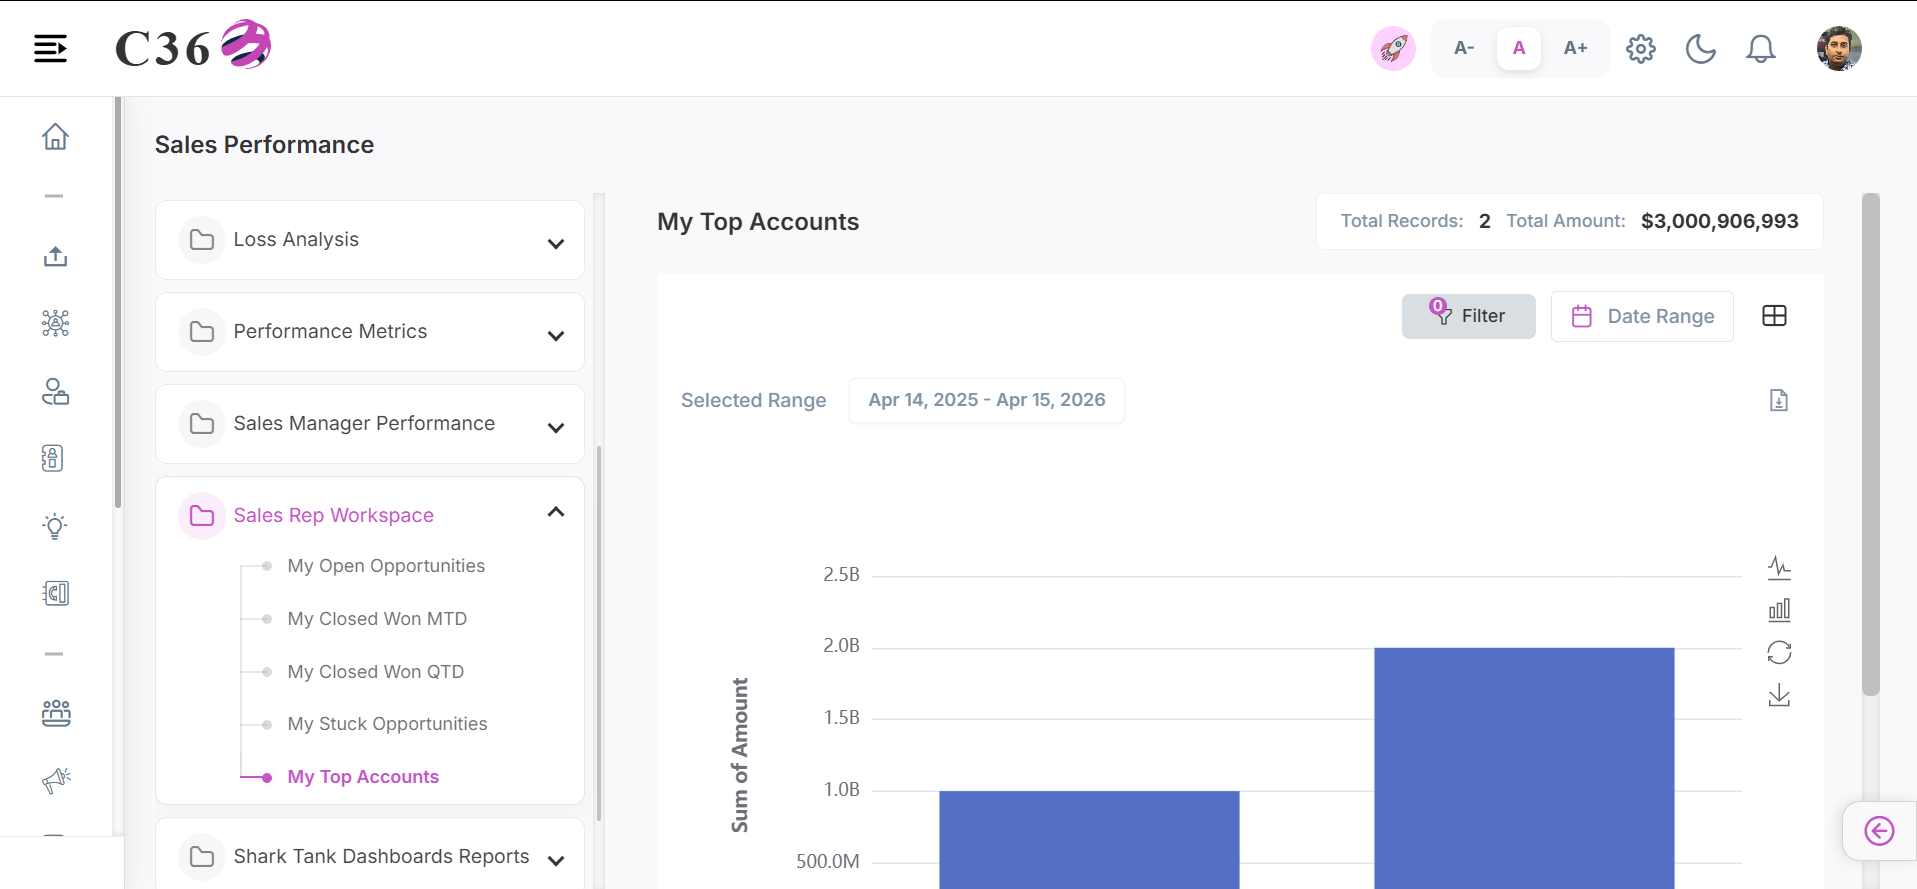
⭐ My Top Accounts
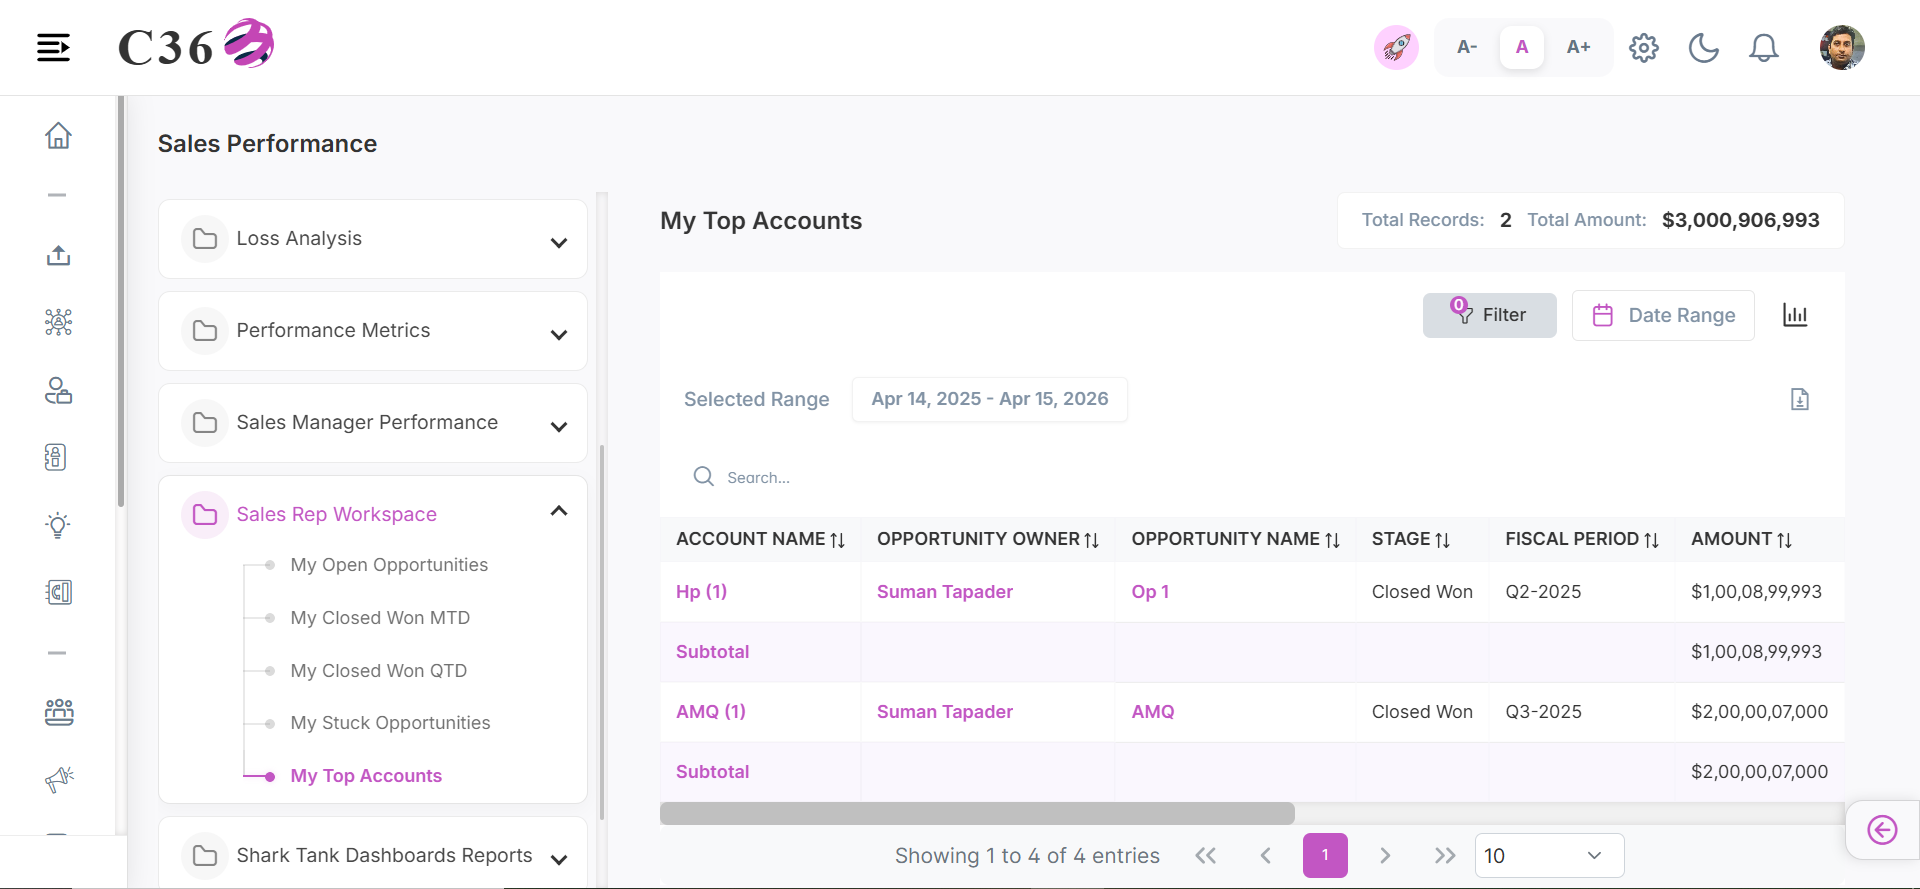
Highlights the user's most valuable and high-priority accounts based on deal size or status.
- 📊 Chart View
- 📋 Table View
Click to see quick actions
- Can Toggle between Table view and Chart view. - Can Export/Download the report. - Can Filter by Date Range. - Can Filter by Country, Company and Users. - Toggle between Line chart and Bar chart. - Save the Chart as an image. - Can Restore the bar chart.
Click to see quick actions
- Can Toggle between Table view and Chart view. - Can Export/Download the report. - Can perform search in the table. - Can Filter by Date Range. - Can Filter by Country, Company and Users.
🧾 Columns included in the table view
| Field Name | Description |
|---|---|
| Account Name | Name of the customer or business linked to the opportunity. |
| Opportunity Owner | User responsible for managing and closing the opportunity. |
| Opportunity Name | Unique name or title identifying the opportunity. |
| Stage | Current phase of the opportunity in the sales pipeline. |
| Fiscal Period | Financial period (month/quarter/year) associated with the opportunity. |
| Amount | Expected revenue value of the opportunity. |
| Probability | Likelihood (in %) of the opportunity being successfully closed. |
| Age | Number of days since the opportunity was created. |
| Close Date | Expected or actual date when the opportunity will be closed. |
| Created Date | Date when the opportunity record was created. |
| Lead Source | Origin from which the opportunity was generated (e.g., Web, Referral). |
| Type | Category of the opportunity (e.g., New Business, Existing Customer). |
━━━━━━━━━━━━━━━━━━━━━━━━━━━━━━━━━━━━━━━━━━━━━━━━━━━━━━━━━━━━━━━━━━━━━━━━━━━━━━━━━━━━━
🦈 Shark Tank Dashboard Reports
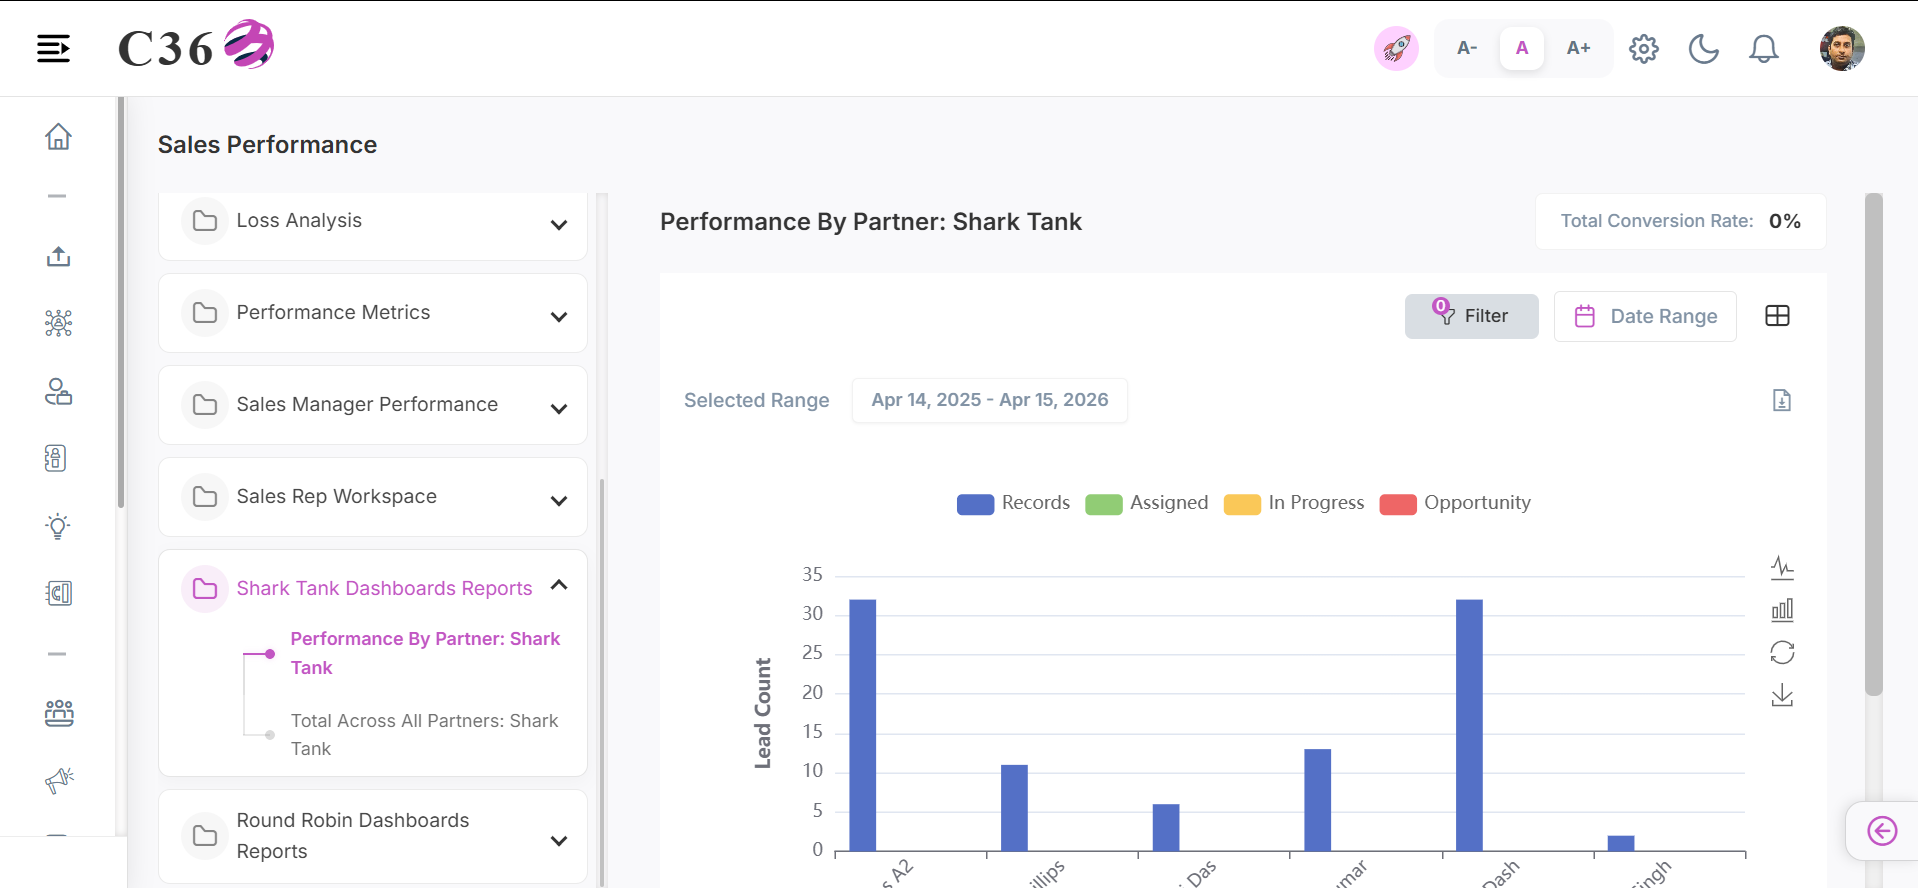
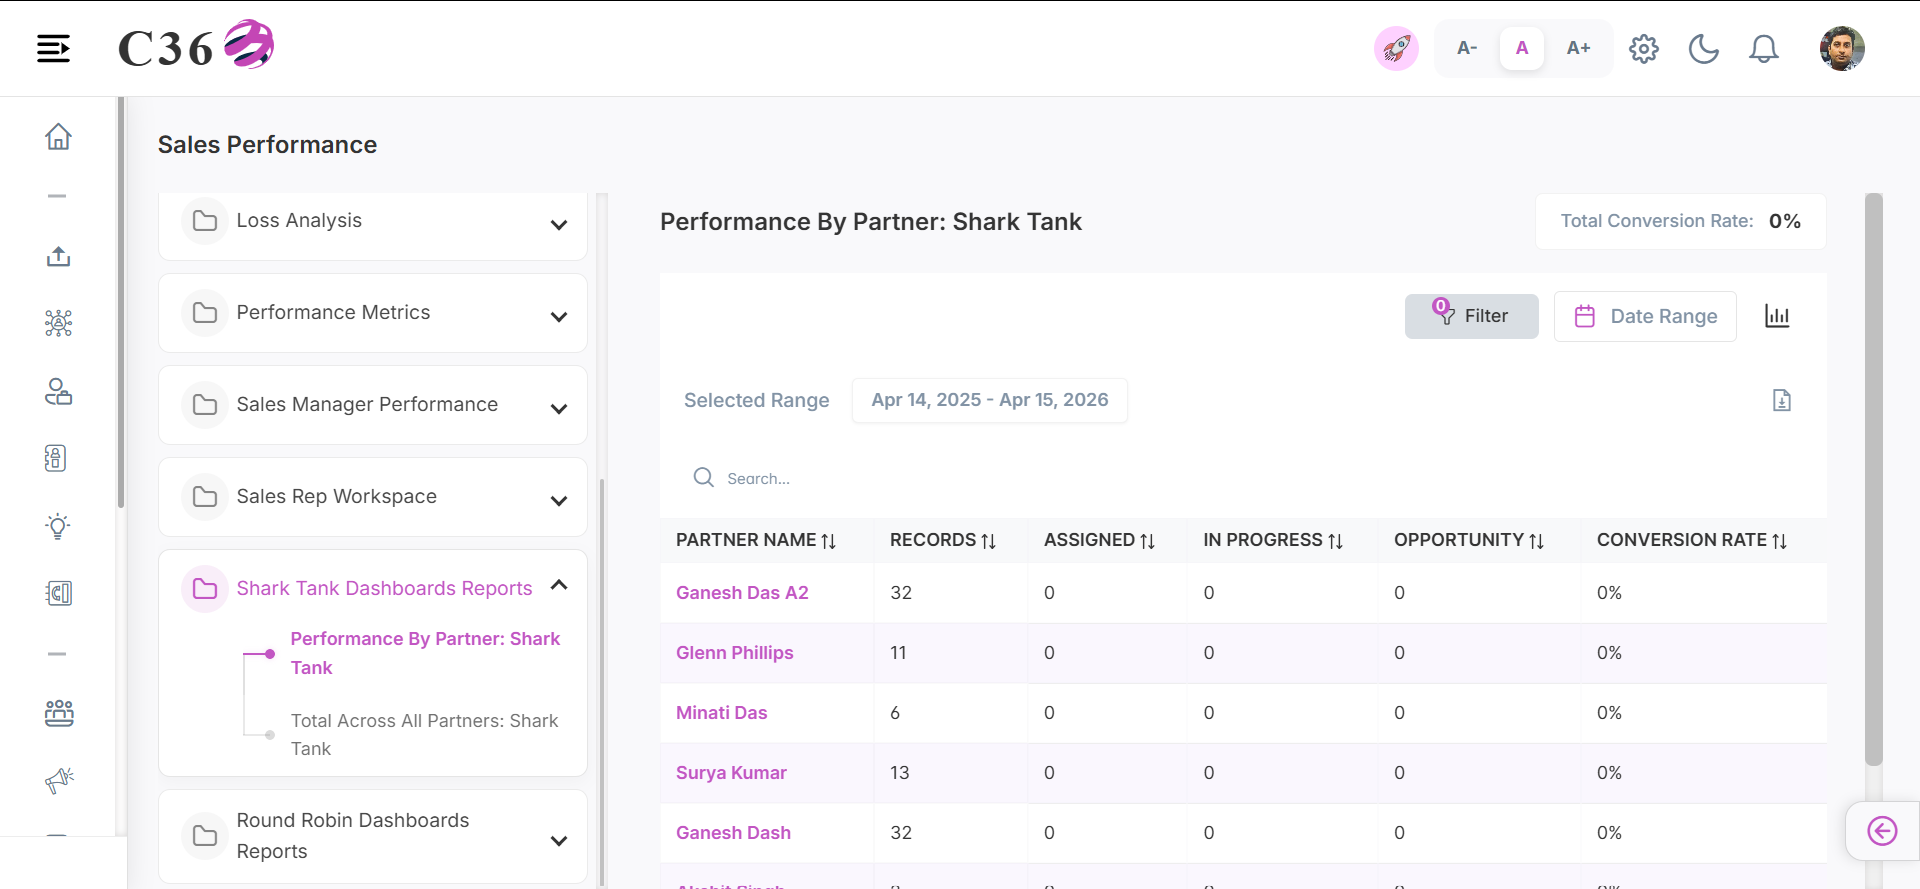
🤝 Performance By Partner: Shark Tank
Evaluates collaborative sales performance metrics specific to the Shark Tank routing structure.
- 📊 Chart View
- 📋 Table View
Click to see quick actions
- Can Toggle between Table view and Chart view. - Can Filter the chart by selecting and unselecting the color buttons. - Can Export/Download the report.
- Can Filter by Date Range. - Can Filter by Country, Company and Users. - Toggle between Line chart and Bar chart. - Save the Chart as an image. - Can Restore the bar chart.
Click to see quick actions
- Can Toggle between Table view and Chart view. - Can Export/Download the report. - Can Filter by Date Range. - Can Filter by Country, Company and Users.
🧾 Columns included in the table view
| Field Name | Description |
|---|---|
| Partner Name | Name of the partner associated with opportunities or records. |
| Records | Total number of records linked to the partner. |
| Assigned | Number of records assigned to the partner. |
| In Progress | Number of records currently being worked on by the partner. |
| Opportunity | Total number of opportunities generated by the partner. |
| Conversion Rate | Percentage of opportunities converted into successful deals by the partner. |
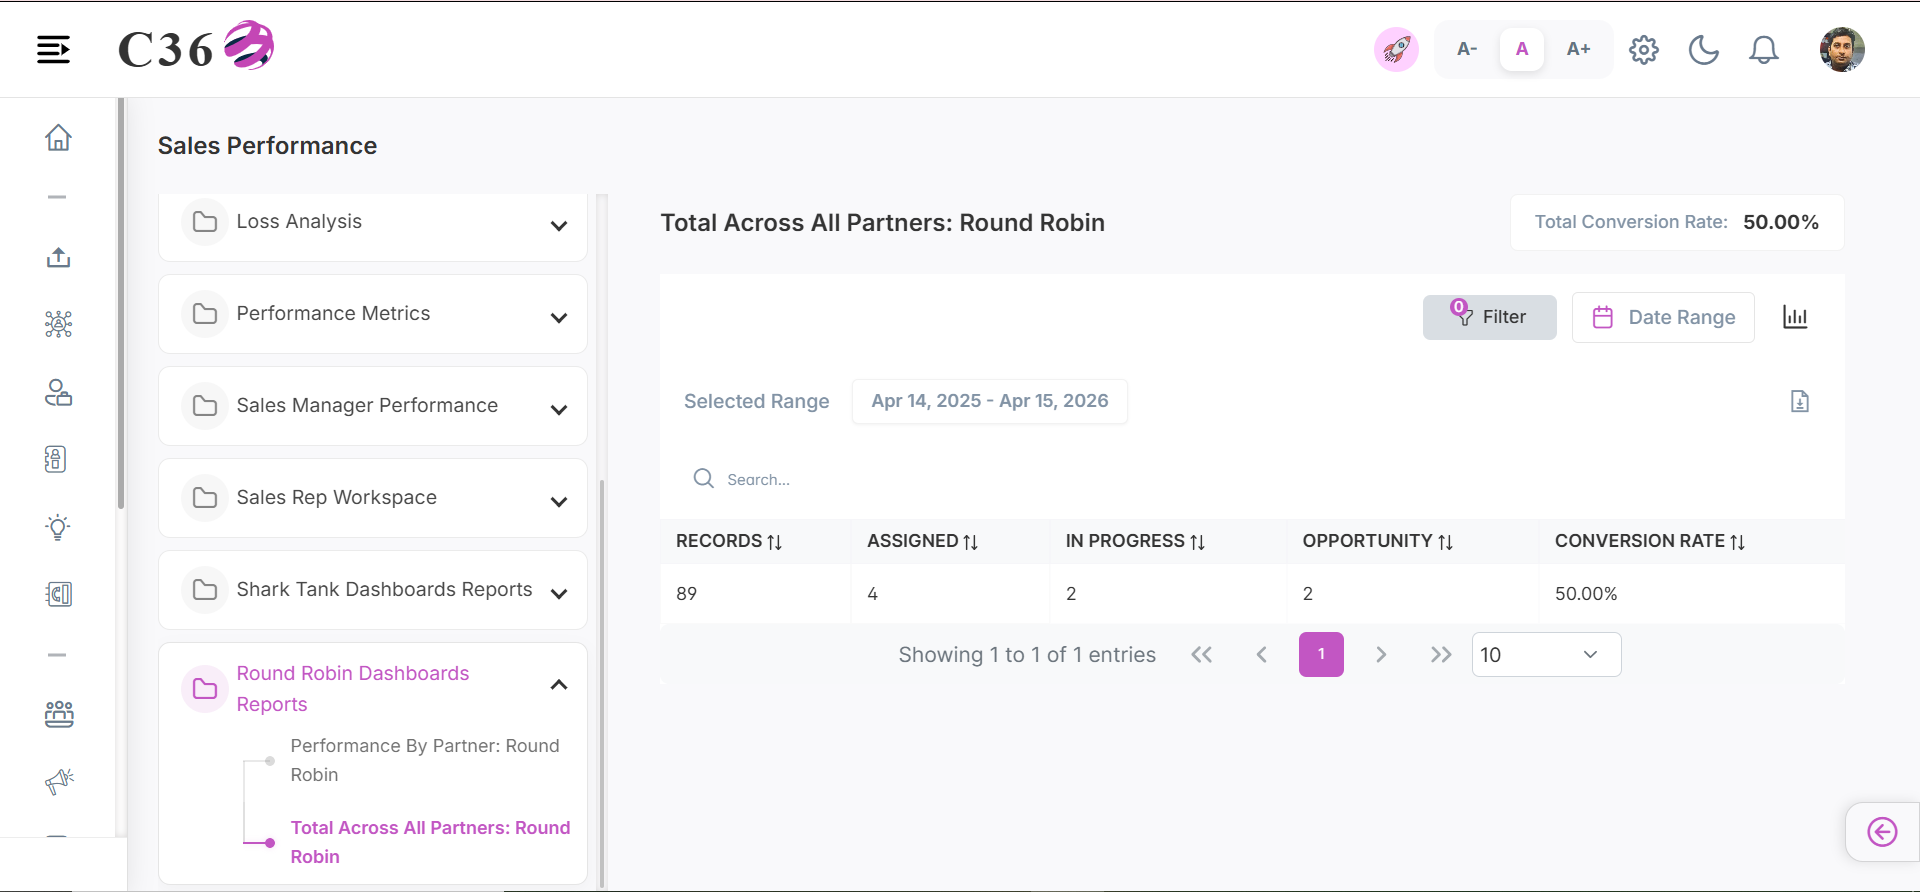
🌐 Total Across All Partners: Shark Tank
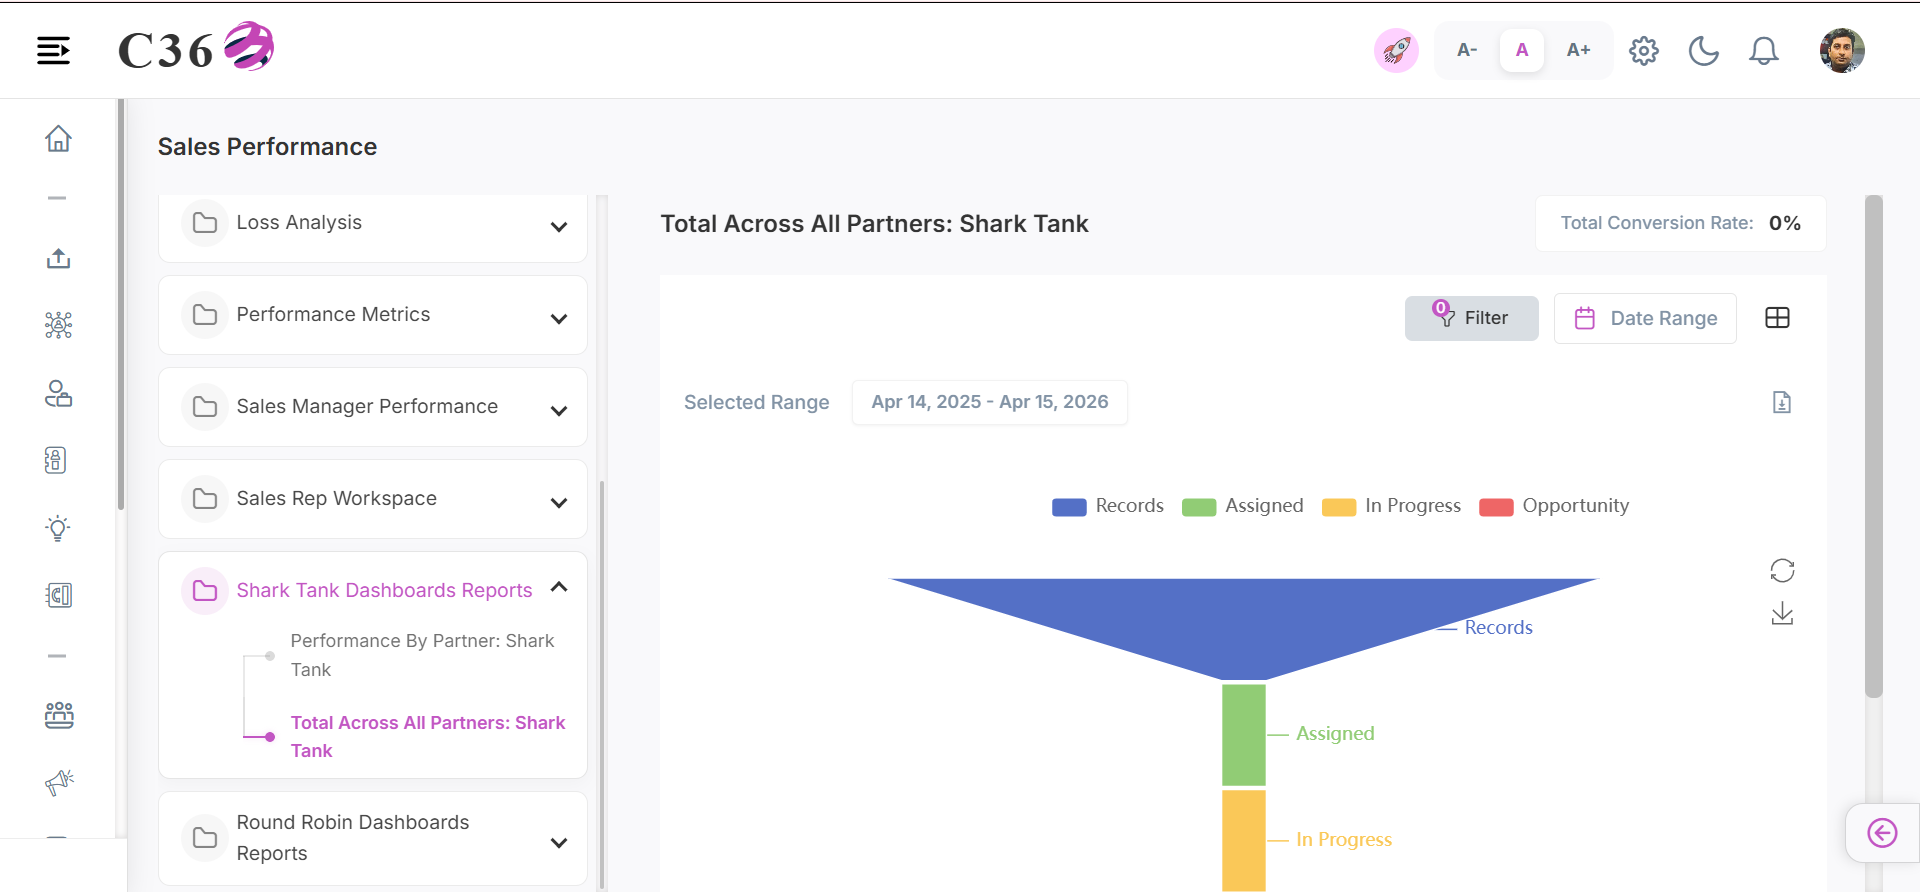
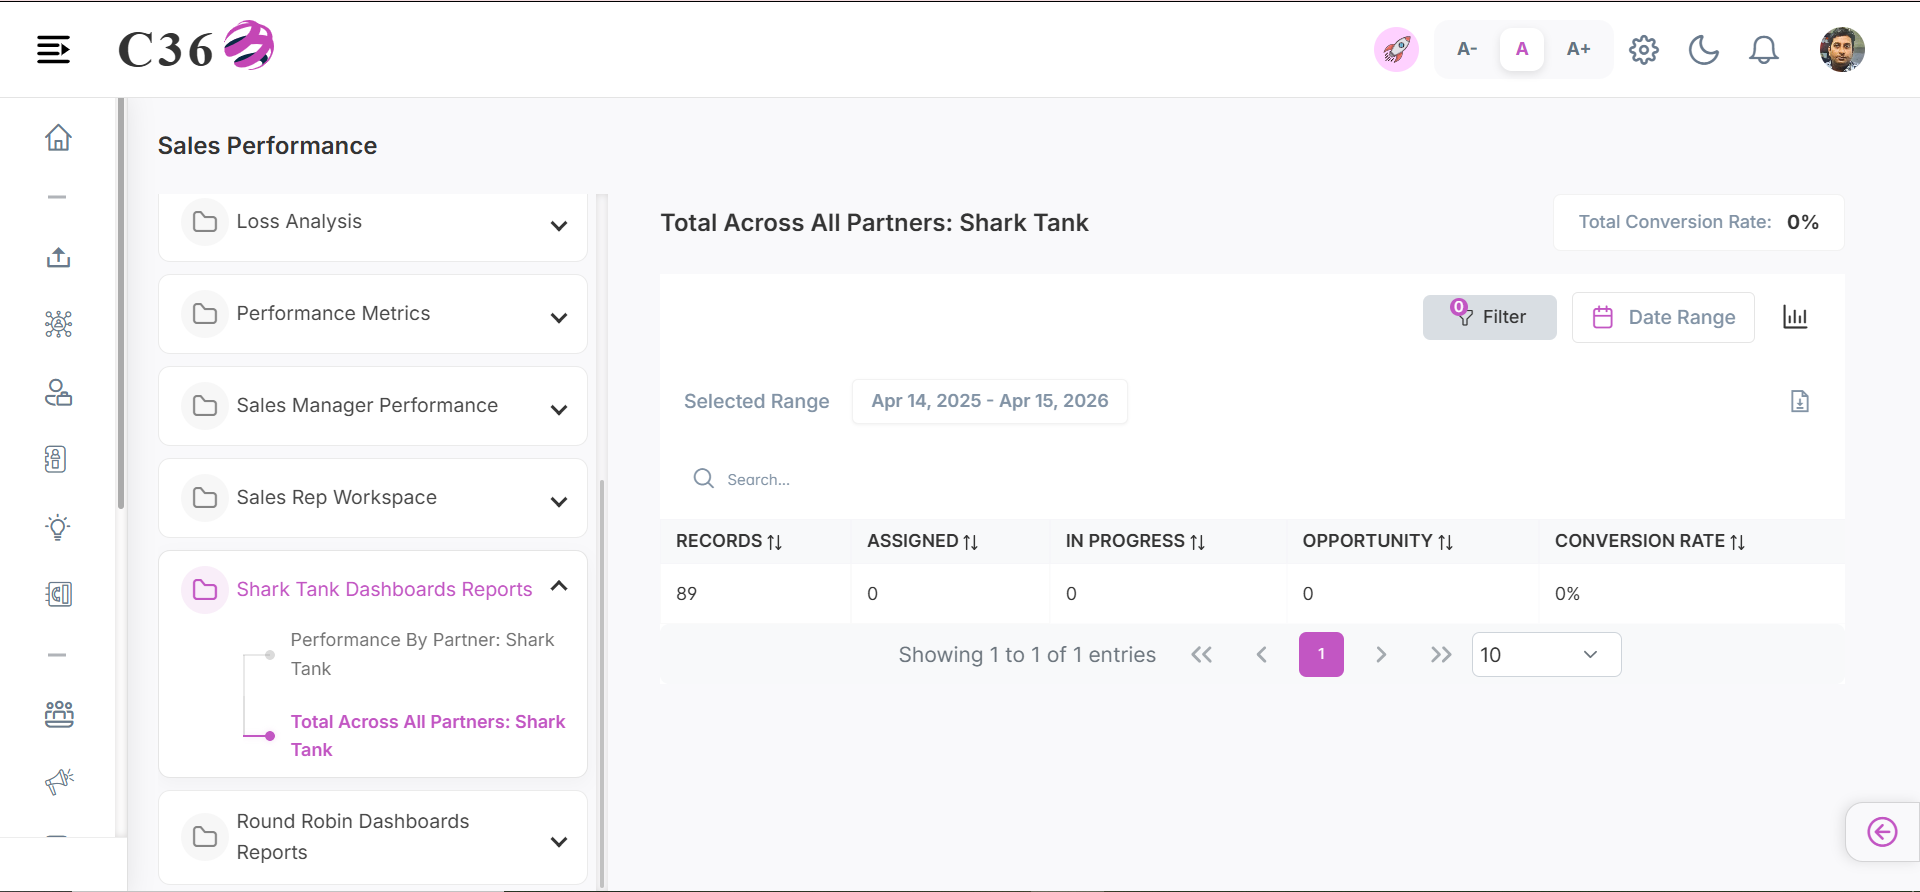
Aggregates performance data collectively across all partners within the Shark Tank model.
- 📊 Chart View
- 📋 Table View
Click to see quick actions
- Can Toggle between Table view and Chart view. - Can filter the funnel by selecting or unselecting the color buttons. - Can restore the bar chart. - Save the chart as an image. - Can Export/Download the report. - Can Filter by Date Range. - Can Filter by Country, Company and Users.
Click to see quick actions
- Can Toggle between Table view and Chart view. - Can Export/Download the report. - Can perform search in the table view. - Can Filter by Date Range. - Can Filter by Country, Company and Users.
🧾 Columns included in the table view
| Field Name | Description |
|---|---|
| Records | Total number of records linked to the partner. |
| Assigned | Number of records assigned to the partner. |
| In Progress | Number of records currently being worked on by the partner. |
| Opportunity | Total number of opportunities generated by the partner. |
| Conversion Rate | Percentage of opportunities converted into successful deals by the partner. |
━━━━━━━━━━━━━━━━━━━━━━━━━━━━━━━━━━━━━━━━━━━━━━━━━━━━━━━━━━━━━━━━━━━━━━━━━━━━━━━━━━━━━
🔄 Round Robin Dashboard Reports
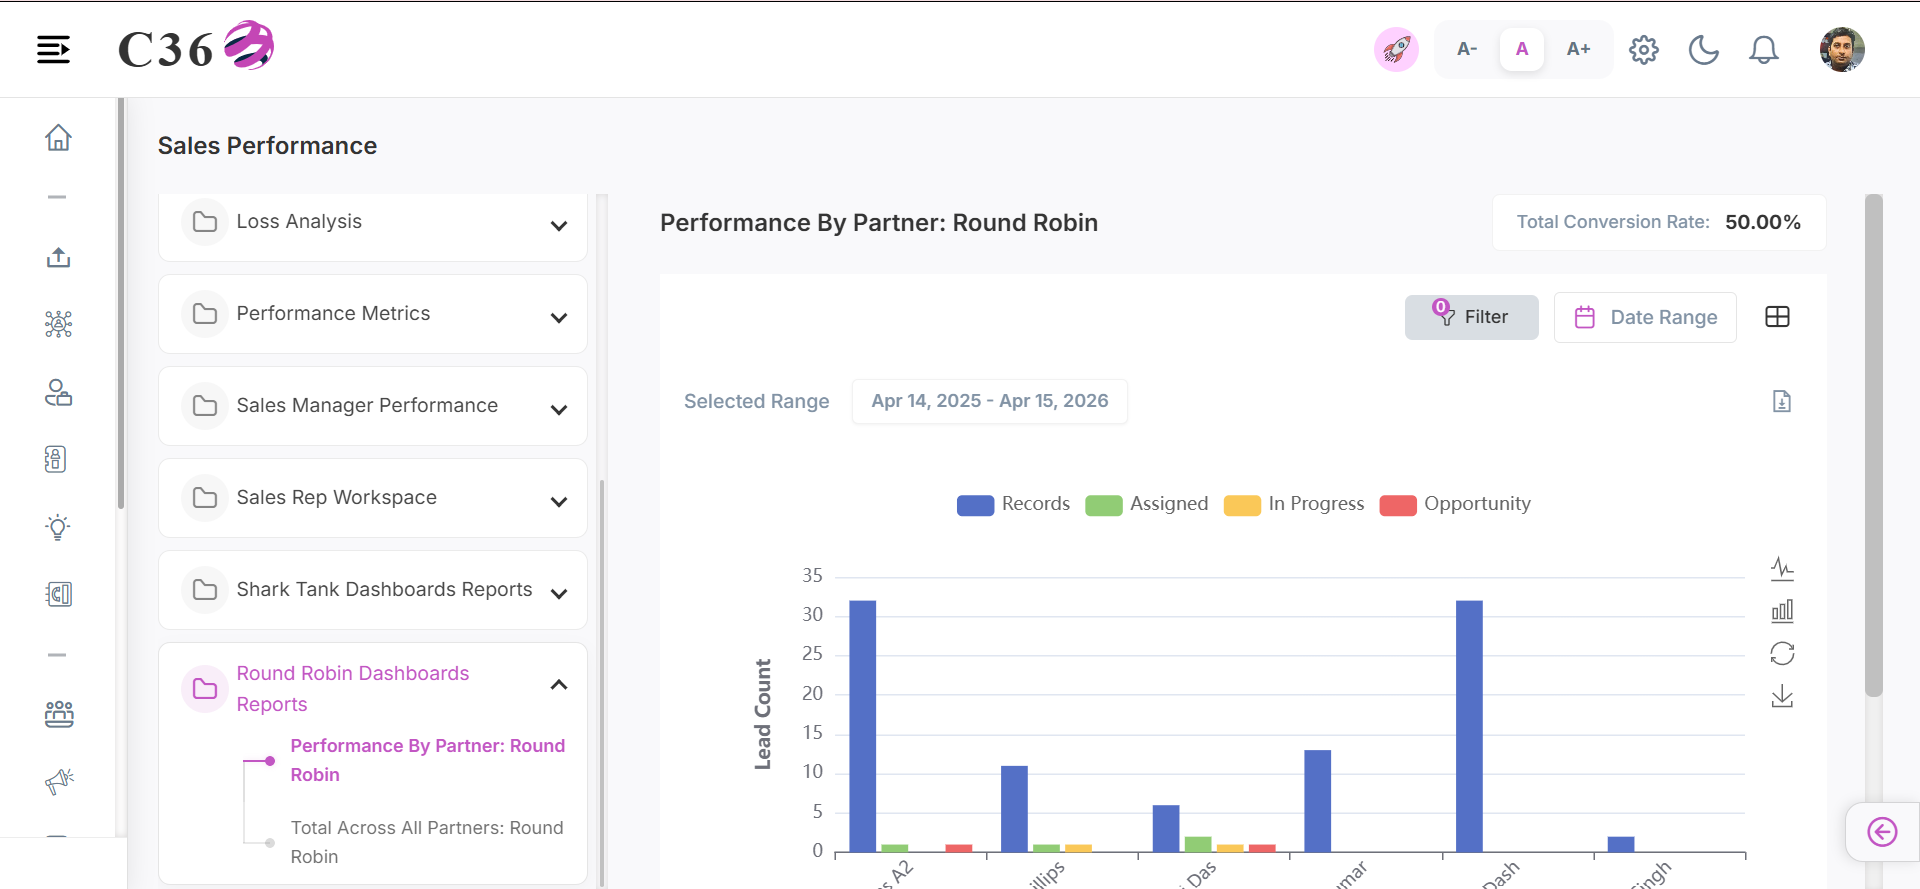
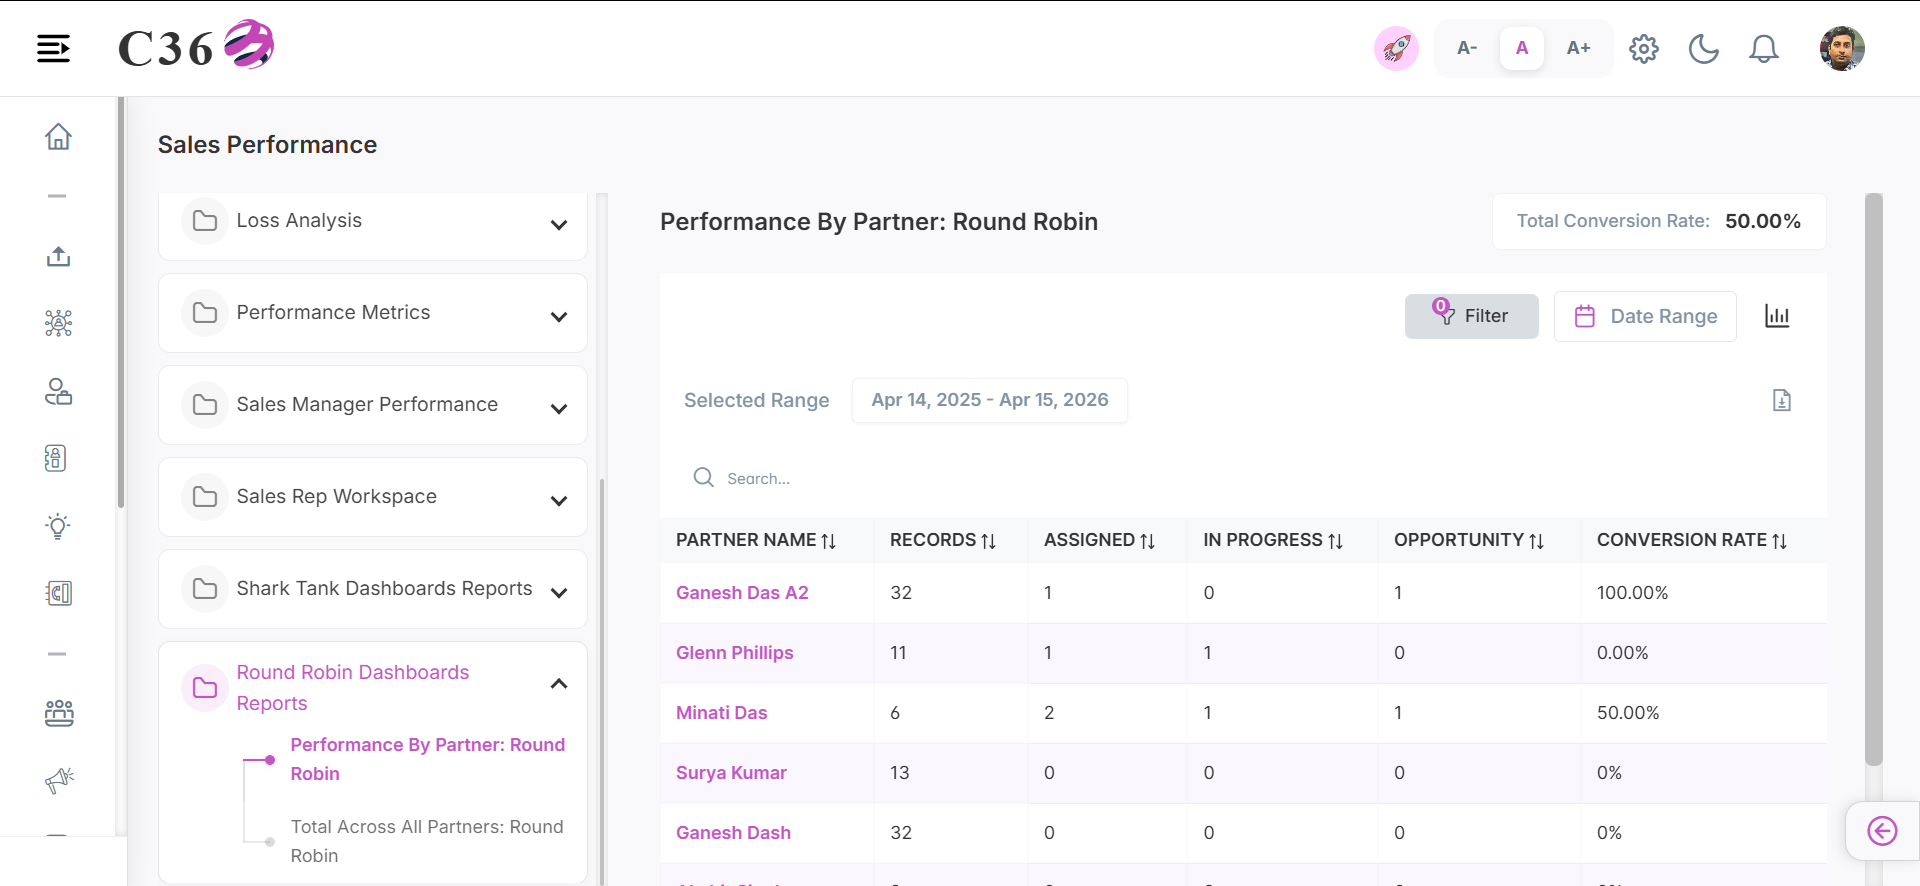
🤝 Performance By Partner: Round Robin
Appraises partner performance levels managed under the Round Robin distribution system.
- 📊 Chart View
- 📋 Table View
Click to see quick actions
- Can Toggle between Table view and Chart view. - Can Filter the chart by selecting and unselecting the color buttons. - Can Export/Download the report.
- Can Filter by Date Range. - Can Filter by Country, Company and Users. - Toggle between Line chart and Bar chart. - Save the Chart as an image. - Can Restore the bar chart.
Click to see quick actions
- Can Toggle between Table view and Chart view. - Can Export/Download the report. - Can perform search in the table view. - Can Filter by Date Range. - Can Filter by Country, Company and Users.
🧾 Columns included in the table view
| Field Name | Description |
|---|---|
| Partner Name | Name of the partner receiving records through round robin distribution. |
| Records | Total number of records distributed to the partner. |
| Assigned | Number of records assigned to the partner via round robin. |
| In Progress | Number of records currently being worked on by the partner. |
| Opportunity | Total number of opportunities generated from assigned records. |
| Conversion Rate | Percentage of opportunities converted into successful deals by the partner. |
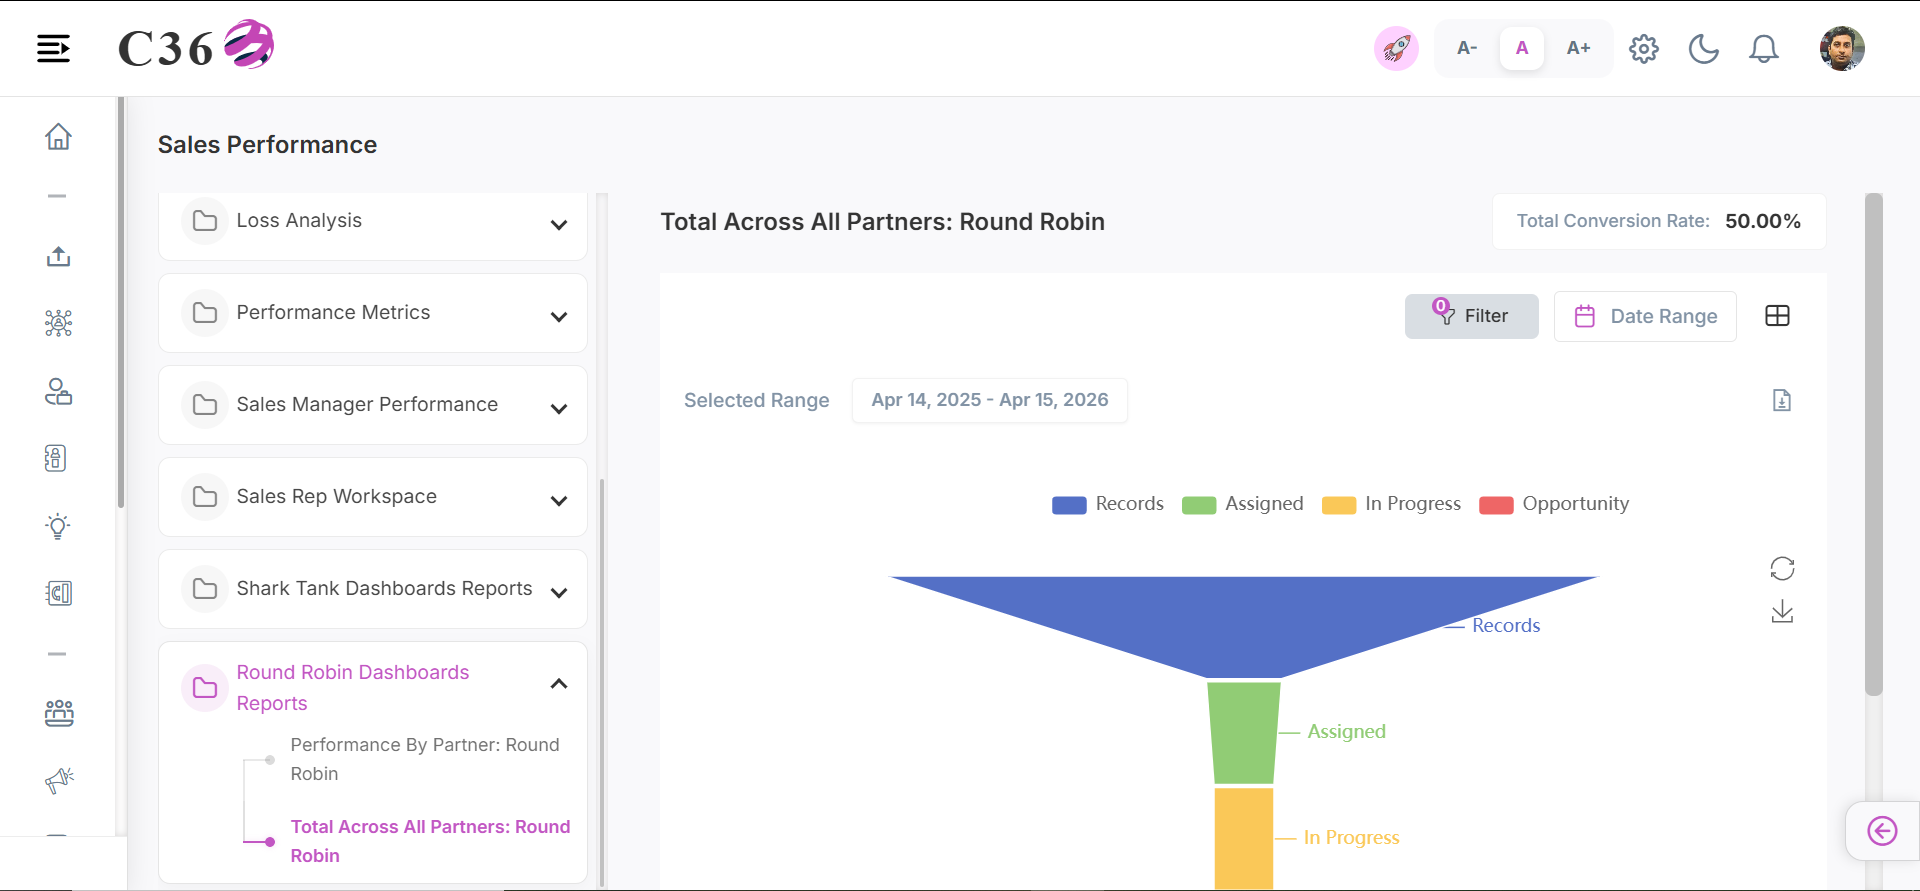
🌐 Total Across All Partners: Round Robin
Summarizes comprehensive performance metrics of all partners within the Round Robin framework.
- 📊 Chart View
- 📋 Table View
Click to see quick actions
- Can Toggle between Table view and Chart view. - Can filter the funnel by selecting or unselecting the color buttons. - Can restore the bar chart. - Save the chart as an image. - Can Export/Download the report. - Can Filter by Date Range. - Can Filter by Country, Company and Users.
Click to see quick actions
- Can Toggle between Table view and Chart view. - Can Export/Download the report. - Can perform search in the table view. - Can Filter by Date Range. - Can Filter by Country, Company and Users.
🧾 Columns included in the table view
| Field Name | Description |
|---|---|
| Records | Total number of records distributed to the partner. |
| Assigned | Number of records assigned to the partner via round robin. |
| In Progress | Number of records currently being worked on by the partner. |
| Opportunity | Total number of opportunities generated from assigned records. |
| Conversion Rate | Percentage of opportunities converted into successful deals by the partner. |