📢 Marketing Report
The Marketing section in C360 provides access to detailed marketing reports and campaign insights.
To access it:
➡️ Go to Analytics → Reports → Marketing Report from the left-hand menu.
- By default, reports are displayed with a date range of one year back from today.
━━━━━━━━━━━━━━━━━━━━━━━━━━━━━━━━━━━━━━━━━━━━━━━━━━━━━━━━━━━━━━━━━━━━━━━━━━━━━━━━━━━━━
🧰 Filters
- 📅 Date Range Filter
- 🎛️ Respective Filters
Date Range Filter – Selects a specific time period for analysis.
Respective Filters – Filters data by Campaign, Country, Company, and Users.
- The Users filter works only when either Country or Company is selected.
- Company is disabled if Country is selected, and vice versa.
━━━━━━━━━━━━━━━━━━━━━━━━━━━━━━━━━━━━━━━━━━━━━━━━━━━━━━━━━━━━━━━━━━━━━━━━━━━━━━━━━━━━━
🗂️ Parent Campaign (Outgoing Campaigns)
A Parent Campaign is a collection of outgoing marketing activities grouped under one umbrella. It includes efforts such as emails, telemarketing, and webinars, enabling better tracking and performance analysis.
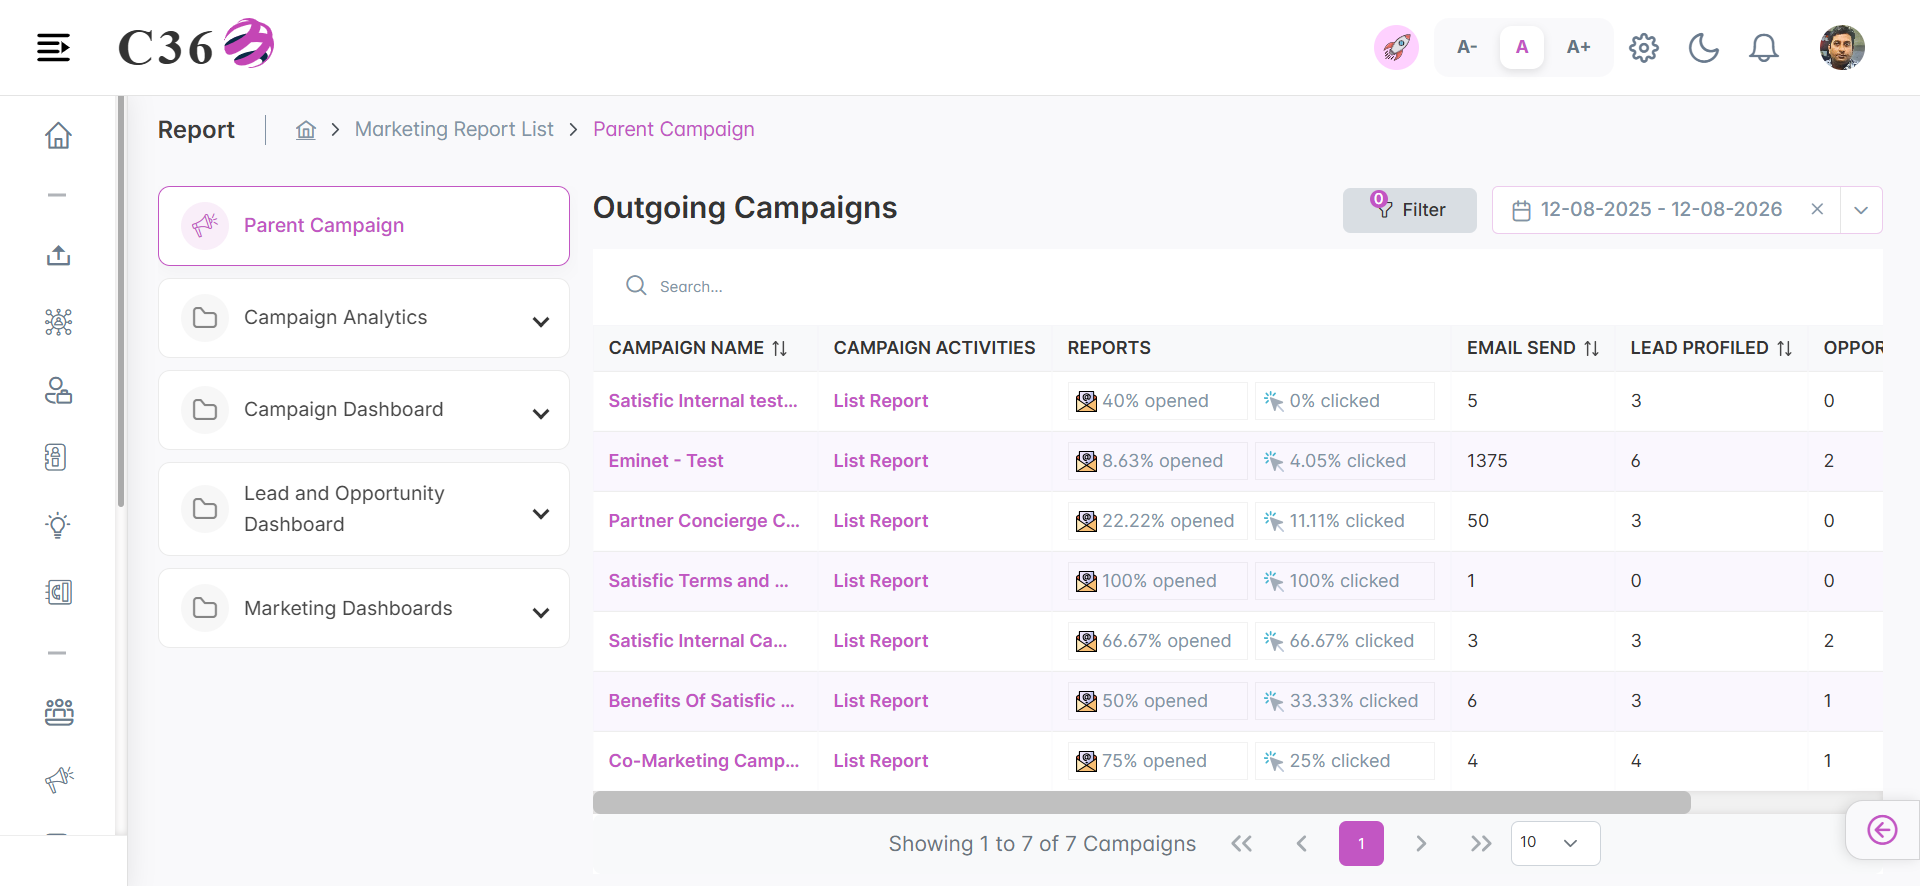
A typical Parent Campaign Table includes:
Campaign Name
Name of the outgoing campaign.
Campaign Activities
List of executed marketing efforts
Reports
Performance metrics and analysis.
Lead Profiled
Leads identified and categorized during the campaign.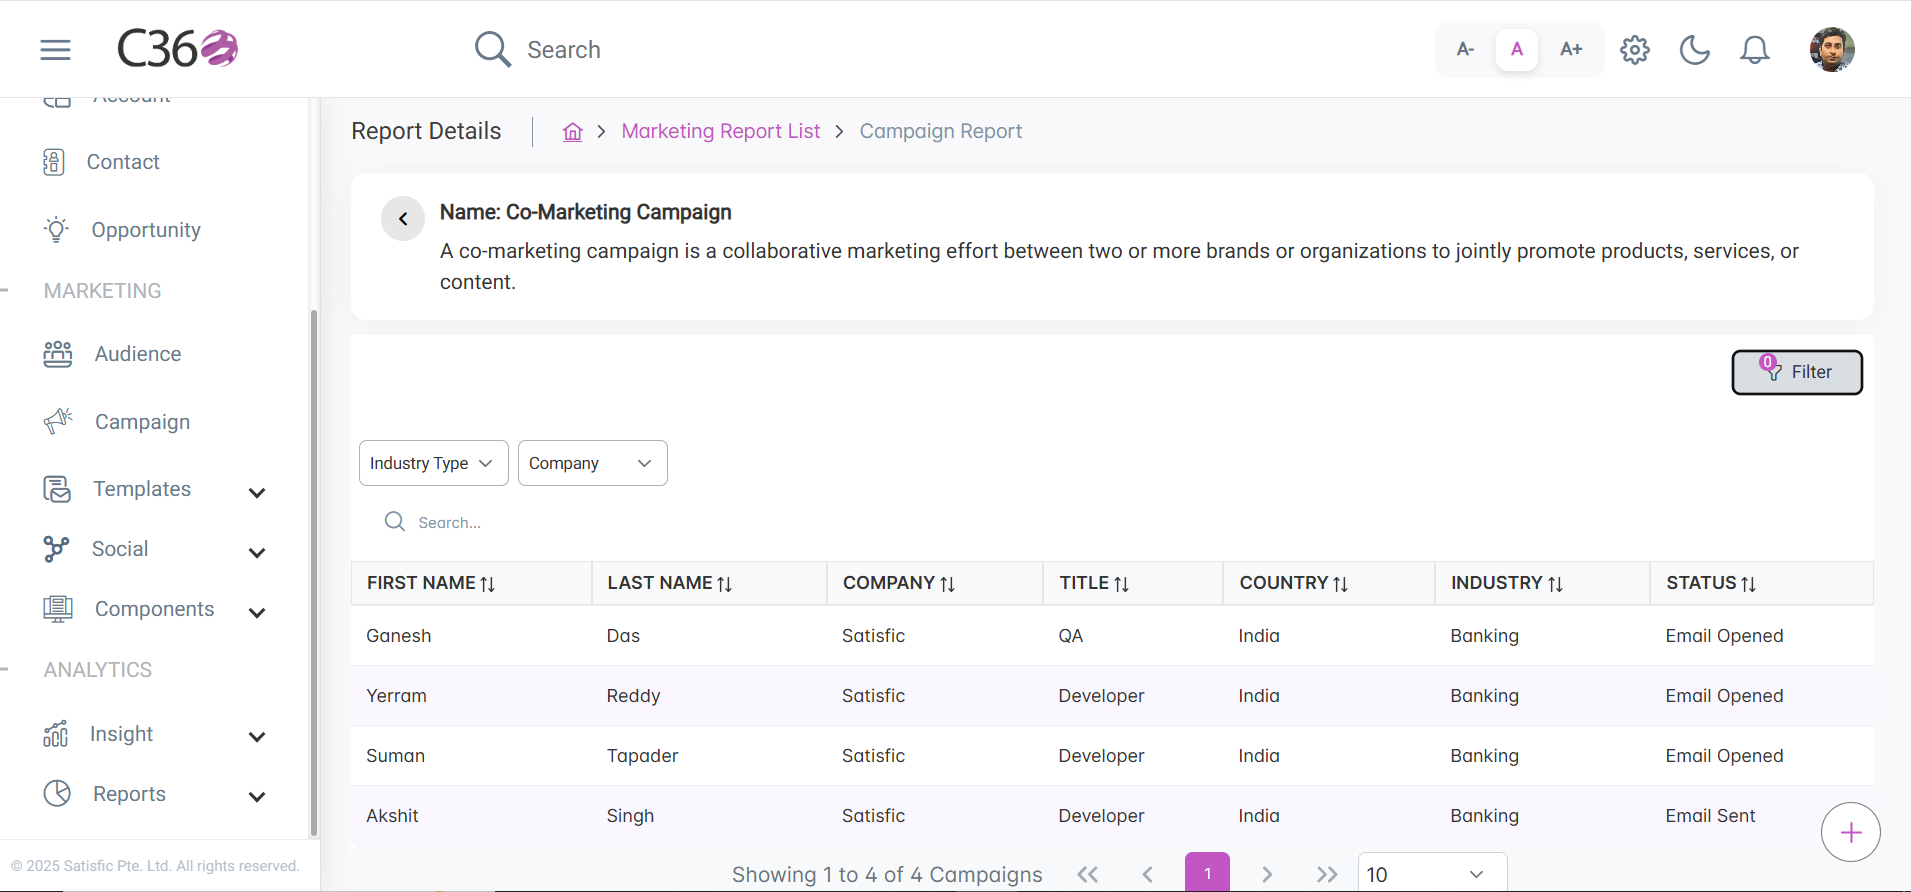
Opportunity Converted
Number of leads successfully converted into opportunities.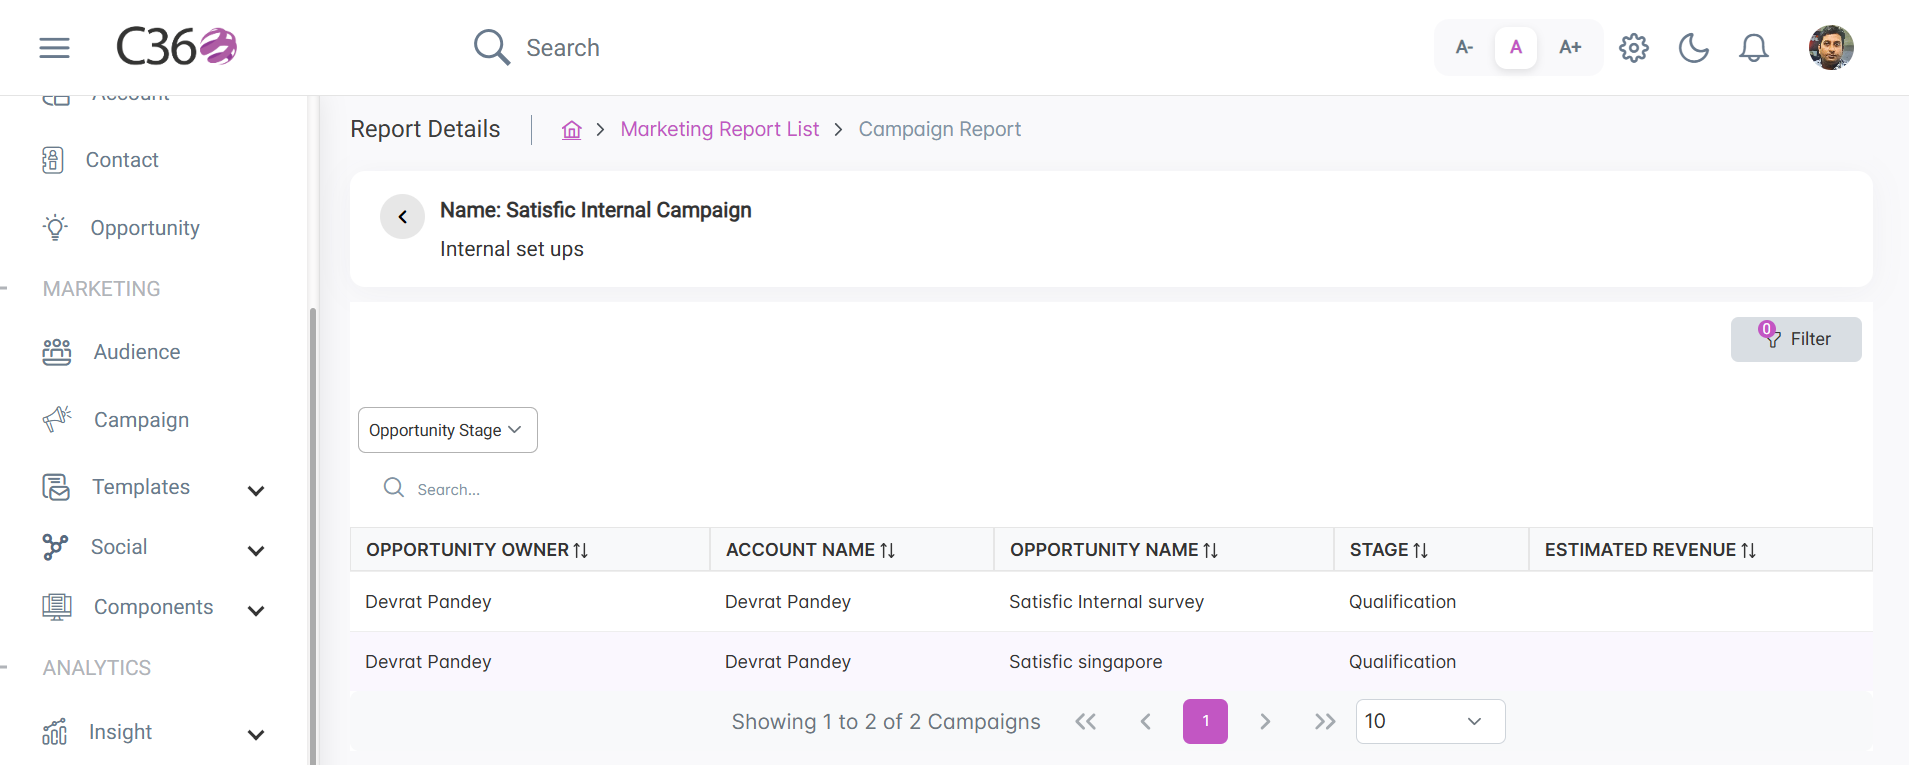
Clicking a campaign name opens the Campaign Performance Report, which includes emails sent, opened, and clicked.
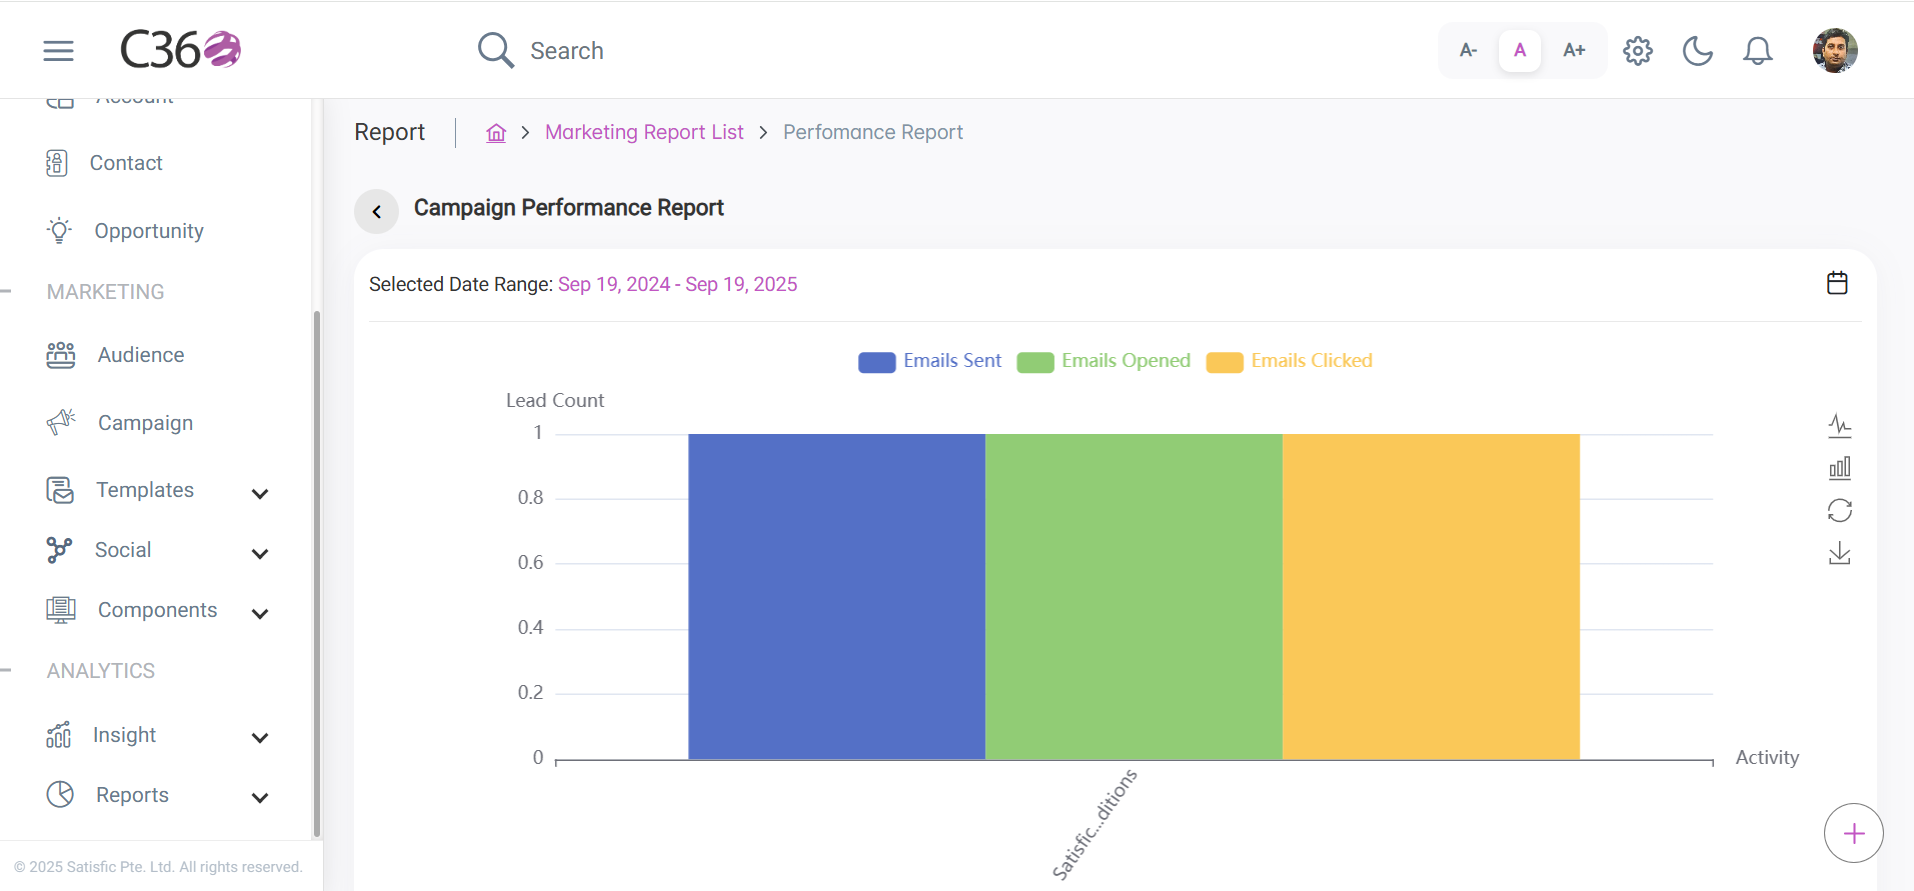
Click to see filter options for outgoing campaign
- Country
- Company
- Users (required for Country and Company filters to work)
- Campaign
- Date Range
Country and Company filters only work if a User is selected.
📤 View Outgoing Activities
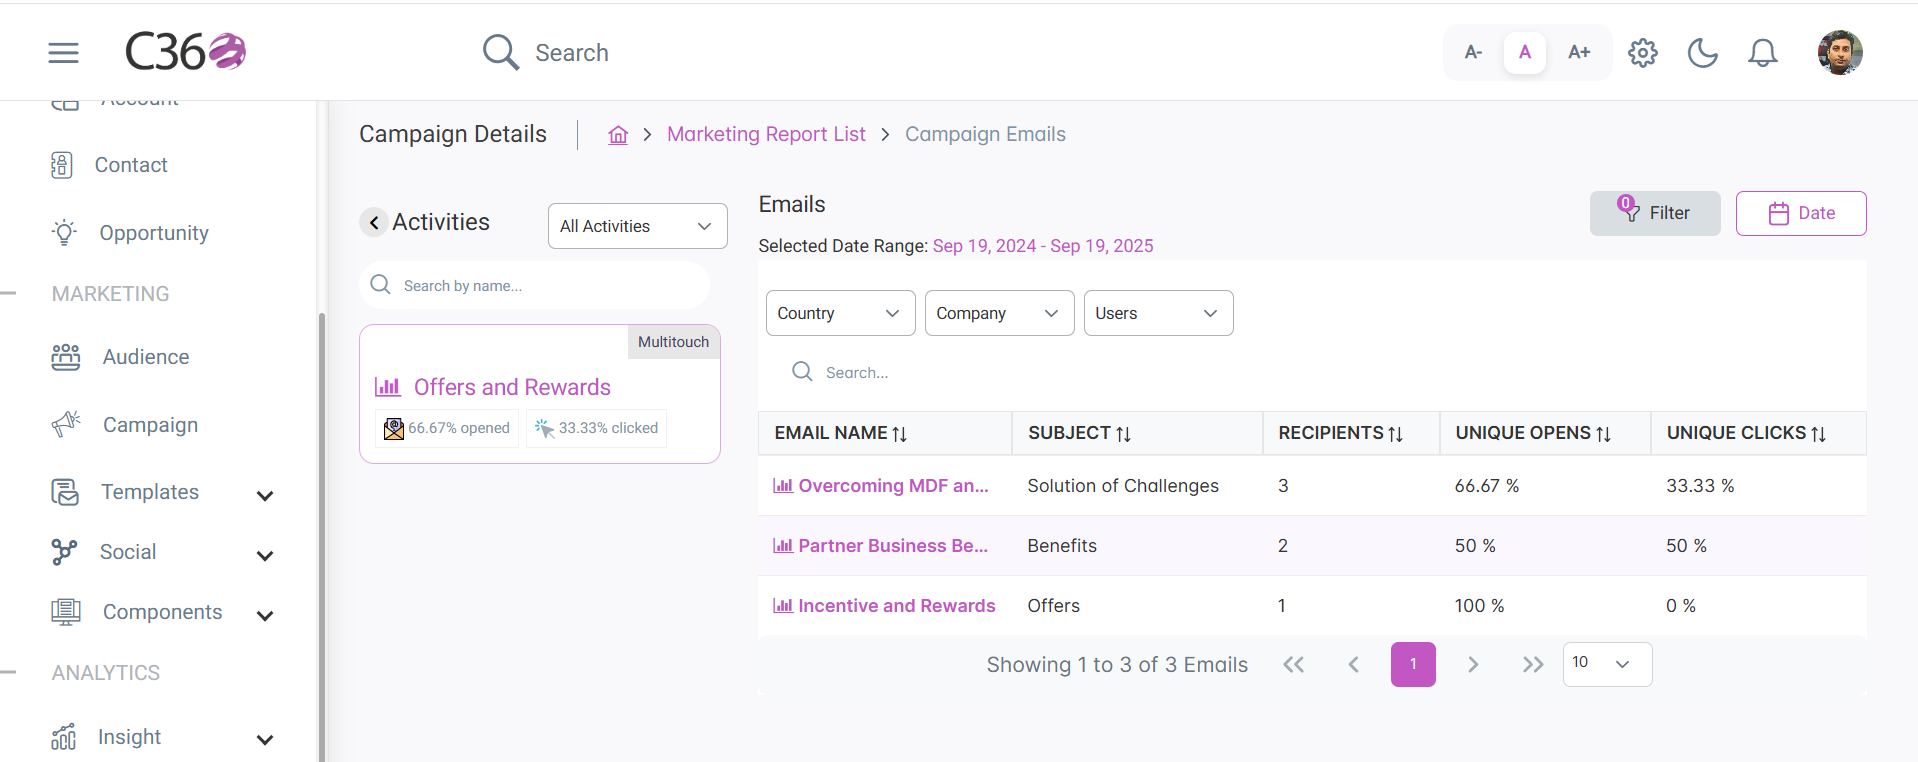
Click List Report under Campaign Activities to view the Campaign Emails page.
- The left panel displays all executed Single-Touch and Multi-Touch activities.
- The right panel shows a table with details such as Email Name, Subject, Unique Clicks, Unique Opens, and Recipients.
✉️ View Outgoing Campaign Email Details
- 📊 Overview
- ✈️ Activities
- 🔗 link clicks
- ❕ Bounce
- Summary of the campaign performance.
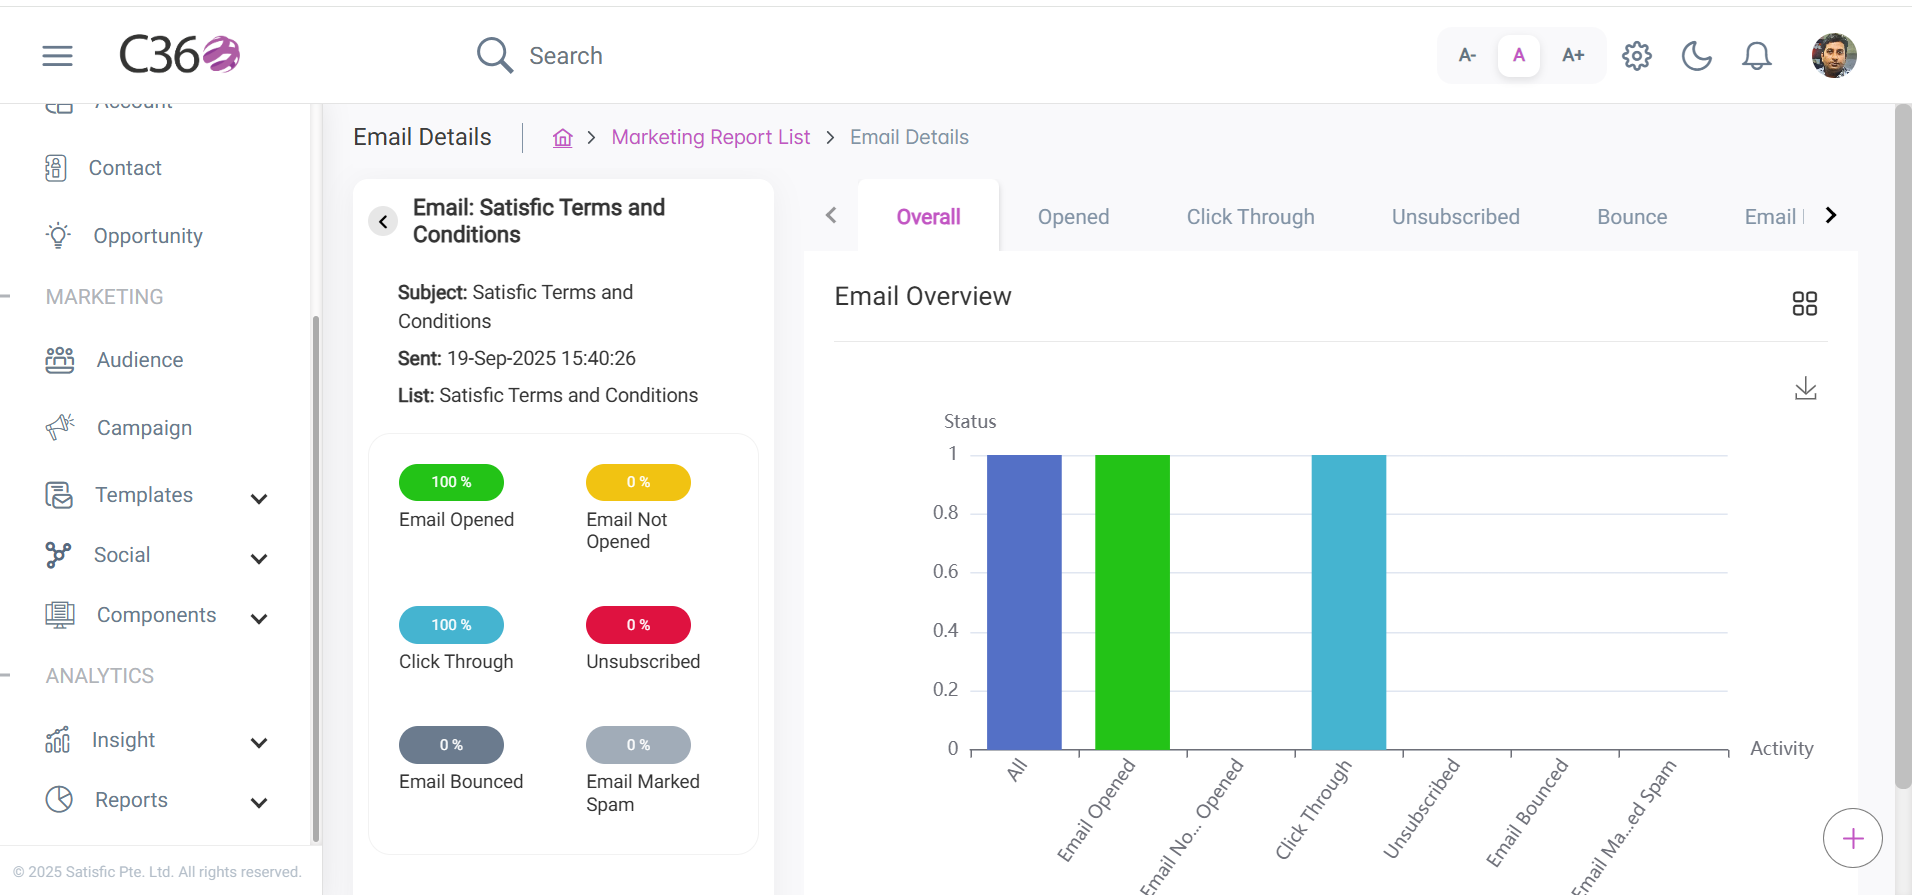
- overall activities of a campaign.
- 📤 Sent
- 📬 Delivered
- 📖 Opened
- 👁️ Open (No Click)
- 🖱️ Clicked
- 🚫 Unsubscribed
- ✉️ Unopened
- ⚠️ Spam
- 🖼️ Assets
- 🌐 Landing Pages
- 🌍 Countries
- Emails sent to total number of prospects.
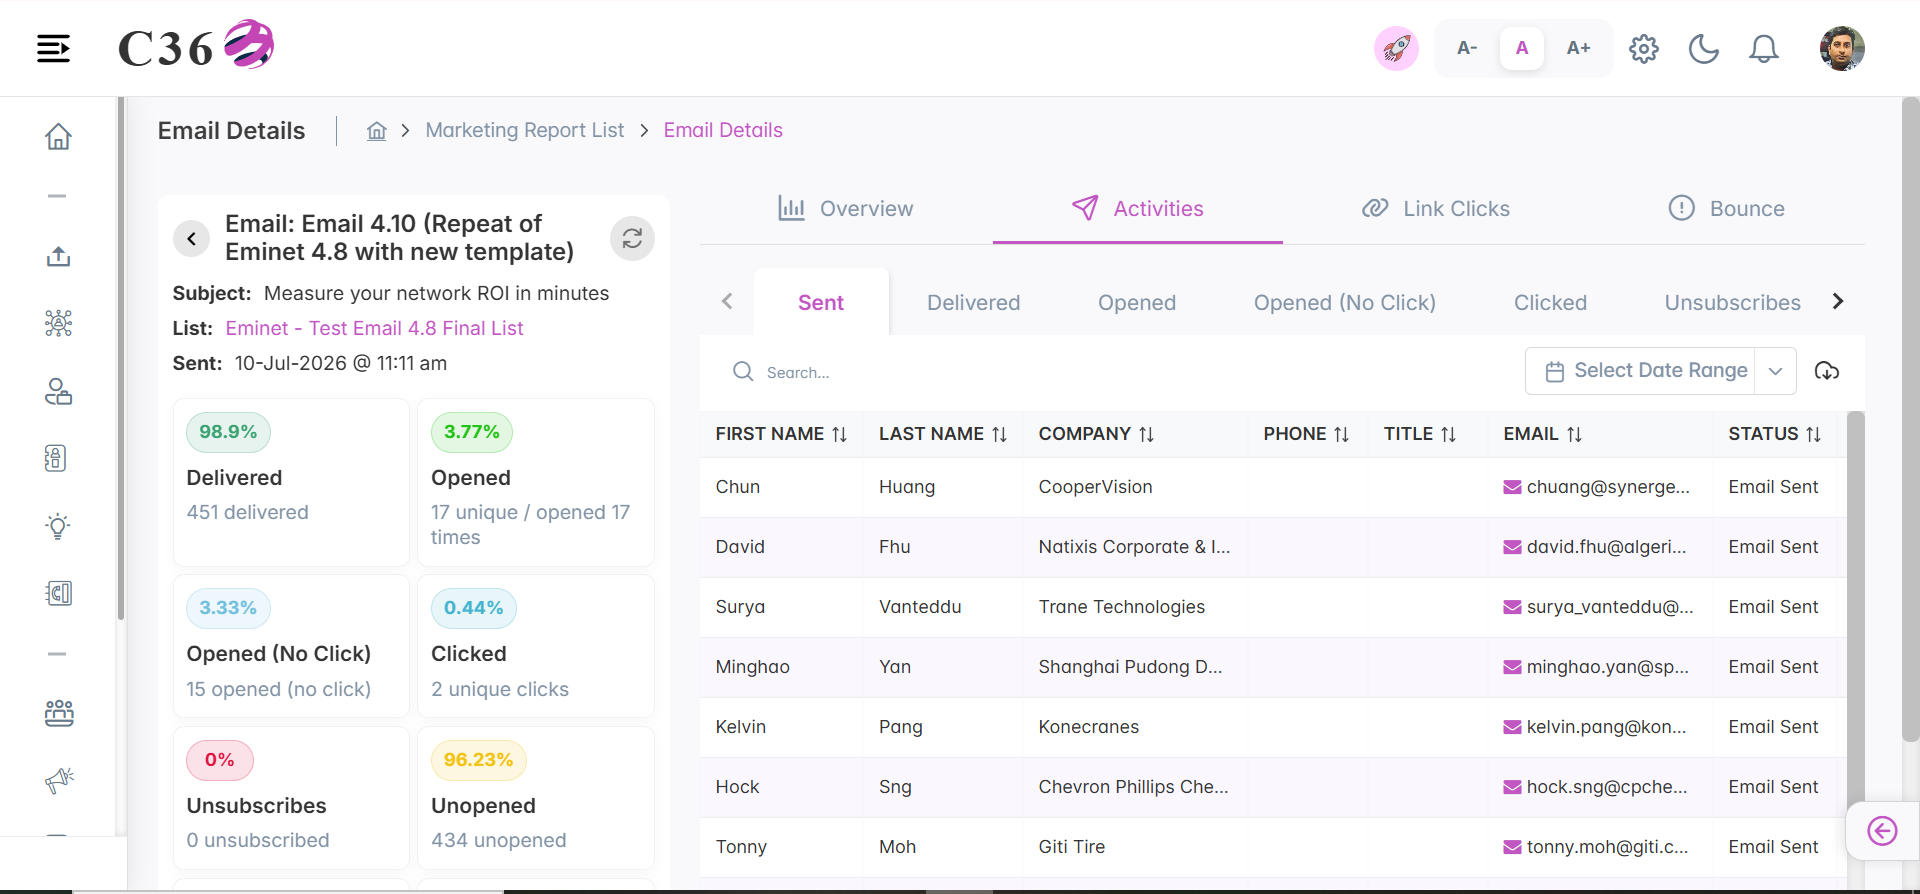
- Number of emails delivered to the prospects.
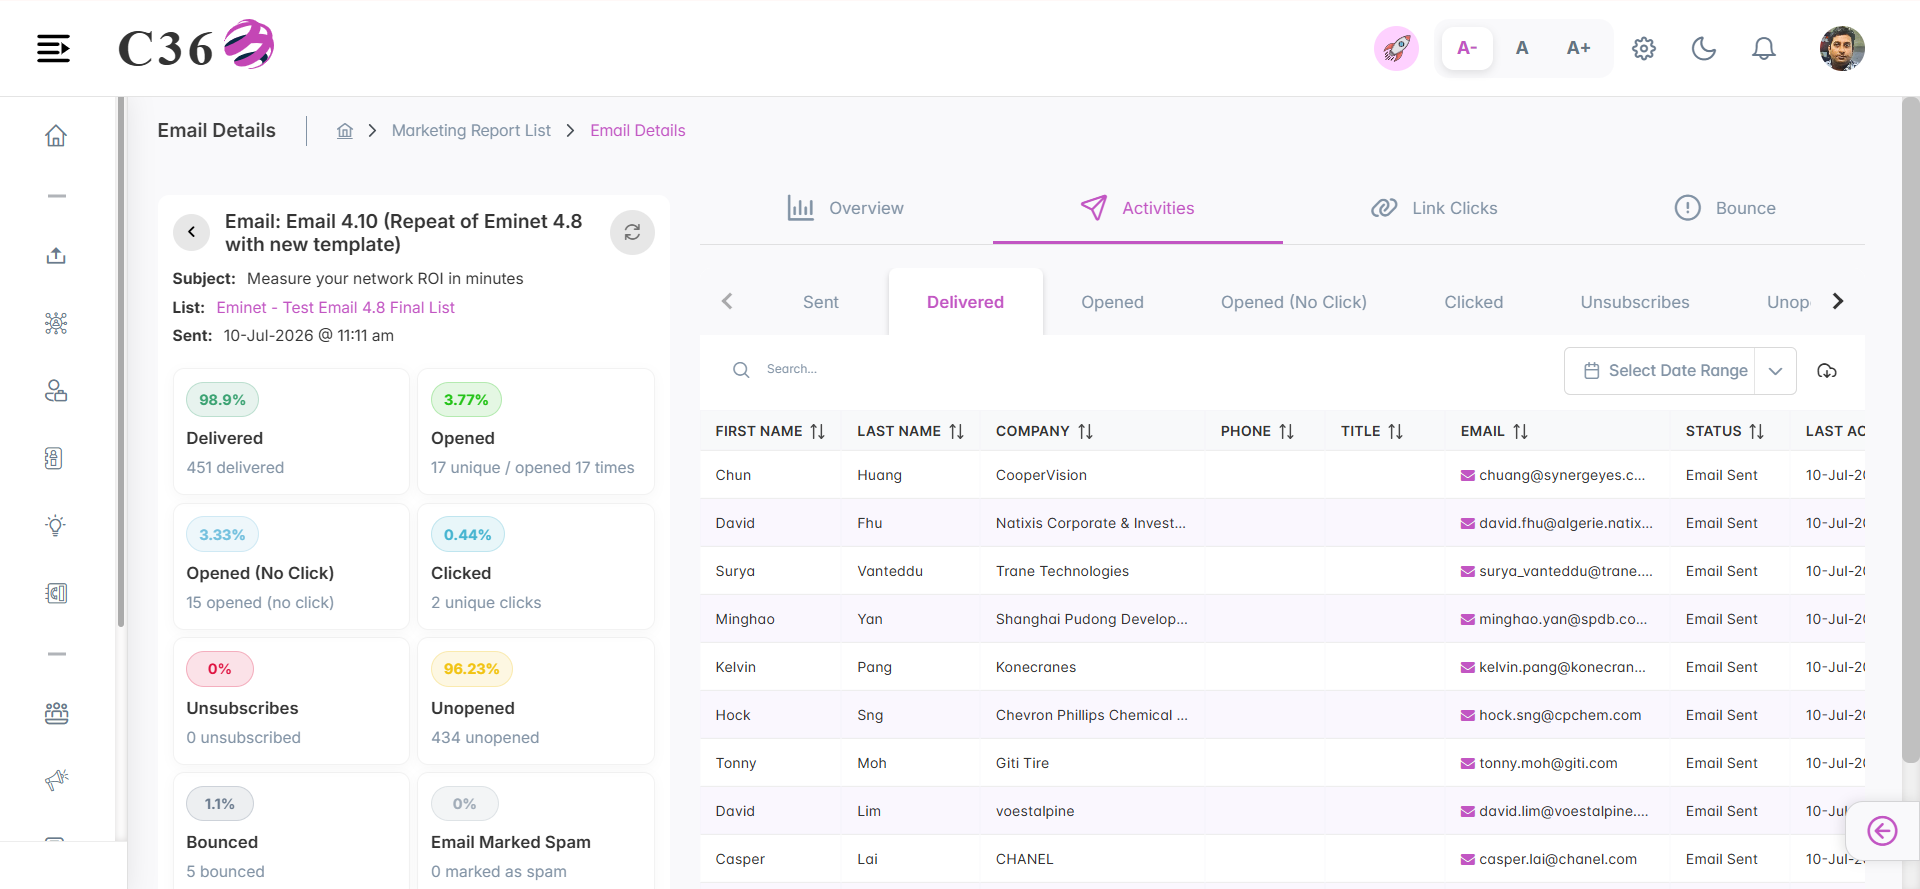
- Number of emails opened by the prospects.
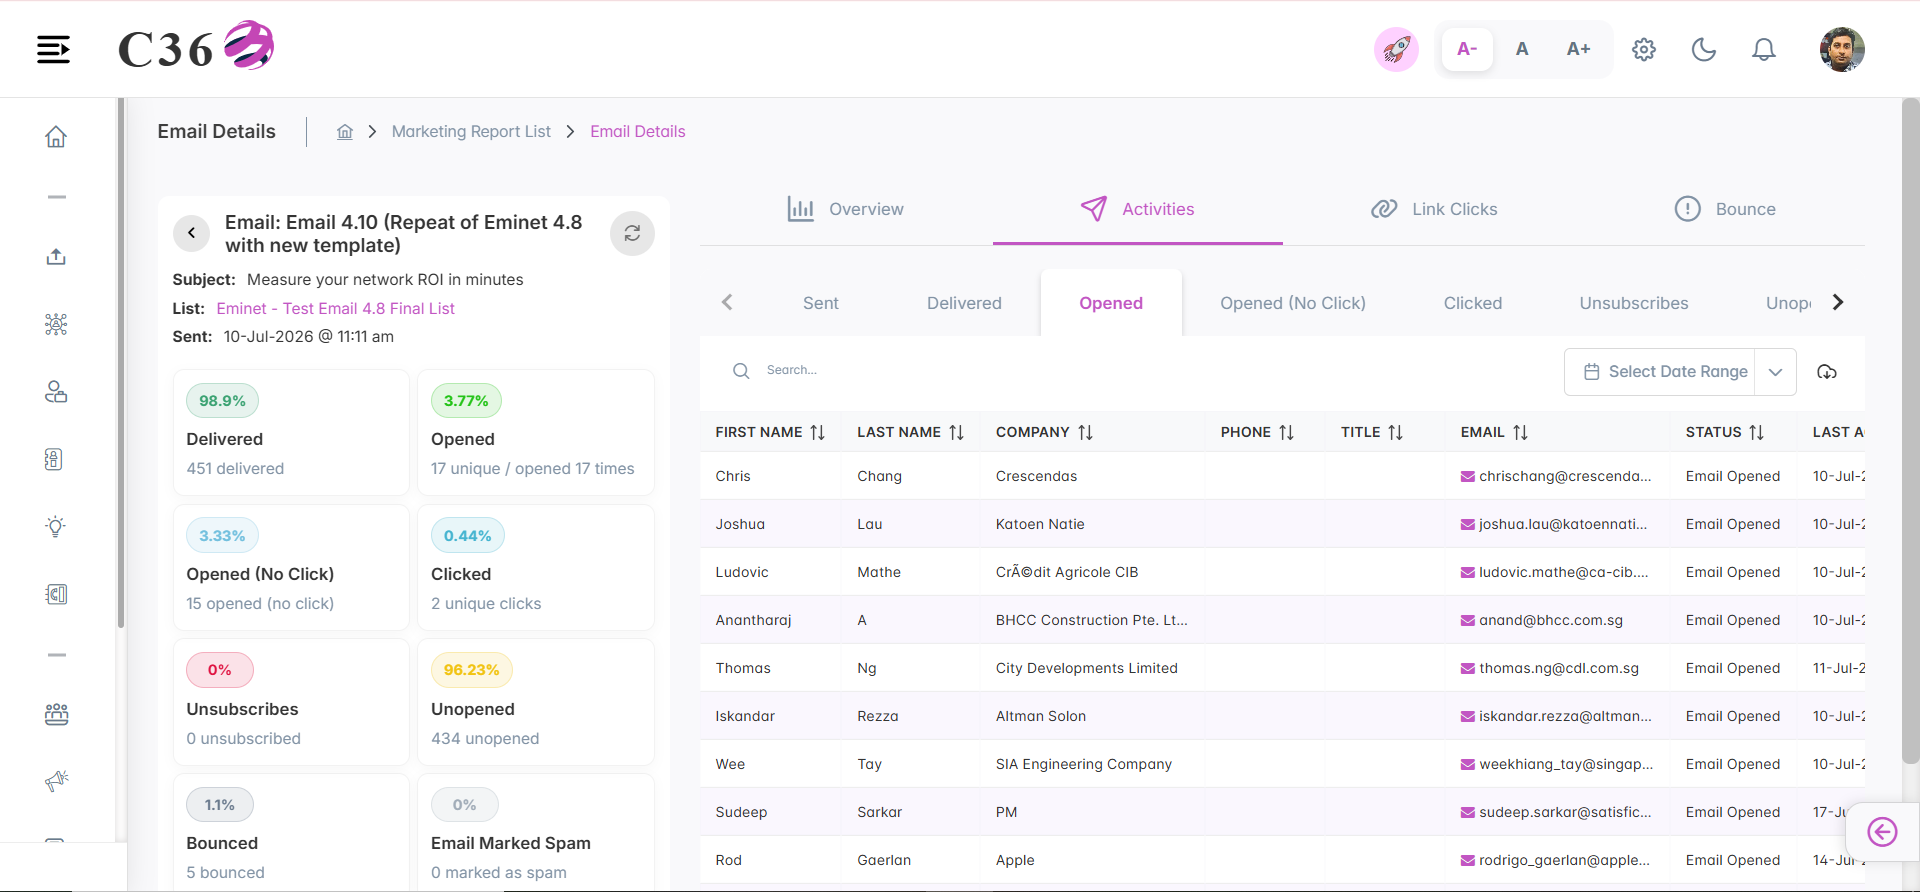
- Number of emails opened by the prospects but no click activity performed.
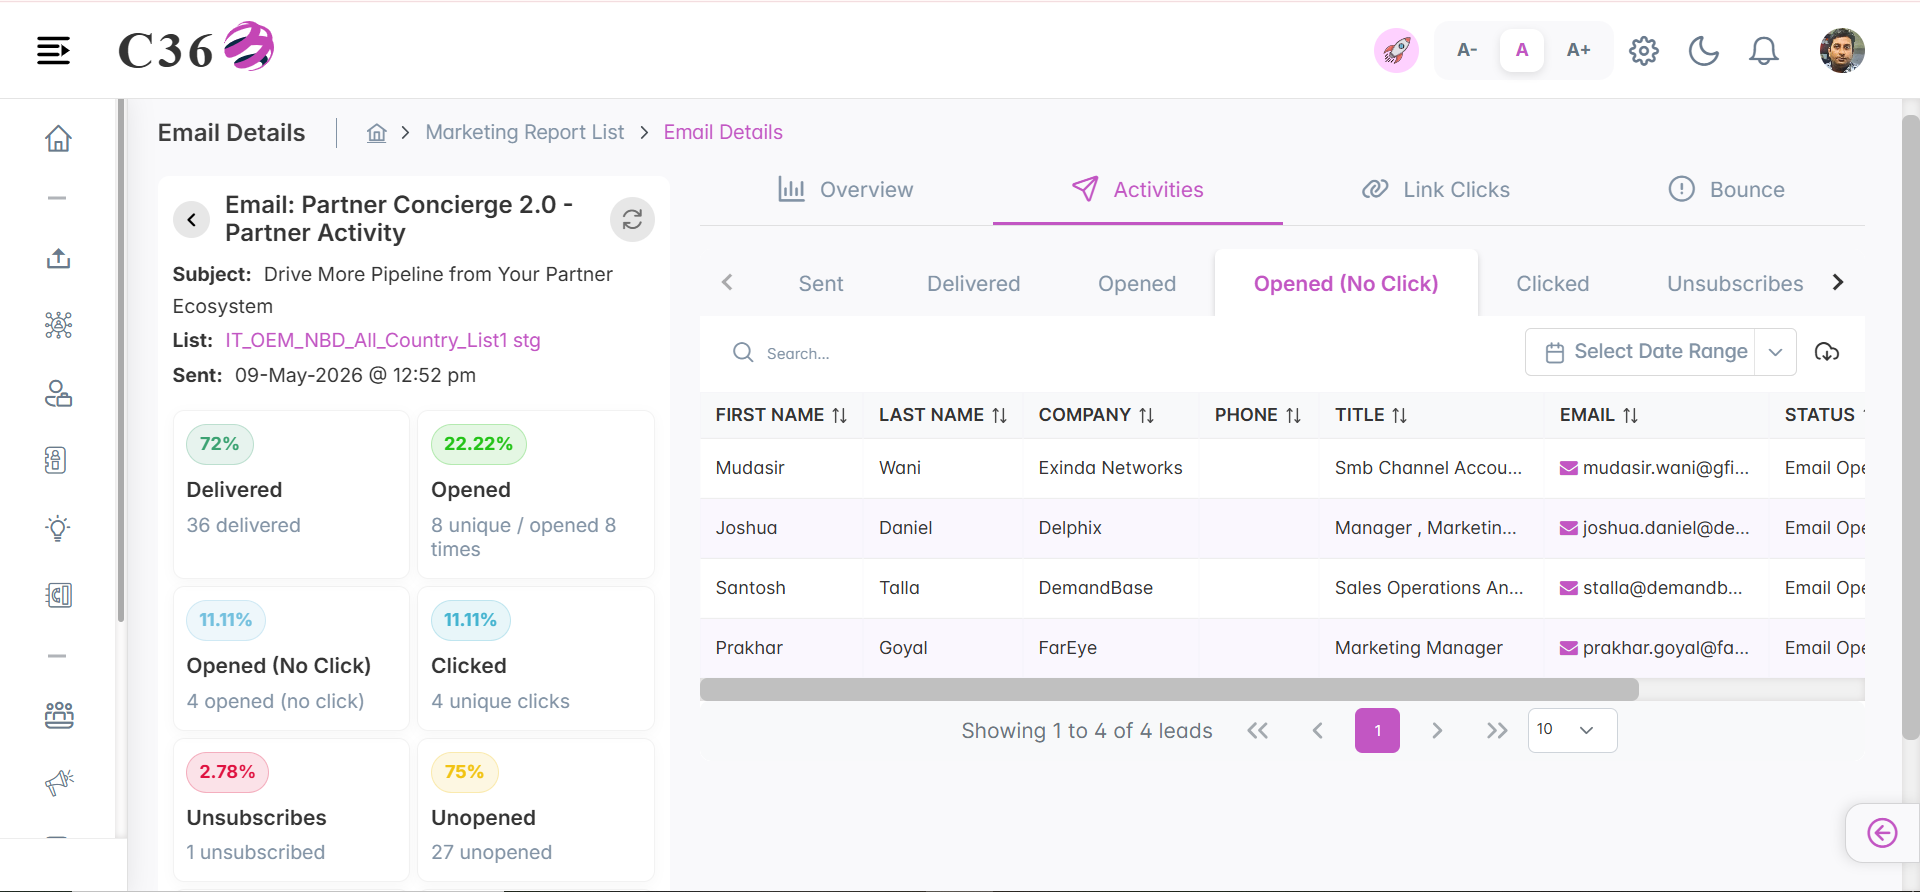
- Number of prospects performed the clicked activity for attached links.
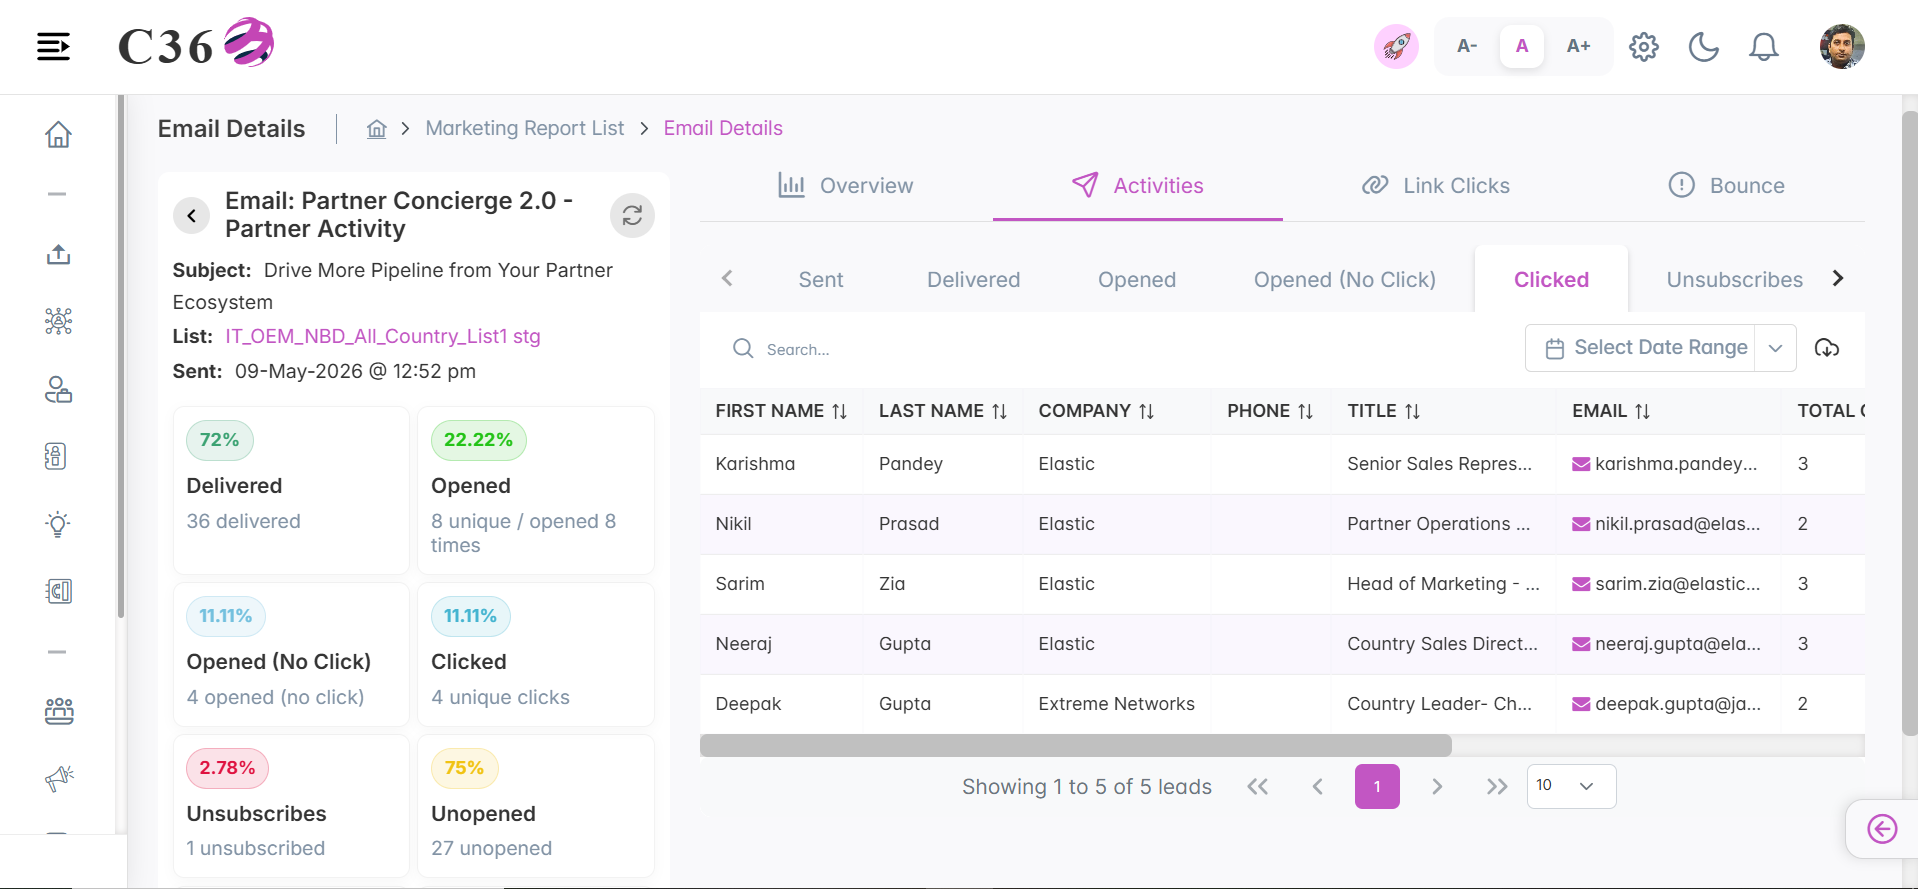
- Number of prospects who unsubscribed from the campaign.
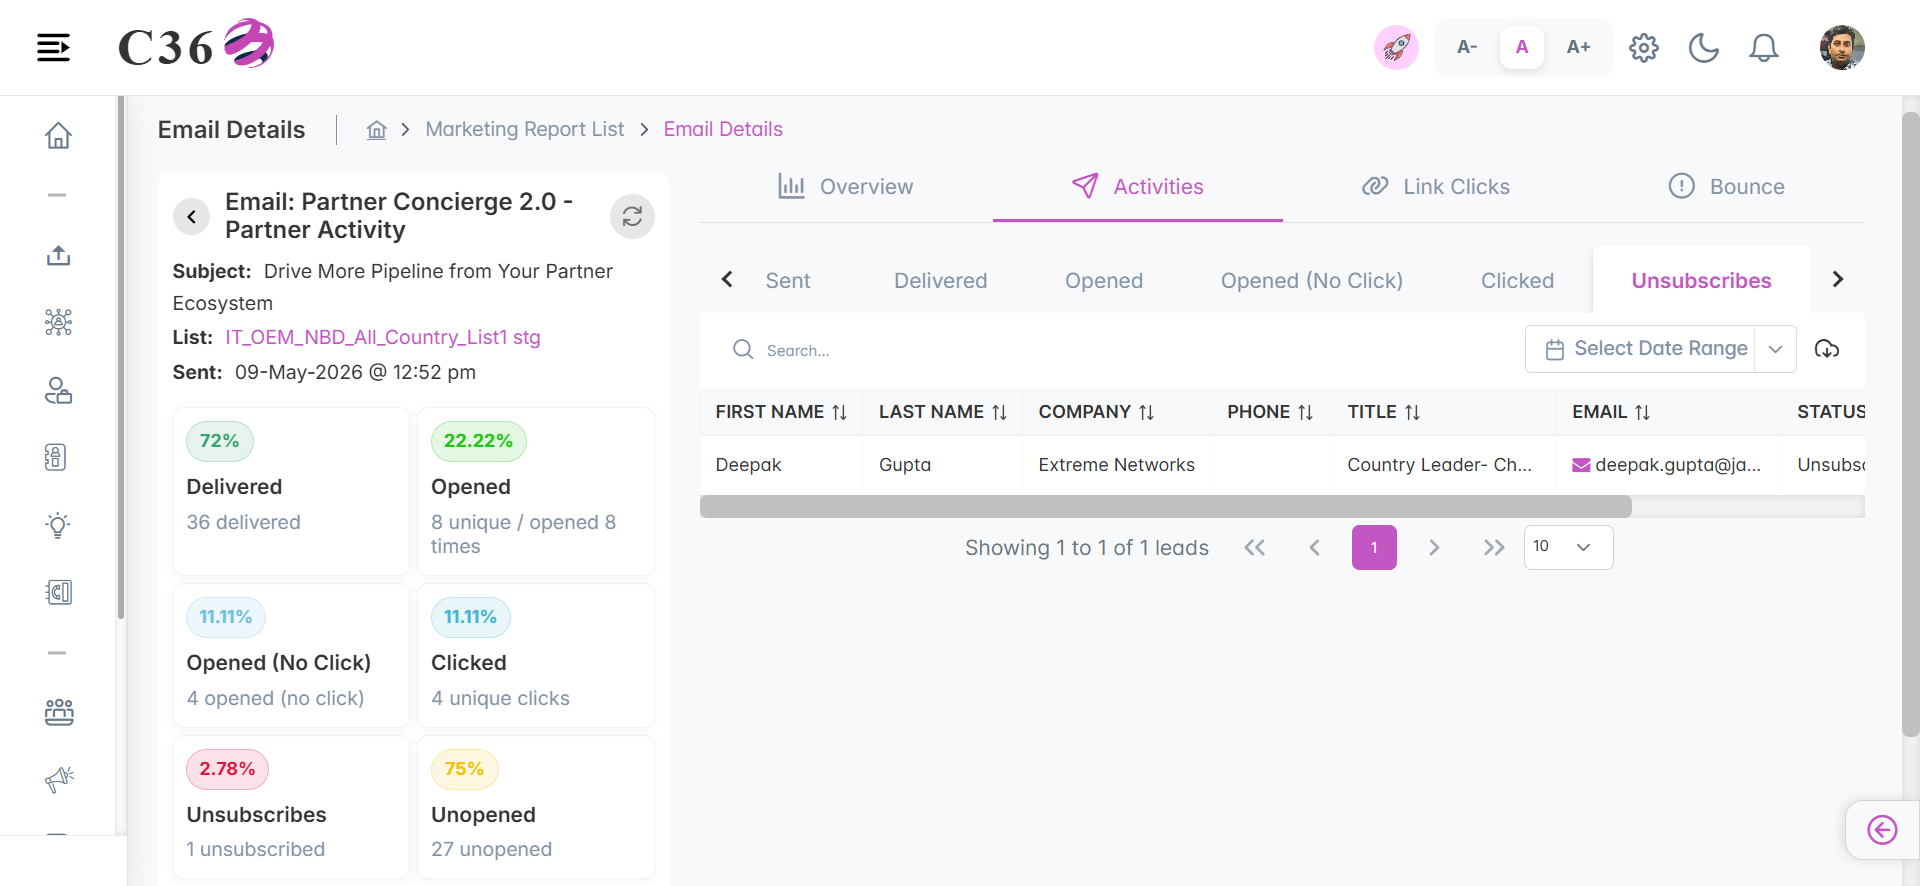
- Number of prospects who did not open the email.
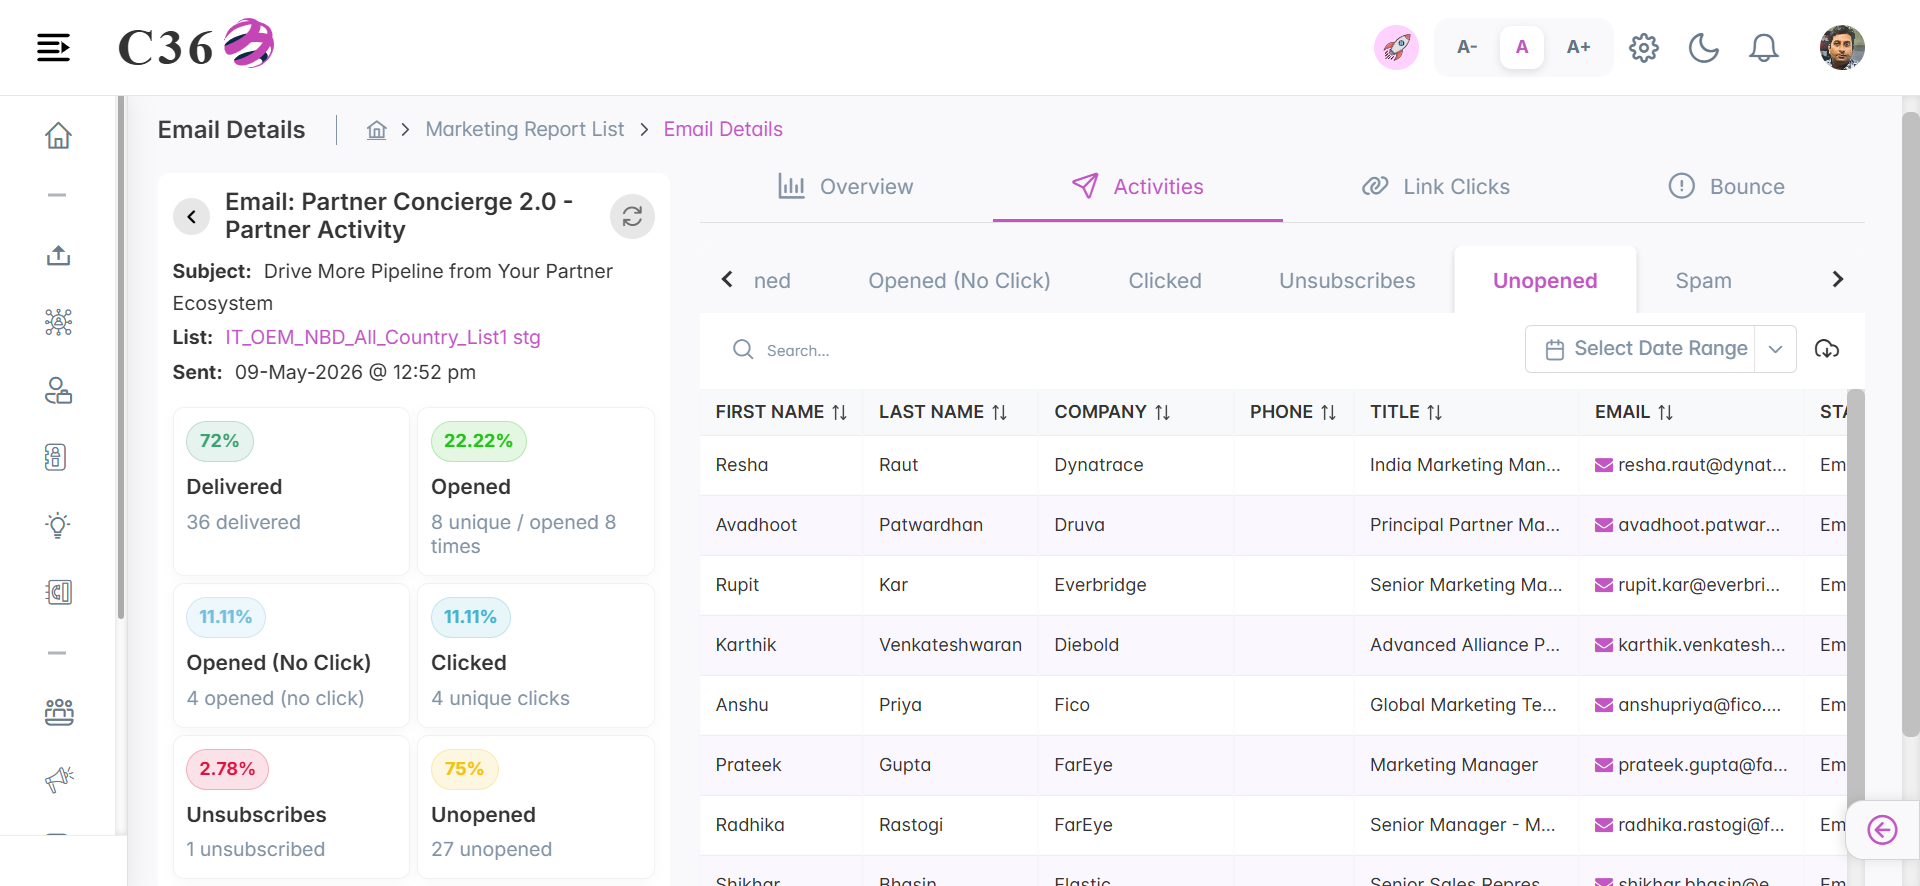
- Mails which were marked as spam.
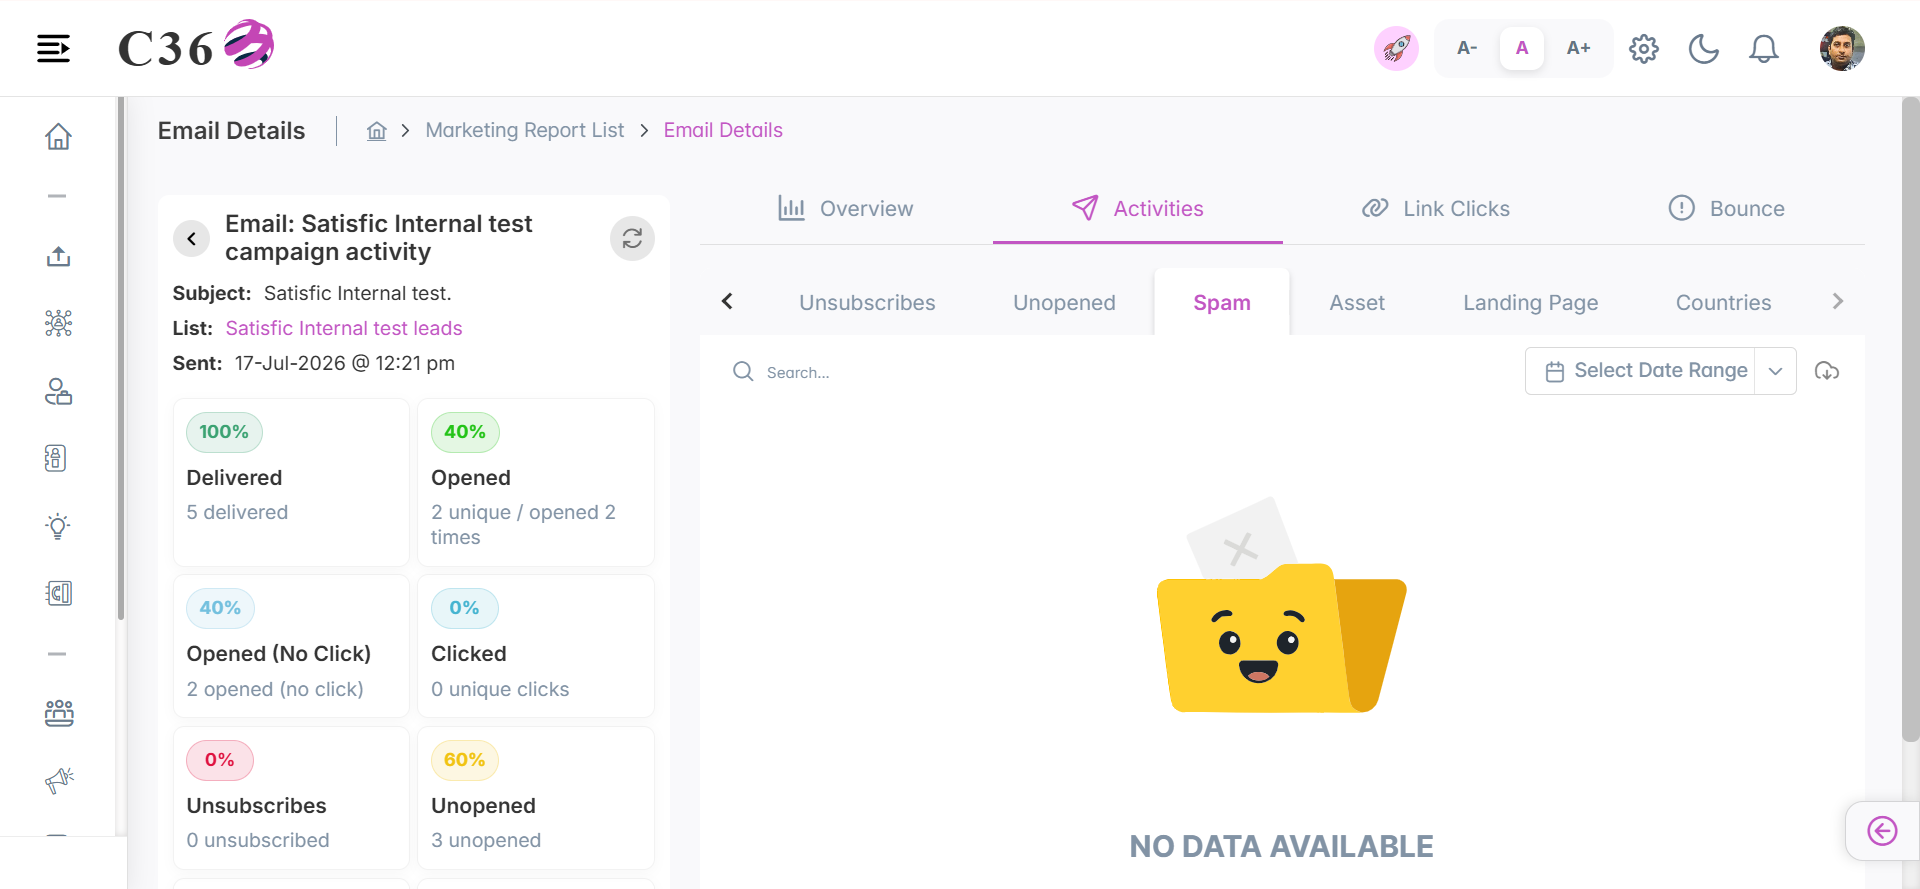
- Number of prospects who interacted with the campaign's assets.
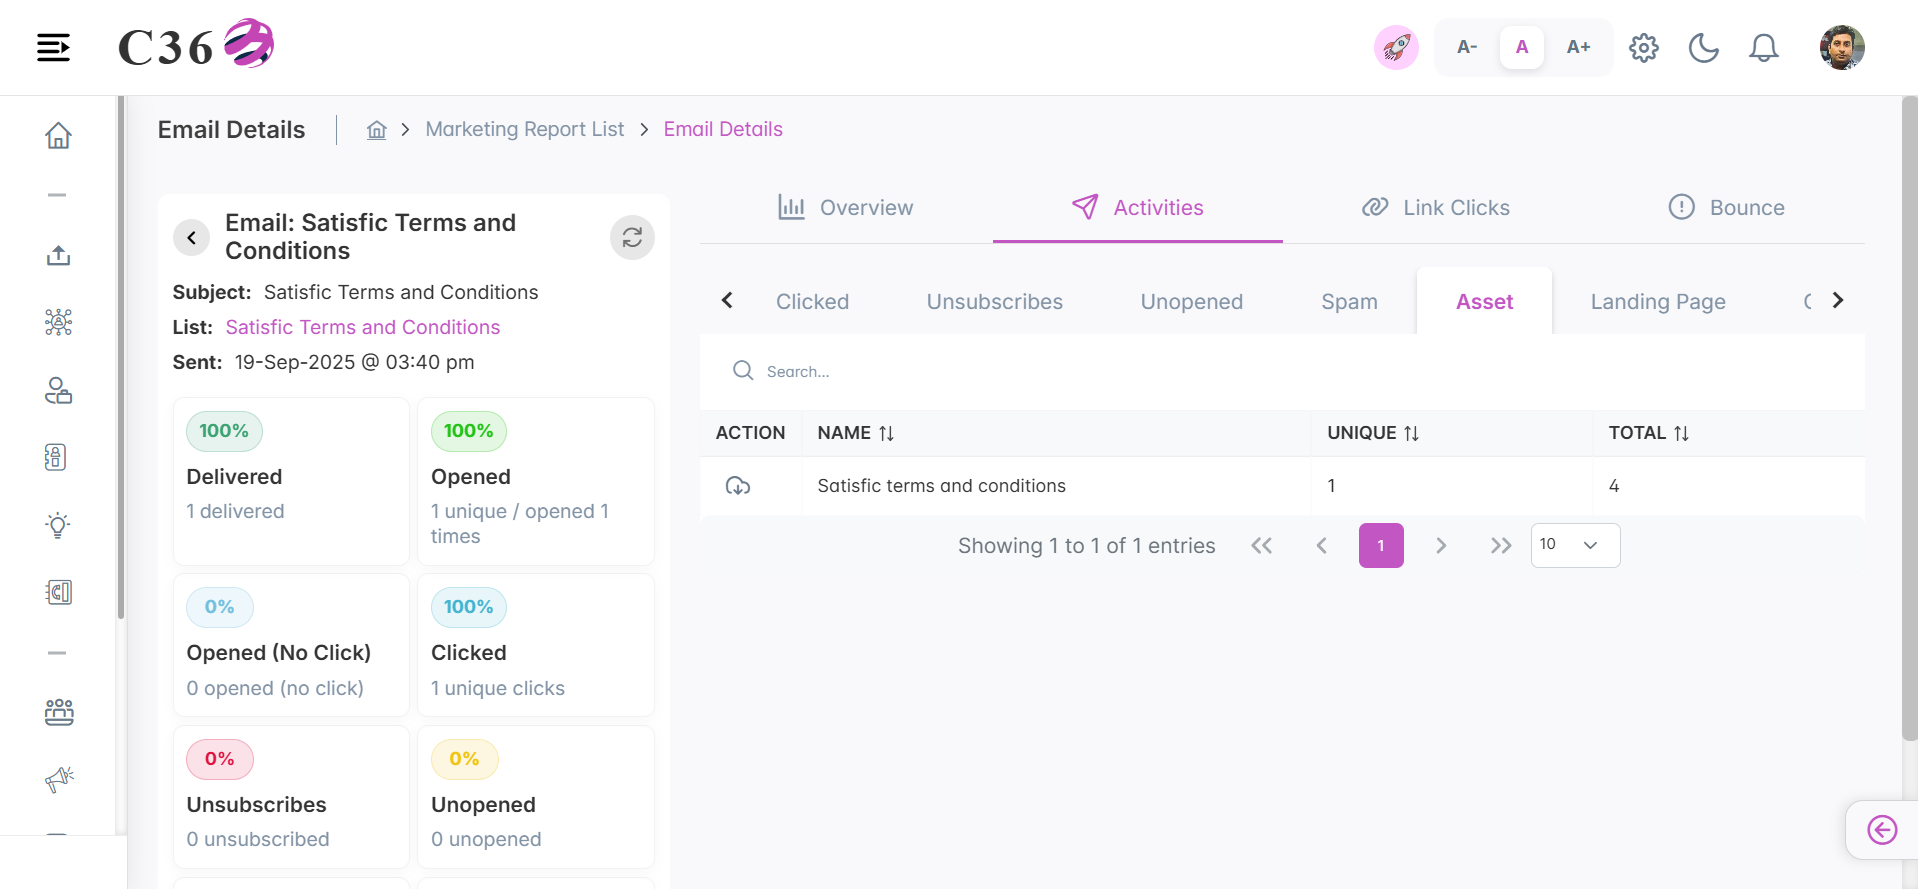
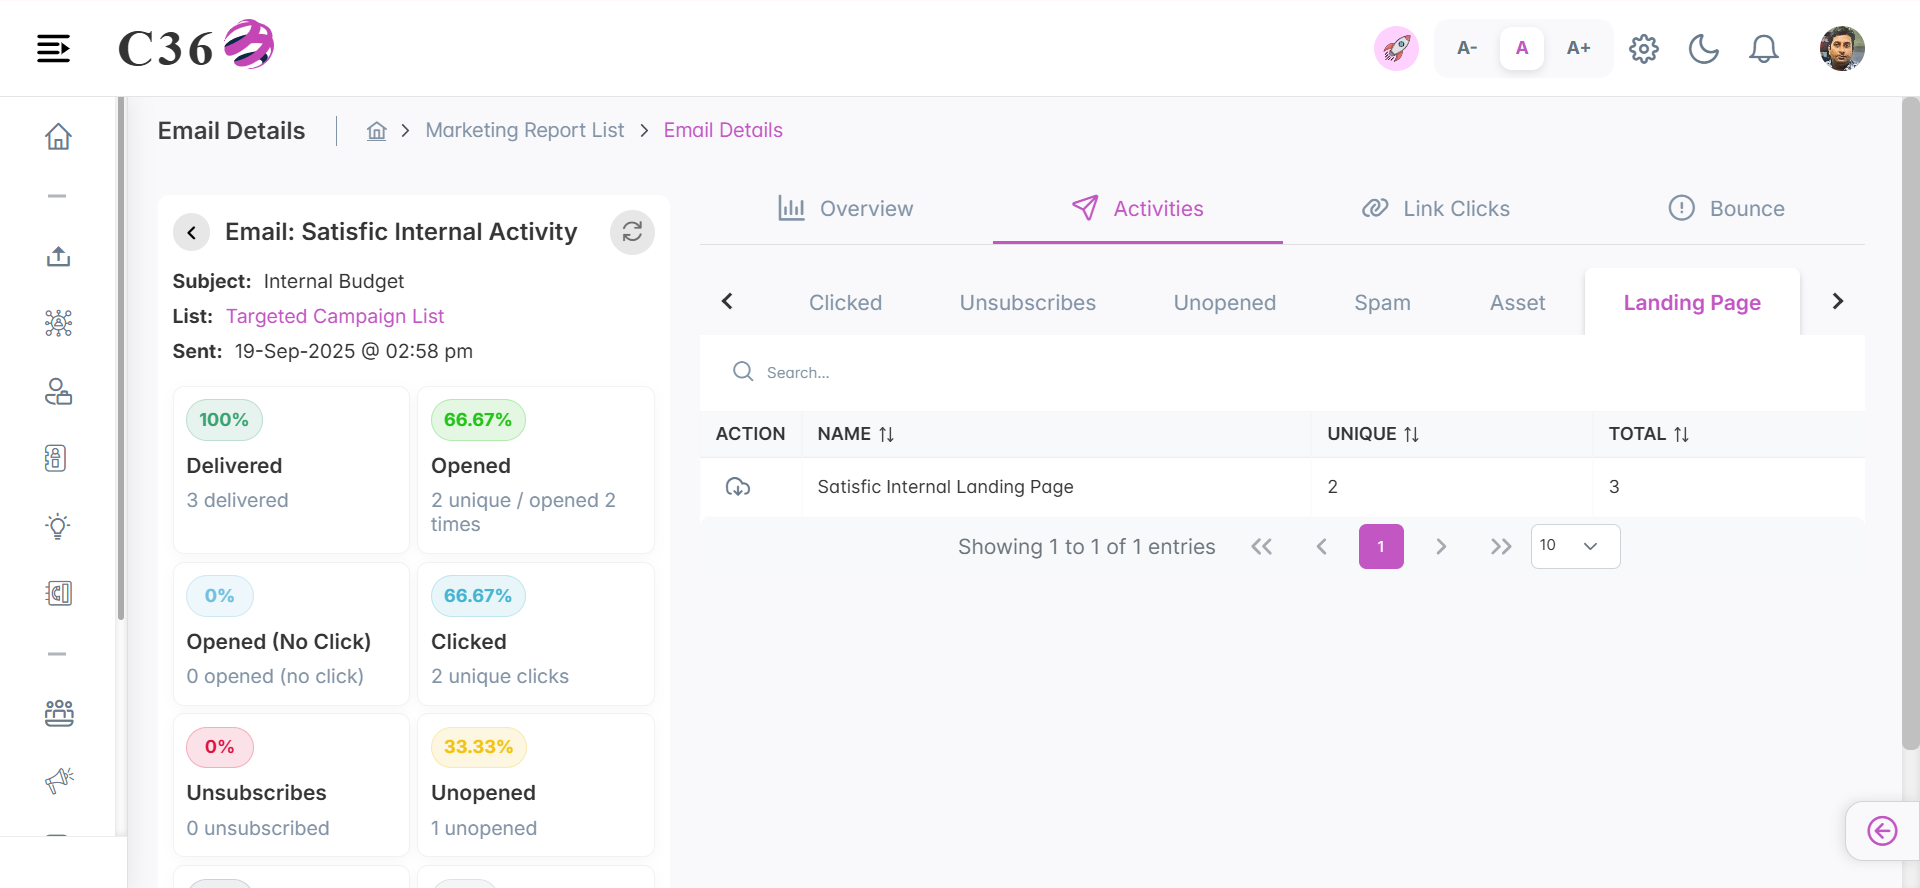
- Number of prospects who interacted with the campaign's landing pages.
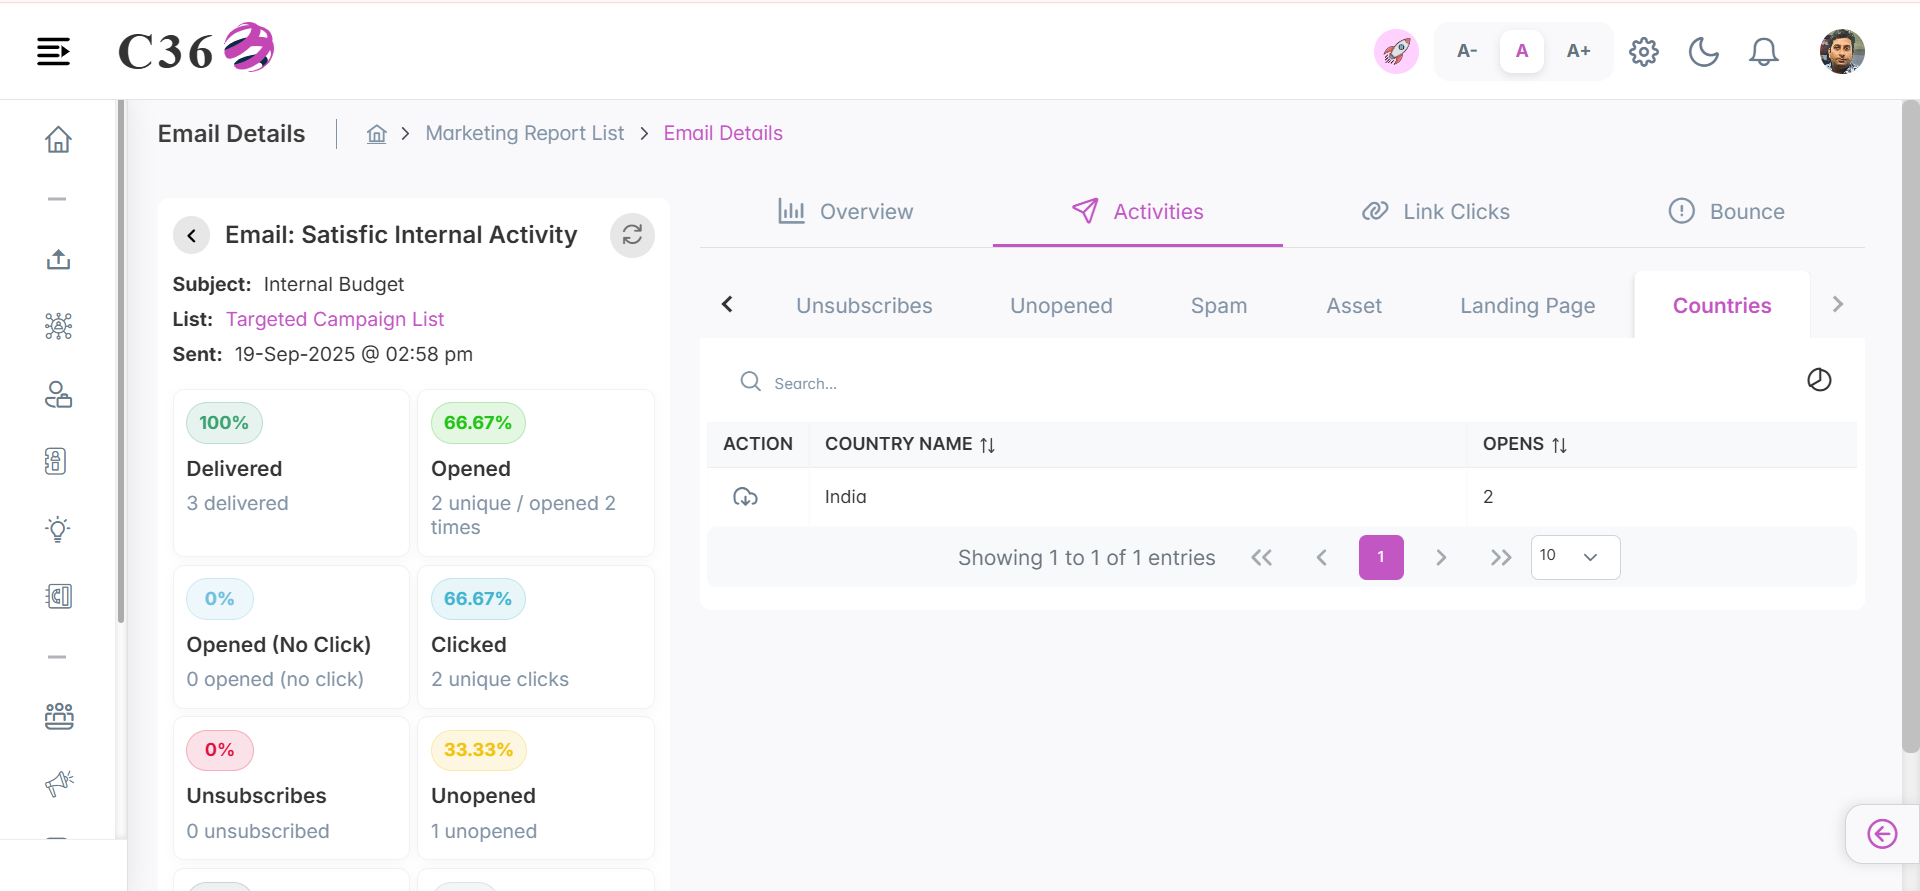
- Country Wise distribution of prospects who opened the email..
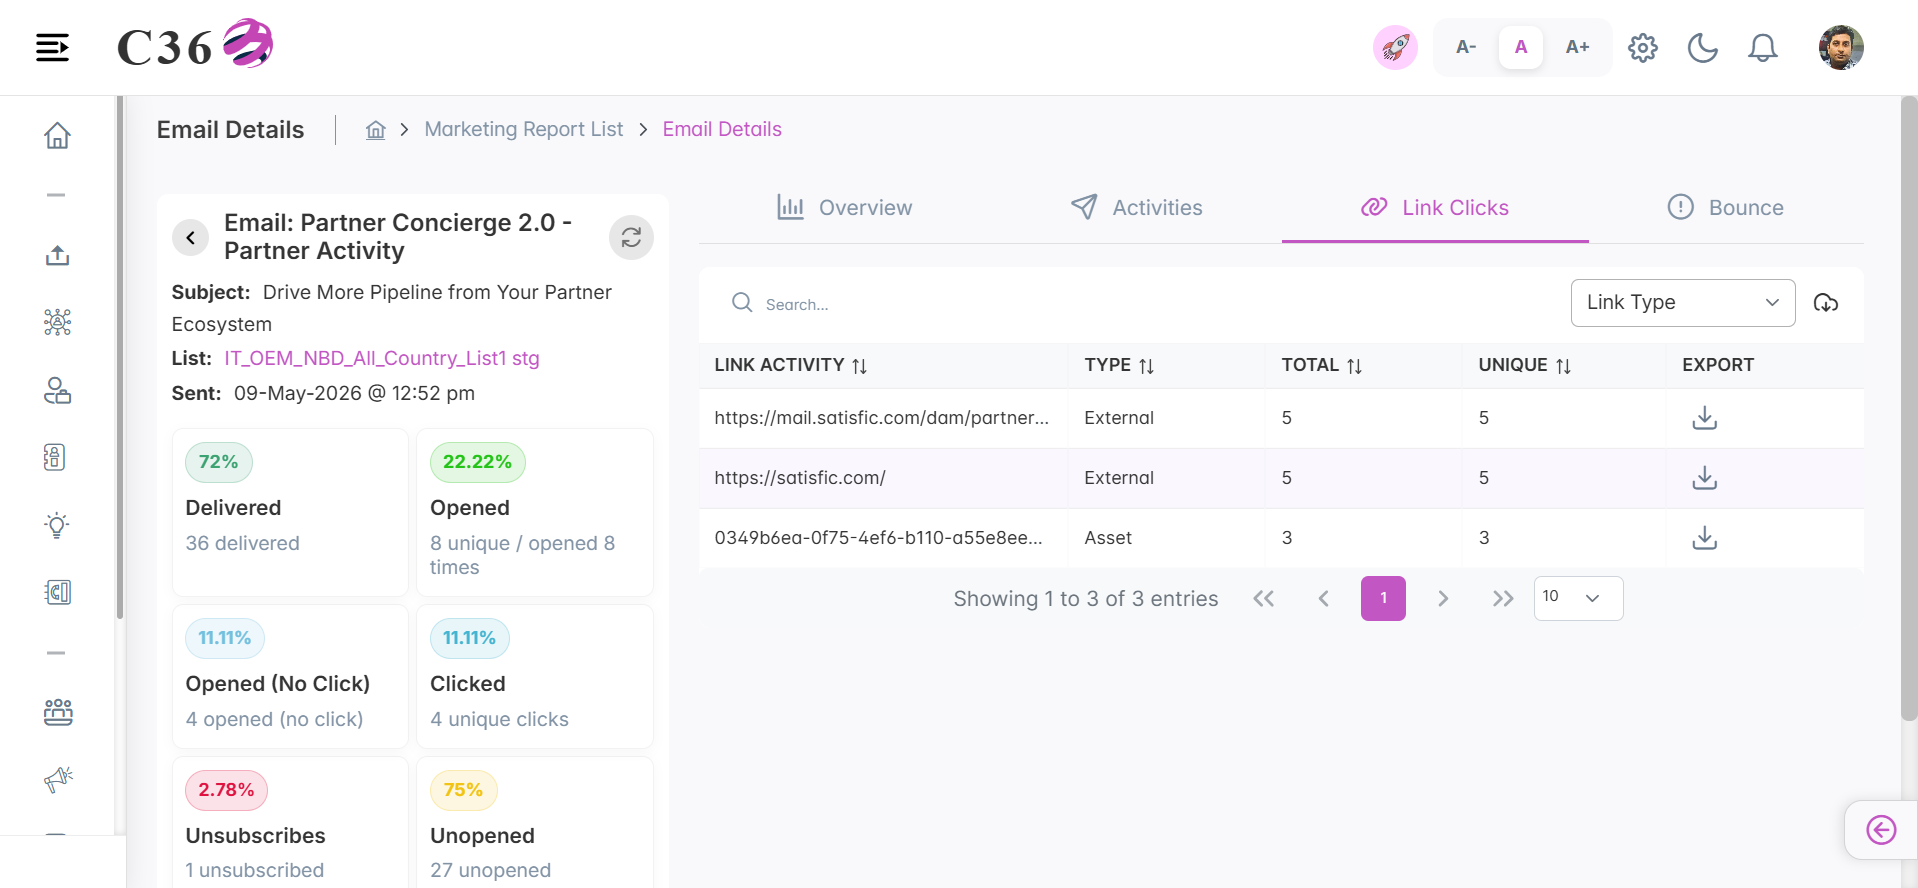
- Number of prospects who clicked links in the email.
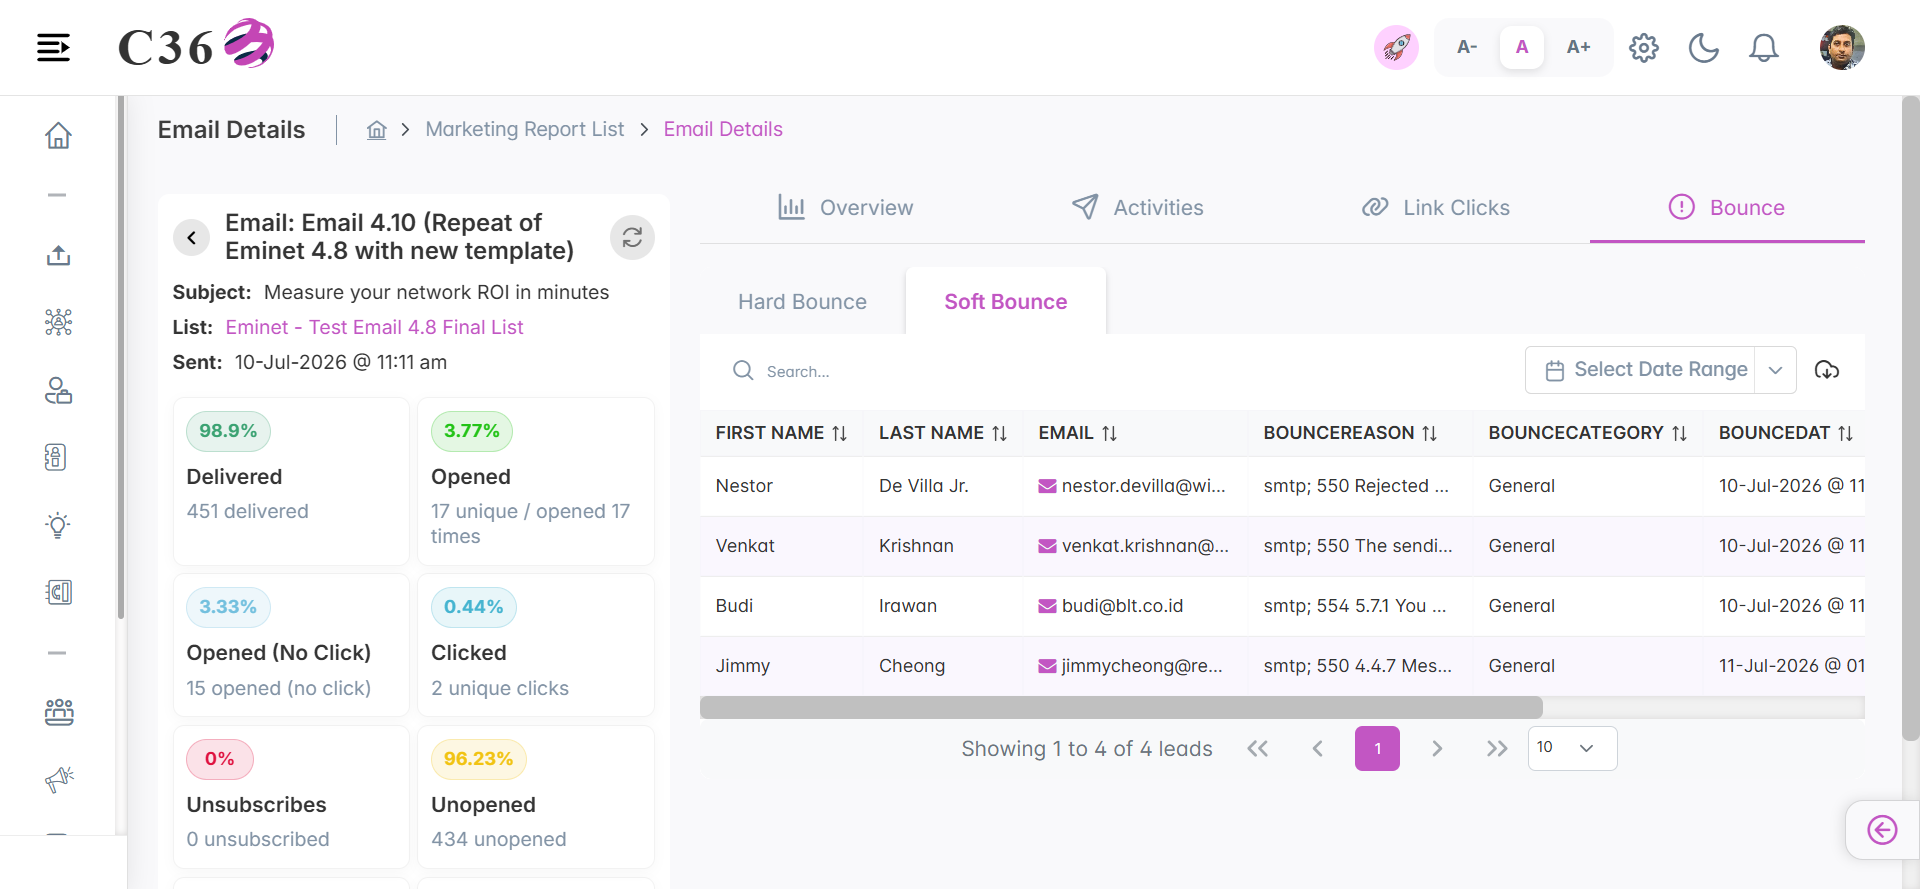
- Number of emails that have bounced for the prospects.
- Hard Bounce: Email address is invalid or does not exist.
- Hard Bounce leads are automatically excluded from campaign lists.
- Soft Bounce: Email address is valid but the email could not be delivered due to temporary issues (e.g., mailbox full, server down).
- Total/Total Clicks = Unique Clicks + Non-Unique Clicks.
- Unique/Unique Clicks = Clicks performed by unique prospects.
- Reports can be downloaded from each table if data is available.
- Country-wise data can be viewed in both graph and table formats.
━━━━━━━━━━━━━━━━━━━━━━━━━━━━━━━━━━━━━━━━━━━━━━━━━━━━━━━━━━━━━━━━━━━━━━━━━━━━━━━━━━━━━
Campaign Analytics
📬 Email Reports (Outgoing Emails)
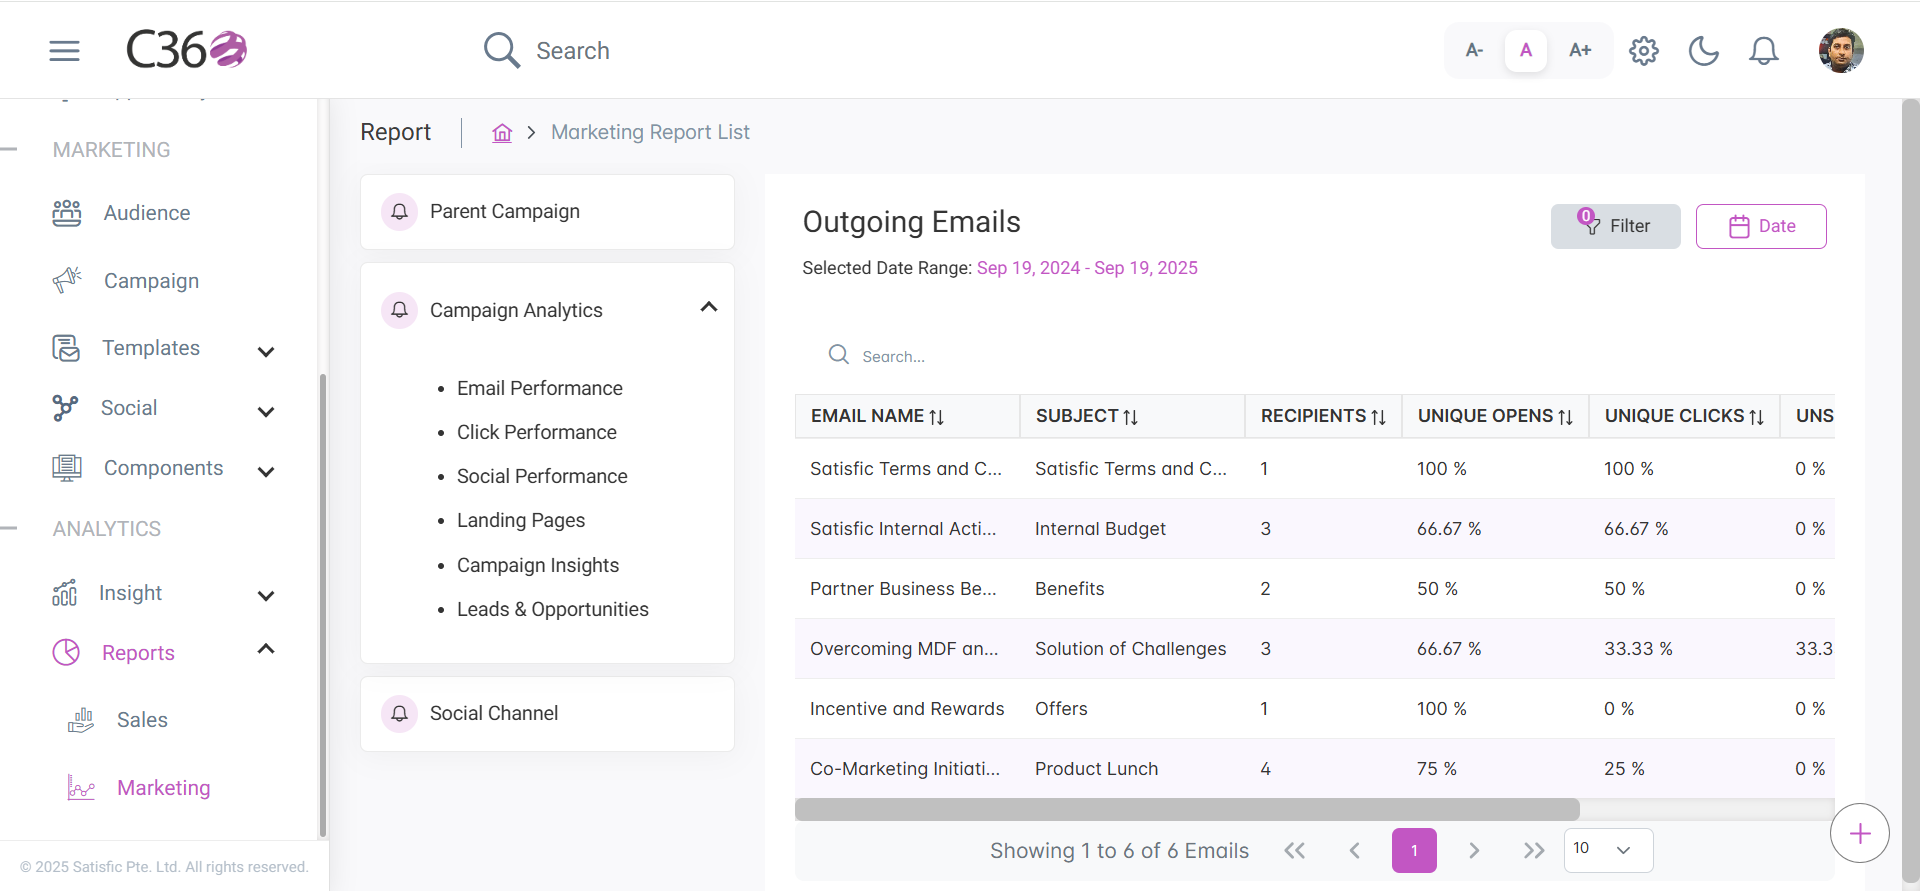
The Email Reports section provides insights into all outgoing email campaigns, tracking:
- Emails Sent, Opened, Clicked, Bounced, and Unsubscribed
It includes a table with the following columns:
Click to see columns contained by the email report data table
- Email Name
- Subject
- Recipients
- Unique Opens
- Unique Clicks
- Unsubscribed
- Email Bounced
Click to see filter options for outgoing campaign
- Country
- Company
- Users (required for Country and Company filters to work)
- Campaign
- Date Range
Country and Company filters only work if a User is selected.
🖱️ Click Performance (Outgoing Assets)
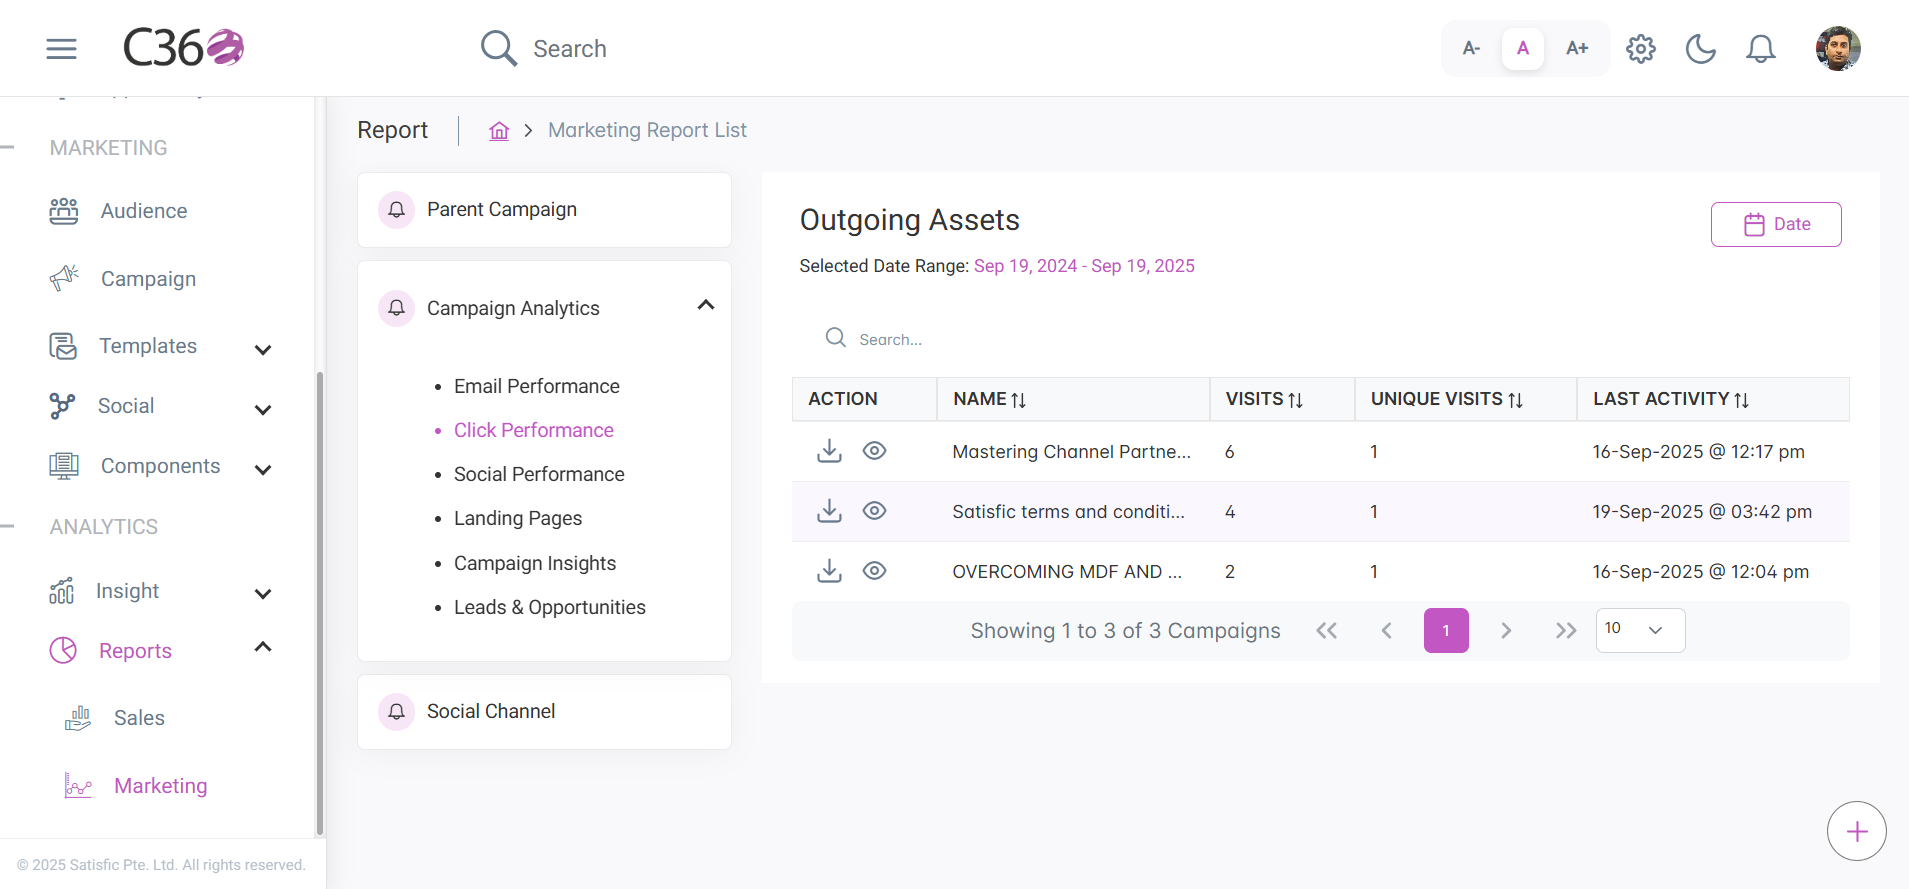
The Click Performance report tracks engagement with outbound assets such as links and documents.
Click to see metrics included
- Action – Download/preview options
- Name – Asset name
- Visits – Total visits
- Unique Visits – Unique users
- Last Activity – Most recent interaction
⭐ Social Performance
Social Performance represents how well your brand or campaigns are performing across different social media channels based on engagement, reach, and audience growth.
Click to see metrics included
- Post Name – Name of the Post
- Channels – Post associated with the Social Channel
- Impressions – The total number of times your social post was displayed on users’ screens — whether or not they interacted with it.
- Engagements – Total interactions such as likes, comments, shares, clicks, and saves on your posts.
- Clicks – The number of times users clicked on any link, image, video, or call-to-action (CTA) within your post.

🧩 Social Performance Details
- Click on Post Name to navigate to the Social Performance Details Page, where you will find overall performance by percentage and each individual performance by graph blocks.

- 👍 Reaction
- 💬 Comment
- 🔁 Reshare
- 📊 Engagements
- 👁️ Impressions
- 🙋 Members Reached
Definition: Indicates how many people have reacted to your post (e.g., liked, loved, celebrated). Reactions show how your audience emotionally responds to your content.
Definition: Represents the total number of comments made on your post. Comments reflect how engaging or conversation-worthy your post is.
Definition: Shows how many times your post was reshared by users. Reshares help increase your post’s visibility and reach.
Definition: The sum of all user interactions on your post — including reactions, comments, clicks, and reshares. It’s a key measure of how actively your audience interacts with your content.
Definition: Indicates how many times your post appeared on users’ screens. Multiple impressions can occur from the same user if they see the post more than once.
Definition: The total number of unique members who saw your post at least once. Unlike impressions, reach counts unique viewers only.
🌐 Outgoing Landing Pages
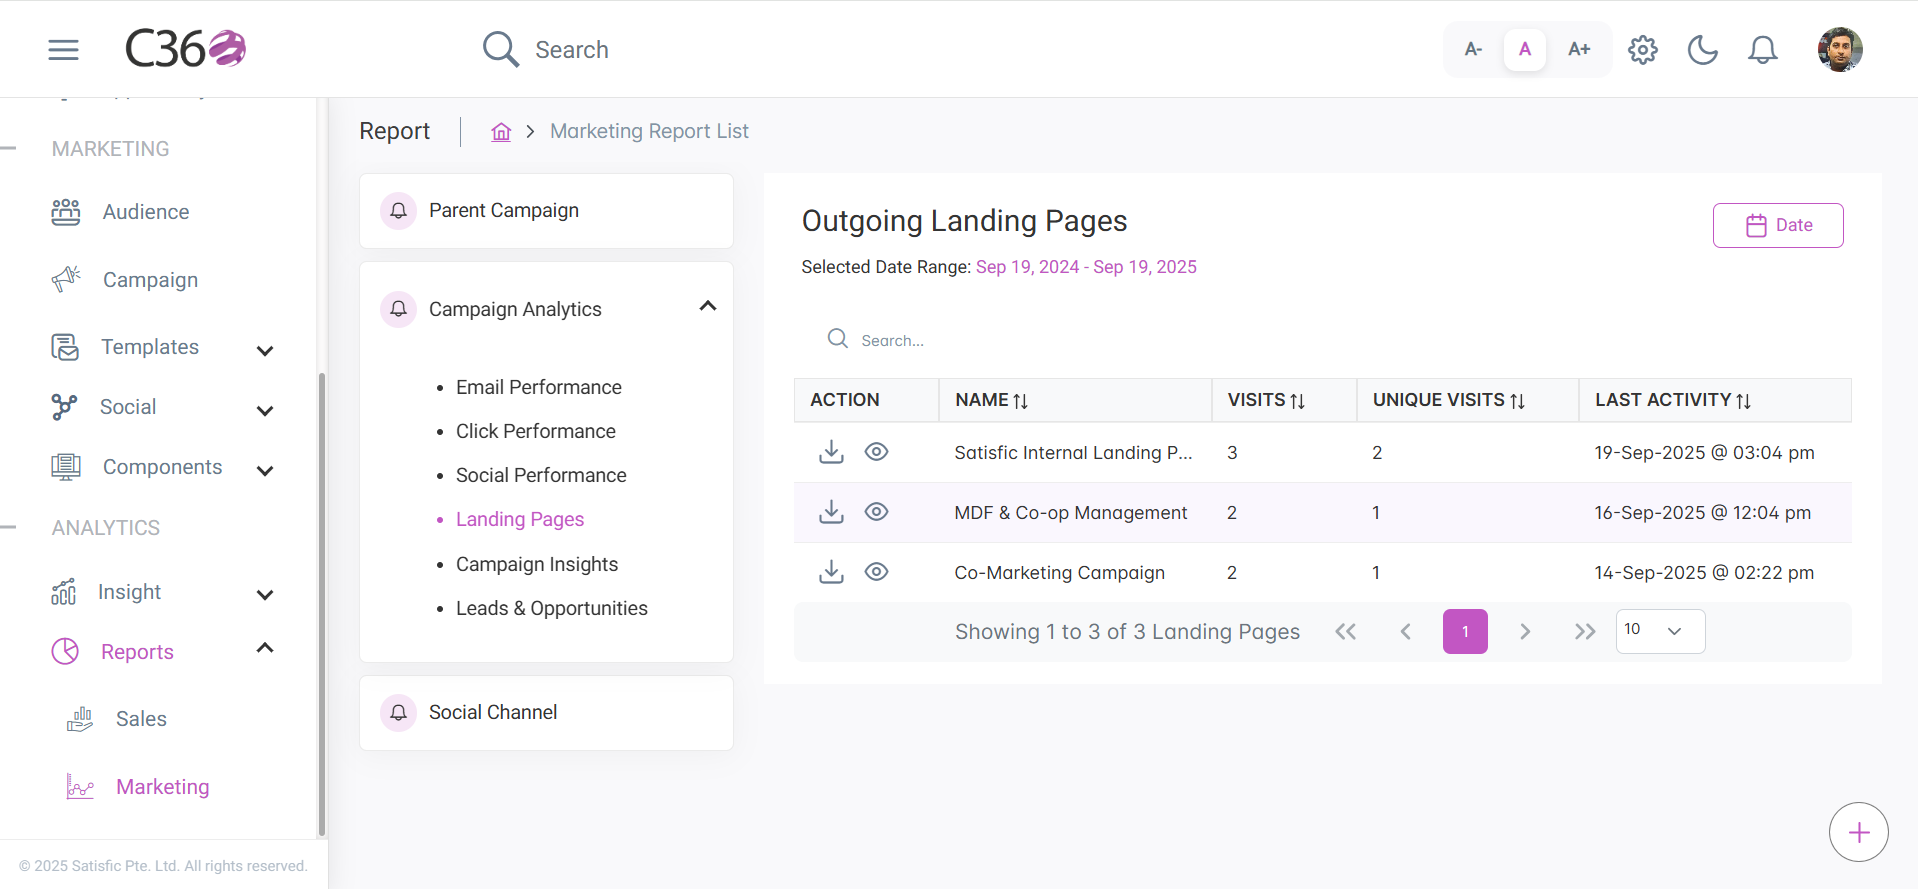
The Landing Pages section shows visitor engagement with landing pages linked to campaigns.
It includes
- Action – Download/preview options
- Name – Landing page name
- Unique Count – Unique visitors
- Total Count – Total visits
━━━━━━━━━━━━━━━━━━━━━━━━━━━━━━━━━━━━━━━━━━━━━━━━━━━━━━━━━━━━━━━━━━━━━━━━━━━━━━━━━━━━━
📈 Campaign Dashboard
This section provides a high-level overview of campaign performance with the following reports:
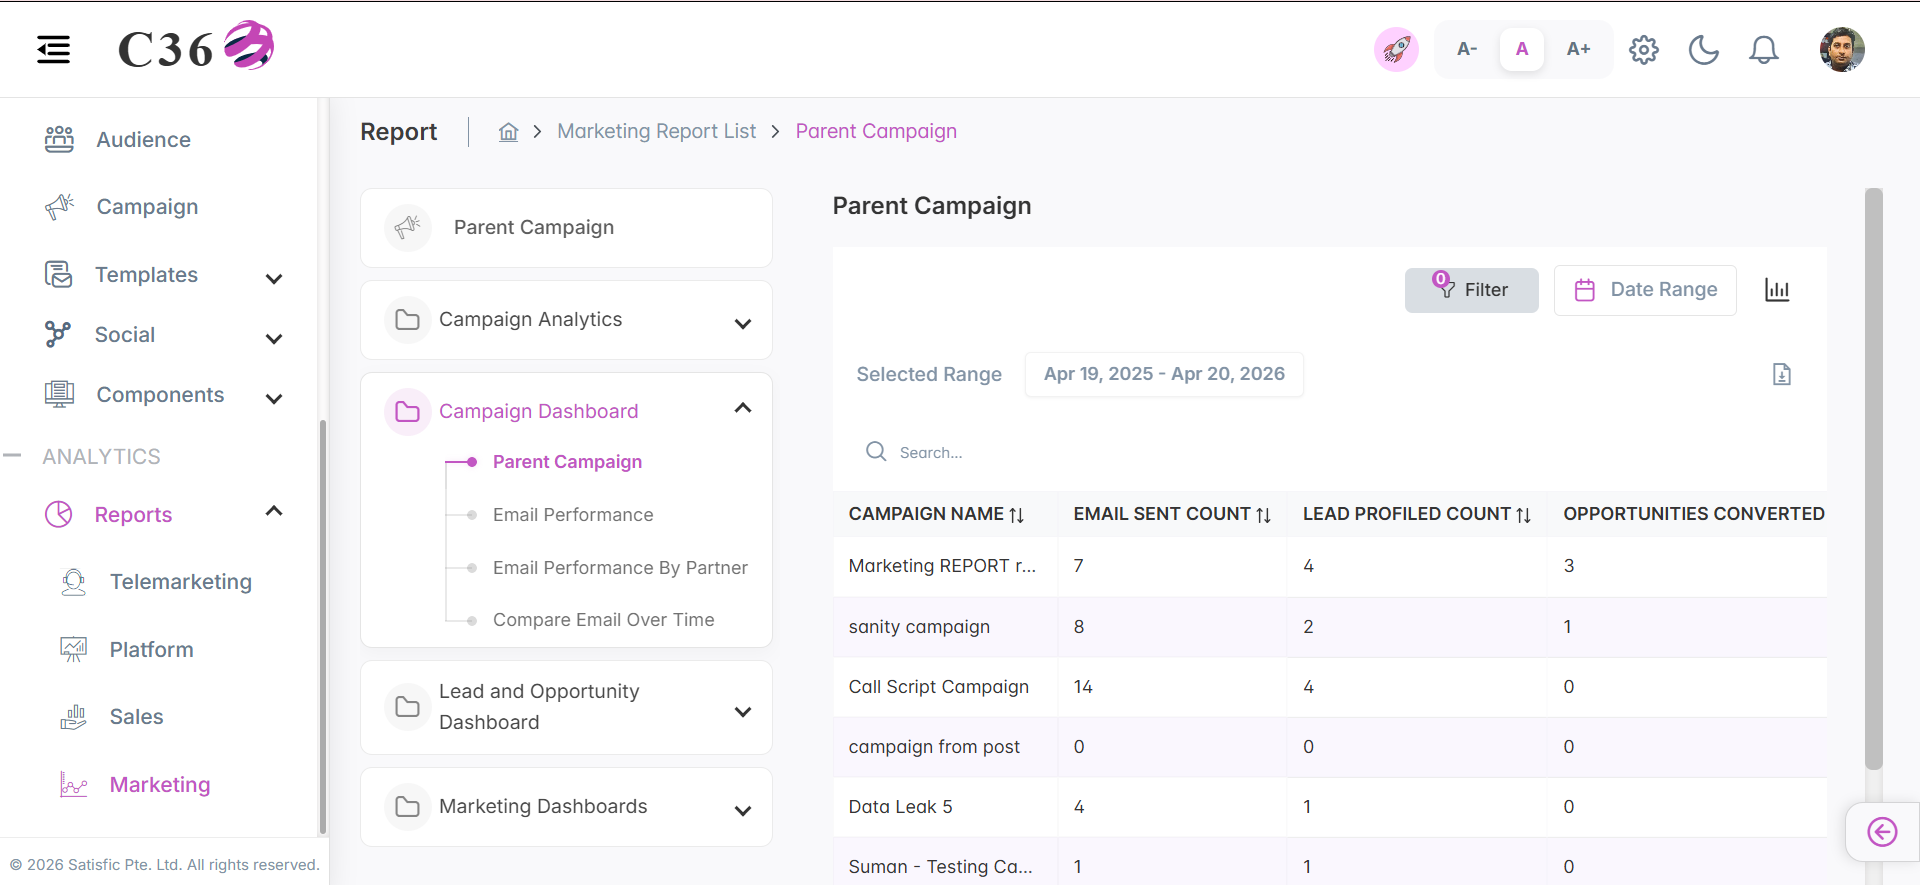
🗂️ Parent Campaign
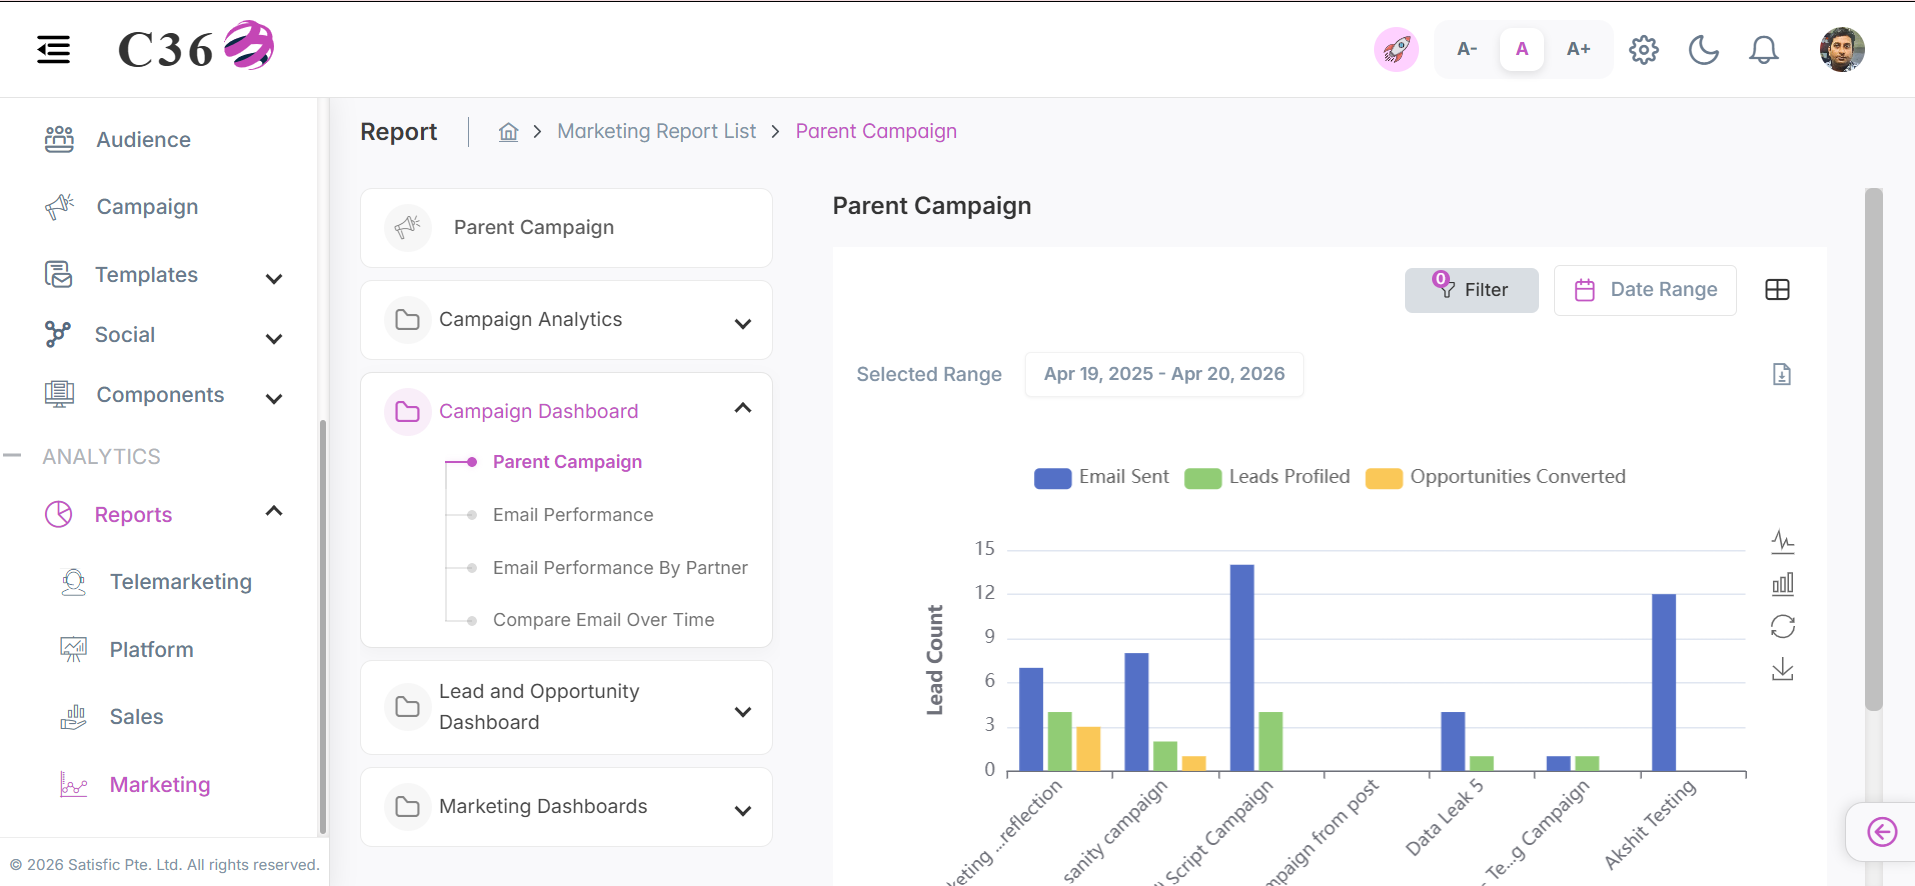
Displays an aggregated summary of all overarching campaigns and their constituent marketing activities.
- 📊 Chart View
- 📋 Table View
Click to see quick actions
- Can Toggle between Table view and Chart view.
- Can Filter the chart by selecting and unselecting the color buttons.
- Can Export/Download the report.
- Can Filter by Date Range.
- Can Filter by Country, Company and Users.
- Toggle between Line chart and Bar chart.
- Save the Chart as an image.
- Can Restore the bar chart.
Click to see quick actions
- Can Toggle between Table view and Chart view.
- Can Export/Download the report.
- Can perform search in the table.
- Can Filter by Date Range.
- Can Filter by Country, Company and Users.
🧾 Columns included in the table view
| Field Name | Description |
|---|---|
| Campaign Name | Unique name used to identify and track a campaign. |
| Email Sent Count | Total number of emails sent to targeted leads. |
| Lead Profiled Count | Number of leads captured or enriched through campaign interactions. |
| Opportunity Converted Count | Number of leads converted into sales opportunities. |
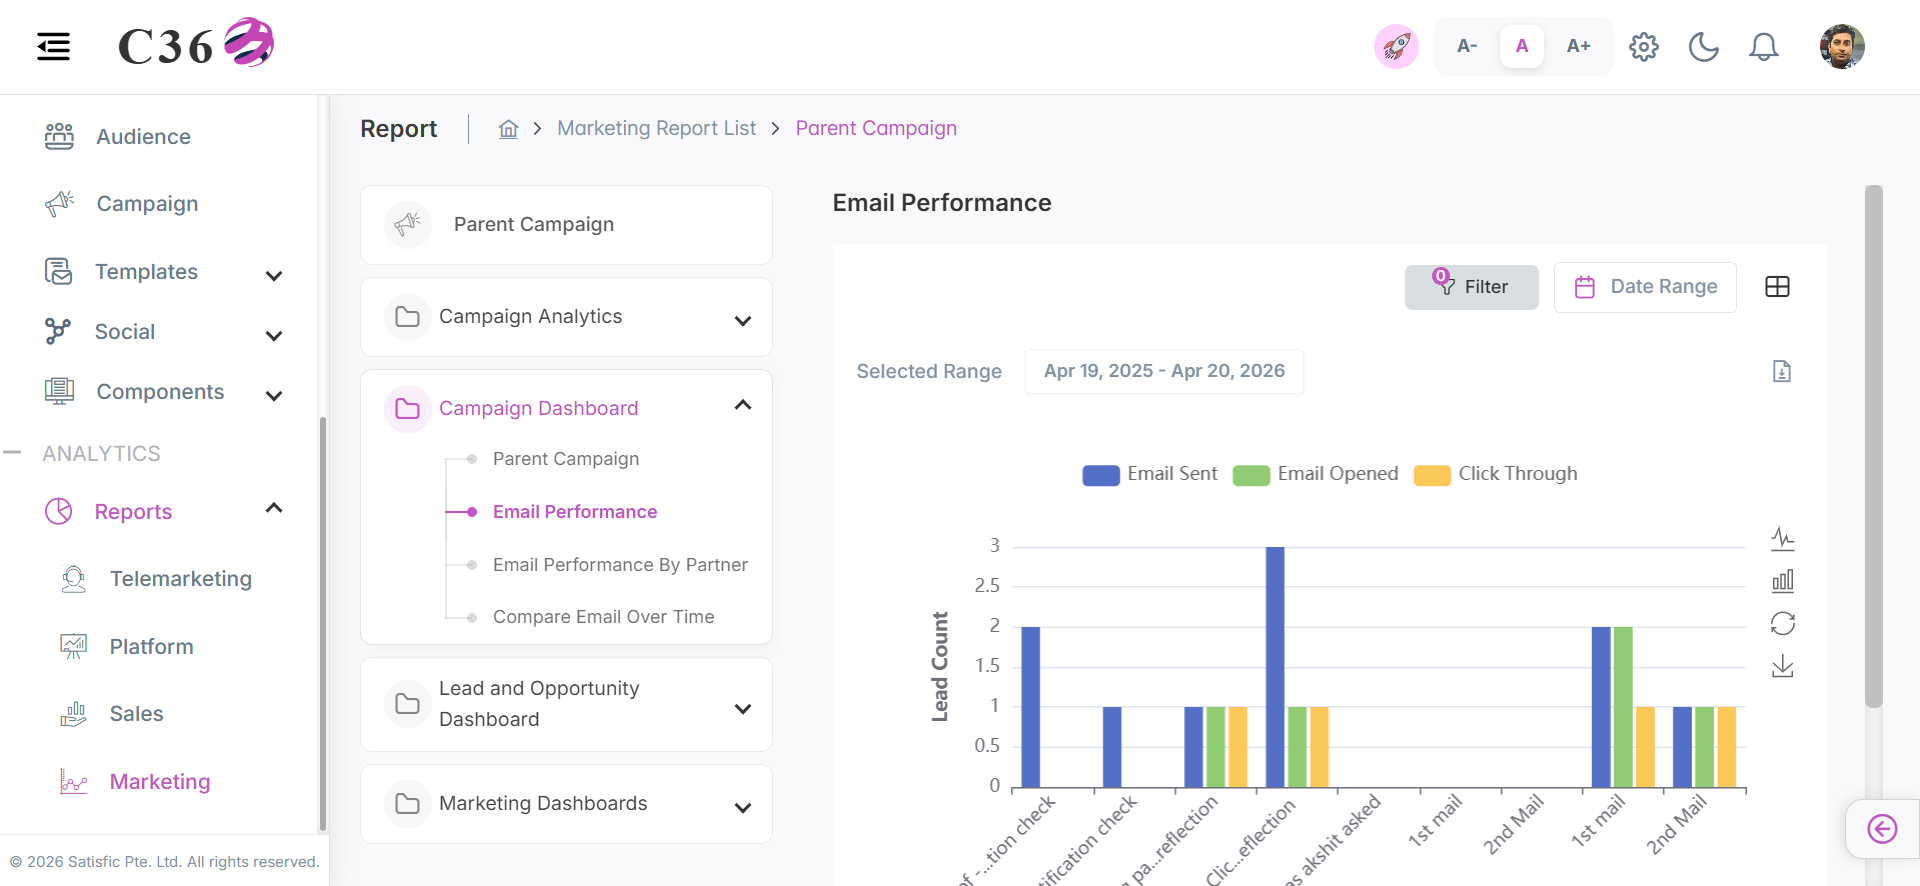
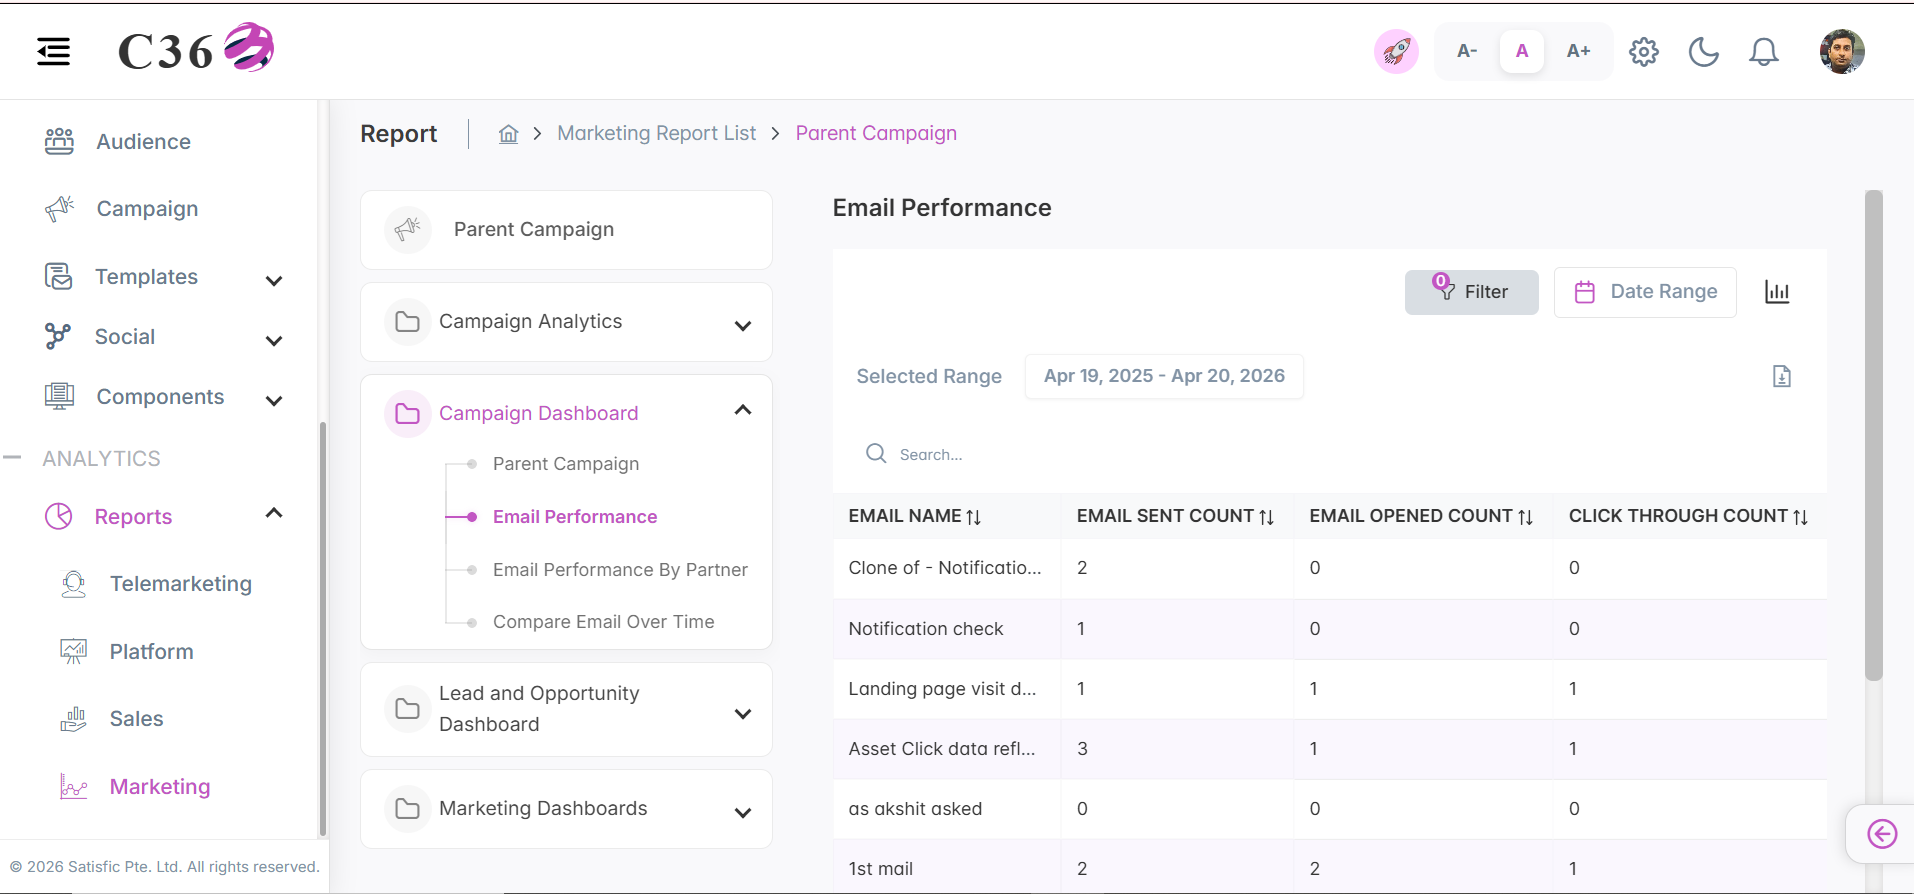
📧 Email Performance
Provides comprehensive metrics on email outreach effectiveness, including delivery, open, and click-through rates.
- 📊 Chart View
- 📋 Table View
Click to see quick actions
- Can Toggle between Table view and Chart view.
- Can Filter the chart by selecting and unselecting the color buttons.
- Can Export/Download the report.
- Can Filter by Date Range.
- Can Filter by Country, Company and Users.
- Toggle between Line chart and Bar chart.
- Save the Chart as an image.
- Can Restore the bar chart.
Click to see quick actions
- Can Toggle between Table view and Chart view.
- Can Export/Download the report.
- Can perform search in the table.
- Can Filter by Date Range.
- Can Filter by Country, Company and Users.
🧾 Columns included in the table view
| Field Name | Description |
|---|---|
| Email Name | Unique identifier assigned to an email campaign or template for tracking and reference. |
| Email Sent Count | Total number of emails successfully sent to recipients. |
| Email Open Count | Number of recipients who opened the email, indicating initial engagement. |
| Click Through Count | Number of clicks on links within the email, reflecting user interaction and interest. |
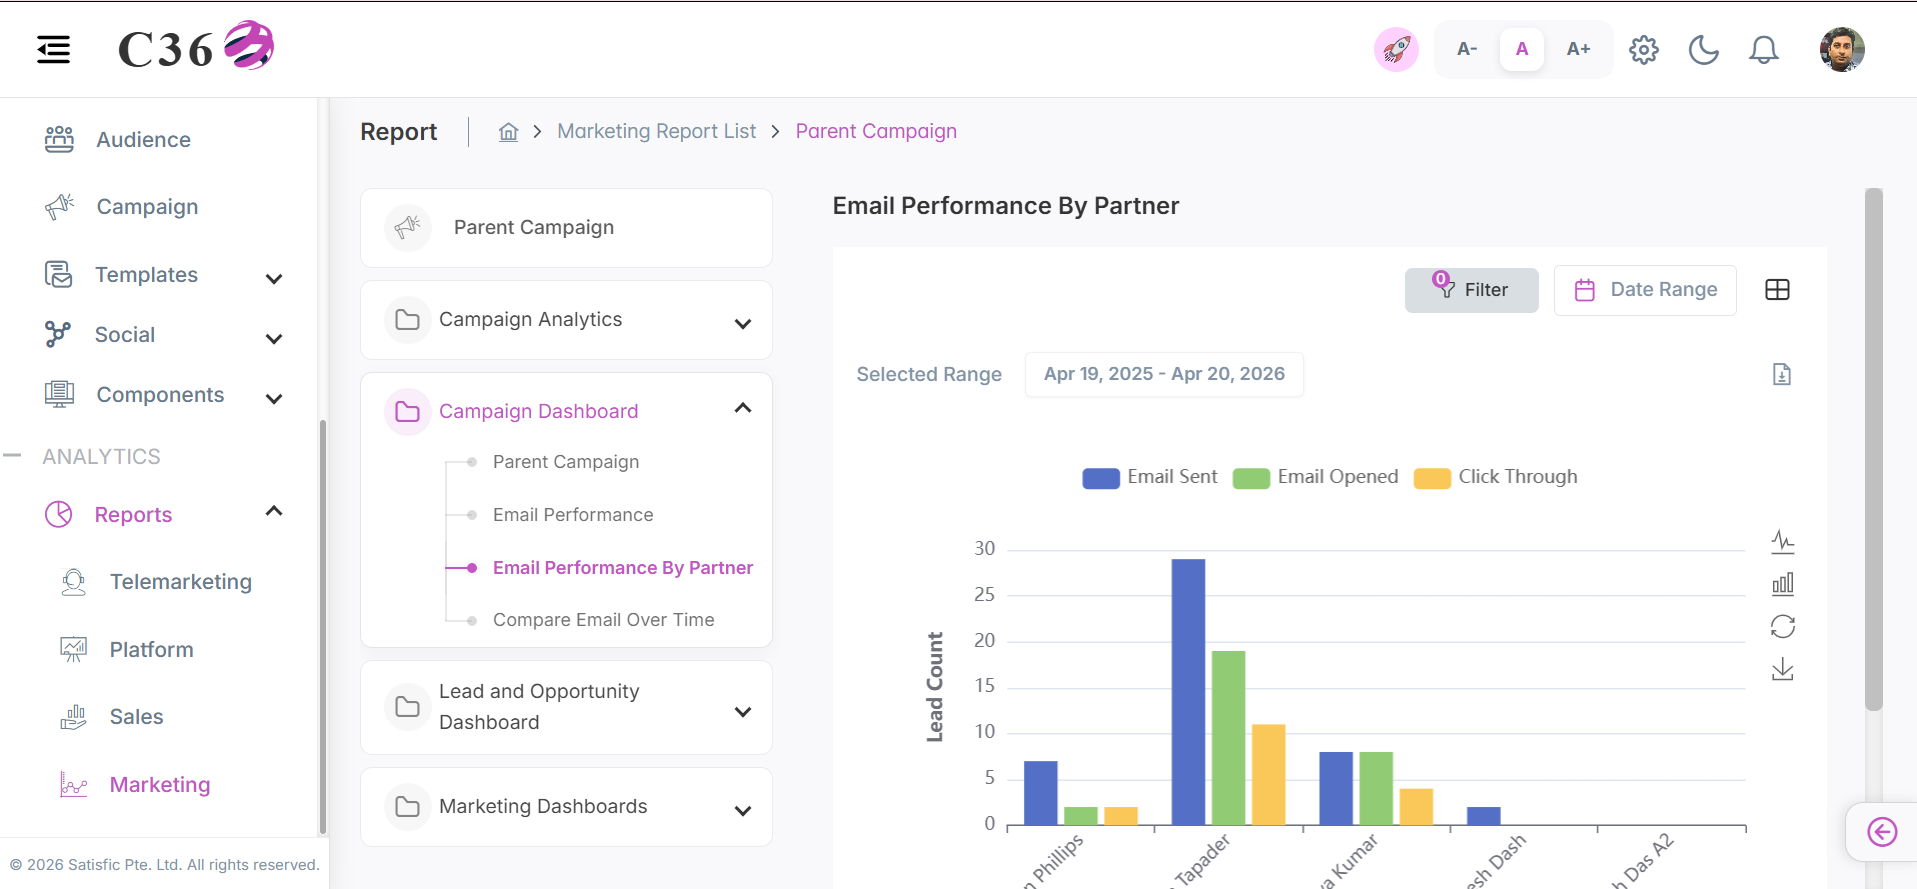
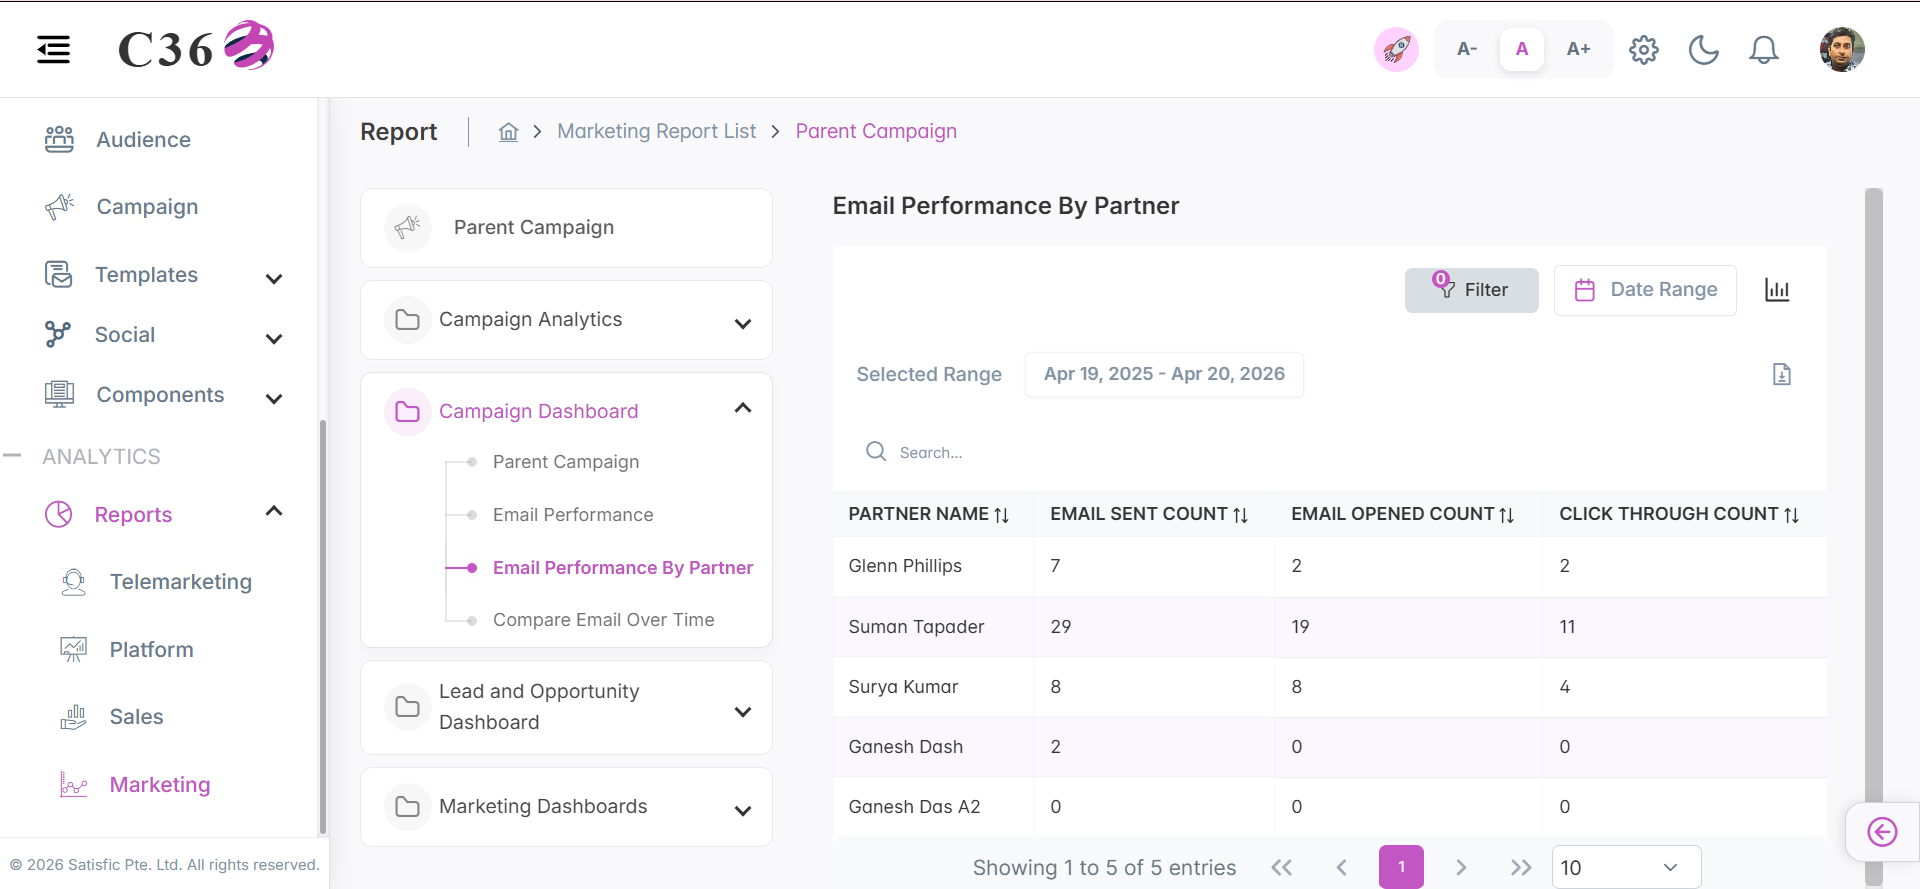
🤝 Email Performance By Partner
Analyzes the success of email marketing campaigns distributed across various partner channels.
- 📊 Chart View
- 📋 Table View
Click to see quick actions
- Can Toggle between Table view and Chart view.
- Can Filter the chart by selecting and unselecting the color buttons.
- Can Export/Download the report.
- Can Filter by Date Range.
- Can Filter by Country, Company and Users.
- Toggle between Line chart and Bar chart.
- Save the Chart as an image.
- Can Restore the bar chart.
Click to see quick actions
- Can Toggle between Table view and Chart view.
- Can Export/Download the report.
- Can perform search in the table.
- Can Filter by Date Range.
- Can Filter by Country, Company and Users.
🧾 Columns included in the table view
| Field Name | Description |
|---|---|
| Partner Name | Name of the partner associated with the campaign or email activity. |
| Email Sent Count | Total number of emails successfully sent under the partner’s campaign. |
| Email Open Count | Number of emails opened by recipients, indicating engagement with the partner’s communication. |
| Click Through Count | Number of clicks on links within the emails sent by the partner, reflecting user interaction. |
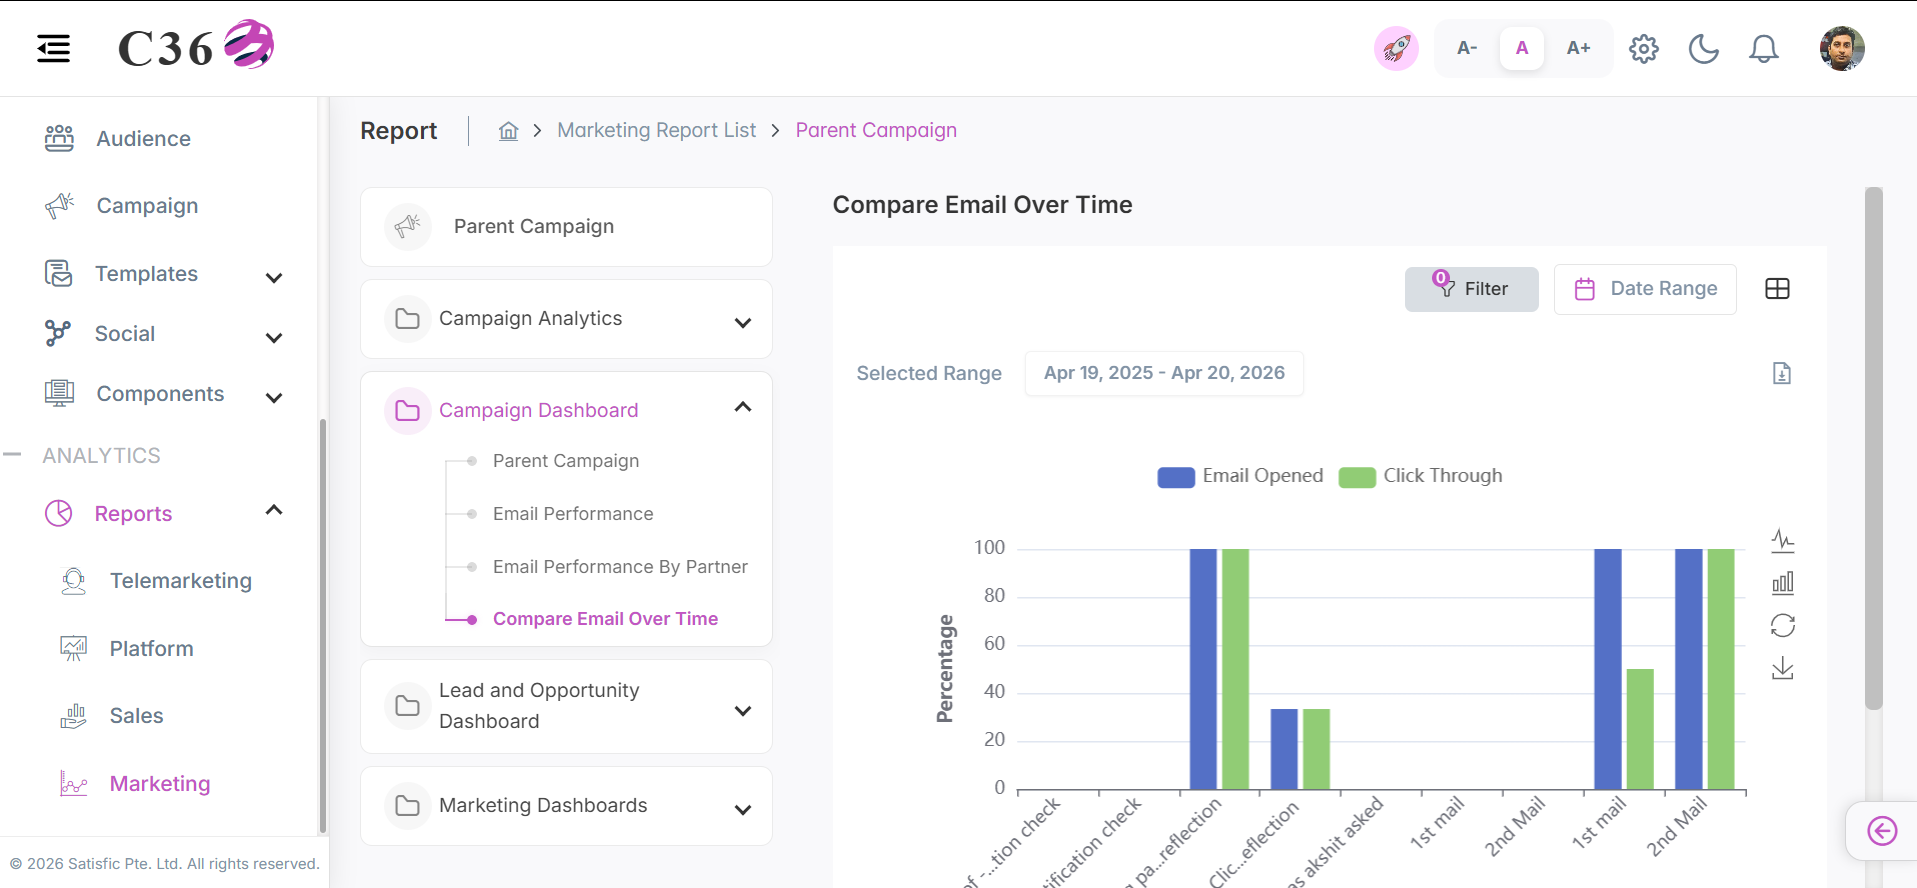
📈 Compare Email Over Time
Visualizes historical email engagement trends to identify long-term patterns in campaign performance.
- 📊 Chart View
- 📋 Table View
Click to see quick actions
- Can Toggle between Table view and Chart view.
- Can Filter the chart by selecting and unselecting the color buttons.
- Can Export/Download the report.
- Can Filter by Date Range.
- Can Filter by Country, Company and Users.
- Toggle between Line chart and Bar chart.
- Save the Chart as an image.
- Can Restore the bar chart.
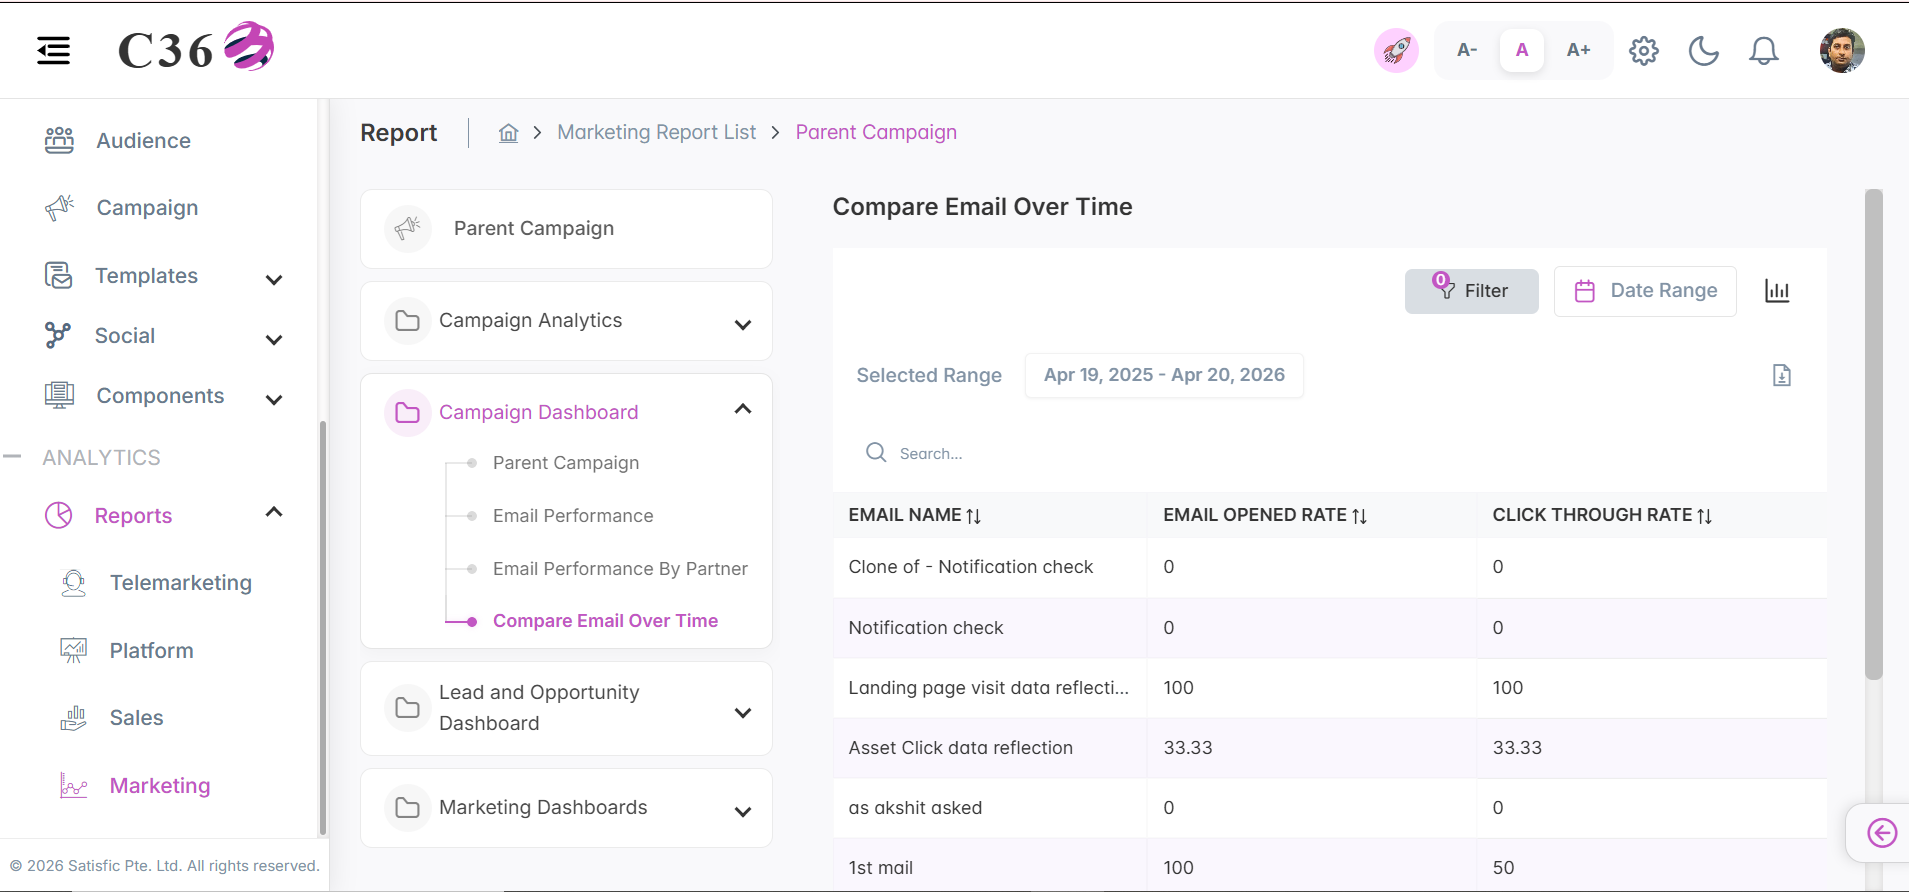
Click to see quick actions
- Can Toggle between Table view and Chart view.
- Can Export/Download the report.
- Can perform search in the table.
- Can Filter by Date Range.
- Can Filter by Country, Company and Users.
🧾 Columns included in the table view
| Field Name | Description |
|---|---|
| Email Name | Unique identifier assigned to an email campaign or template for tracking and reference. |
| Email Open Rate | Percentage of recipients who opened the email, indicating the effectiveness of the subject line and timing. |
| Click Through Rate | Percentage of recipients who clicked on links within the email, reflecting engagement and content relevance. |
━━━━━━━━━━━━━━━━━━━━━━━━━━━━━━━━━━━━━━━━━━━━━━━━━━━━━━━━━━━━━━━━━━━━━━━━━━━━━━━━━━━━━
🤝 Lead and Opportunity Dashboard
The Lead & Opportunity Dashboards Reports track lead progression and sales opportunities within campaigns. Reports include:
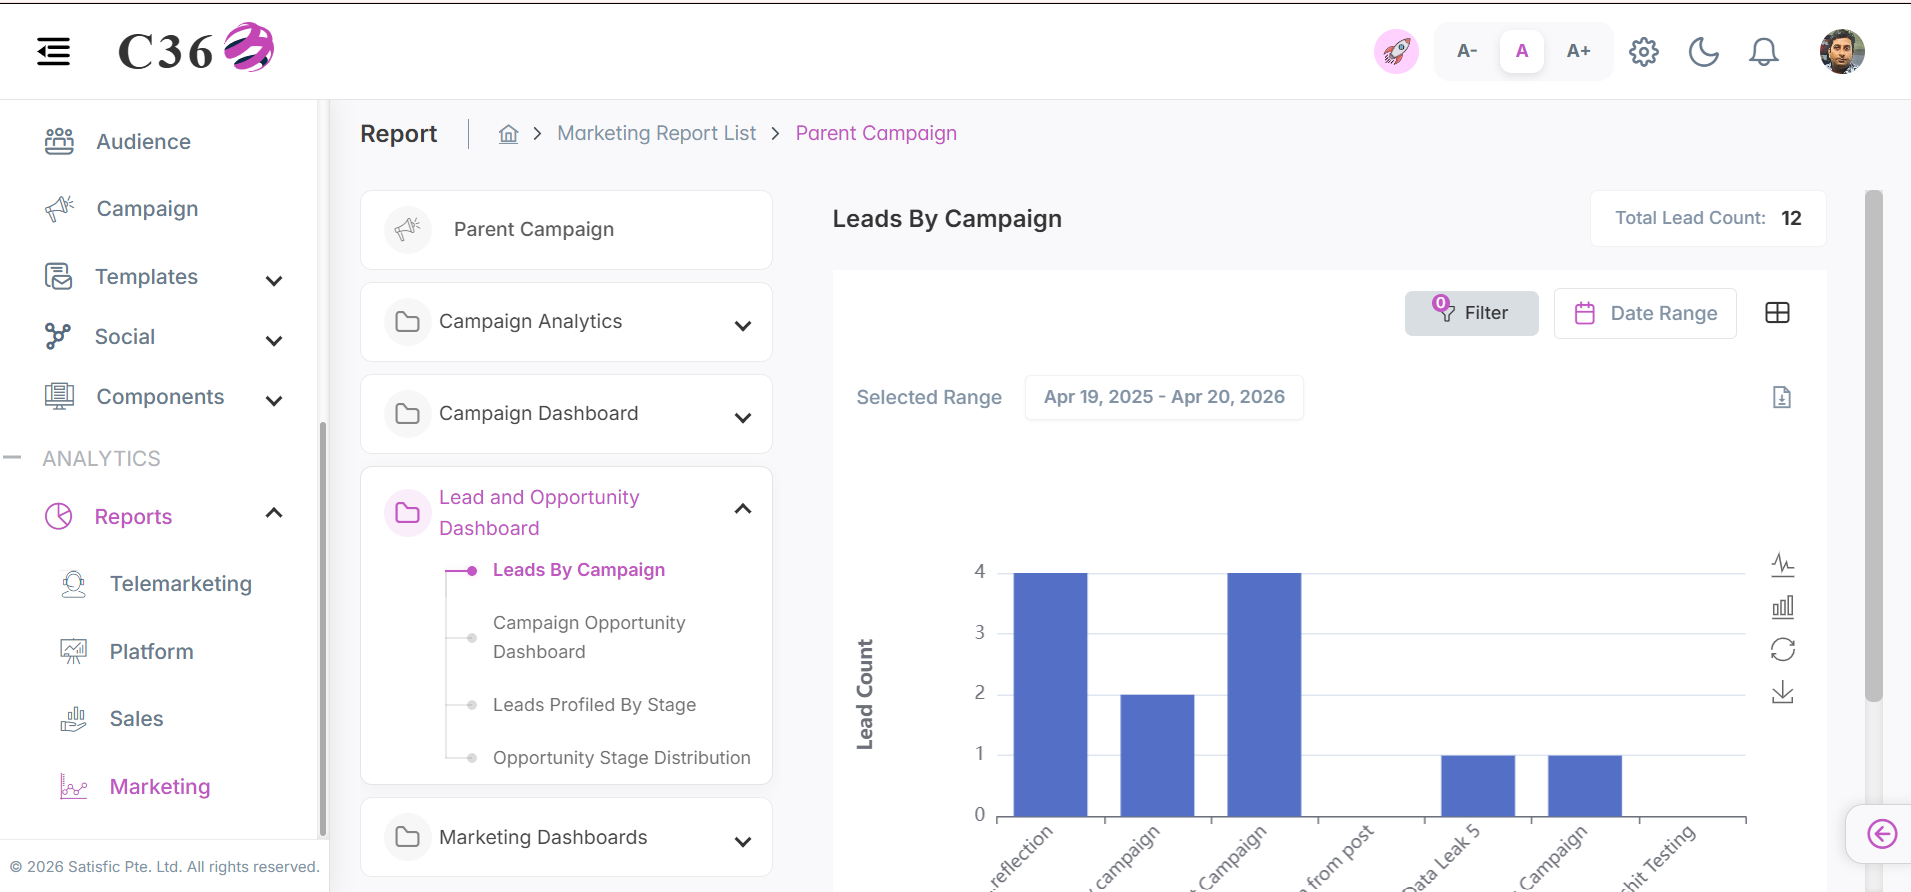
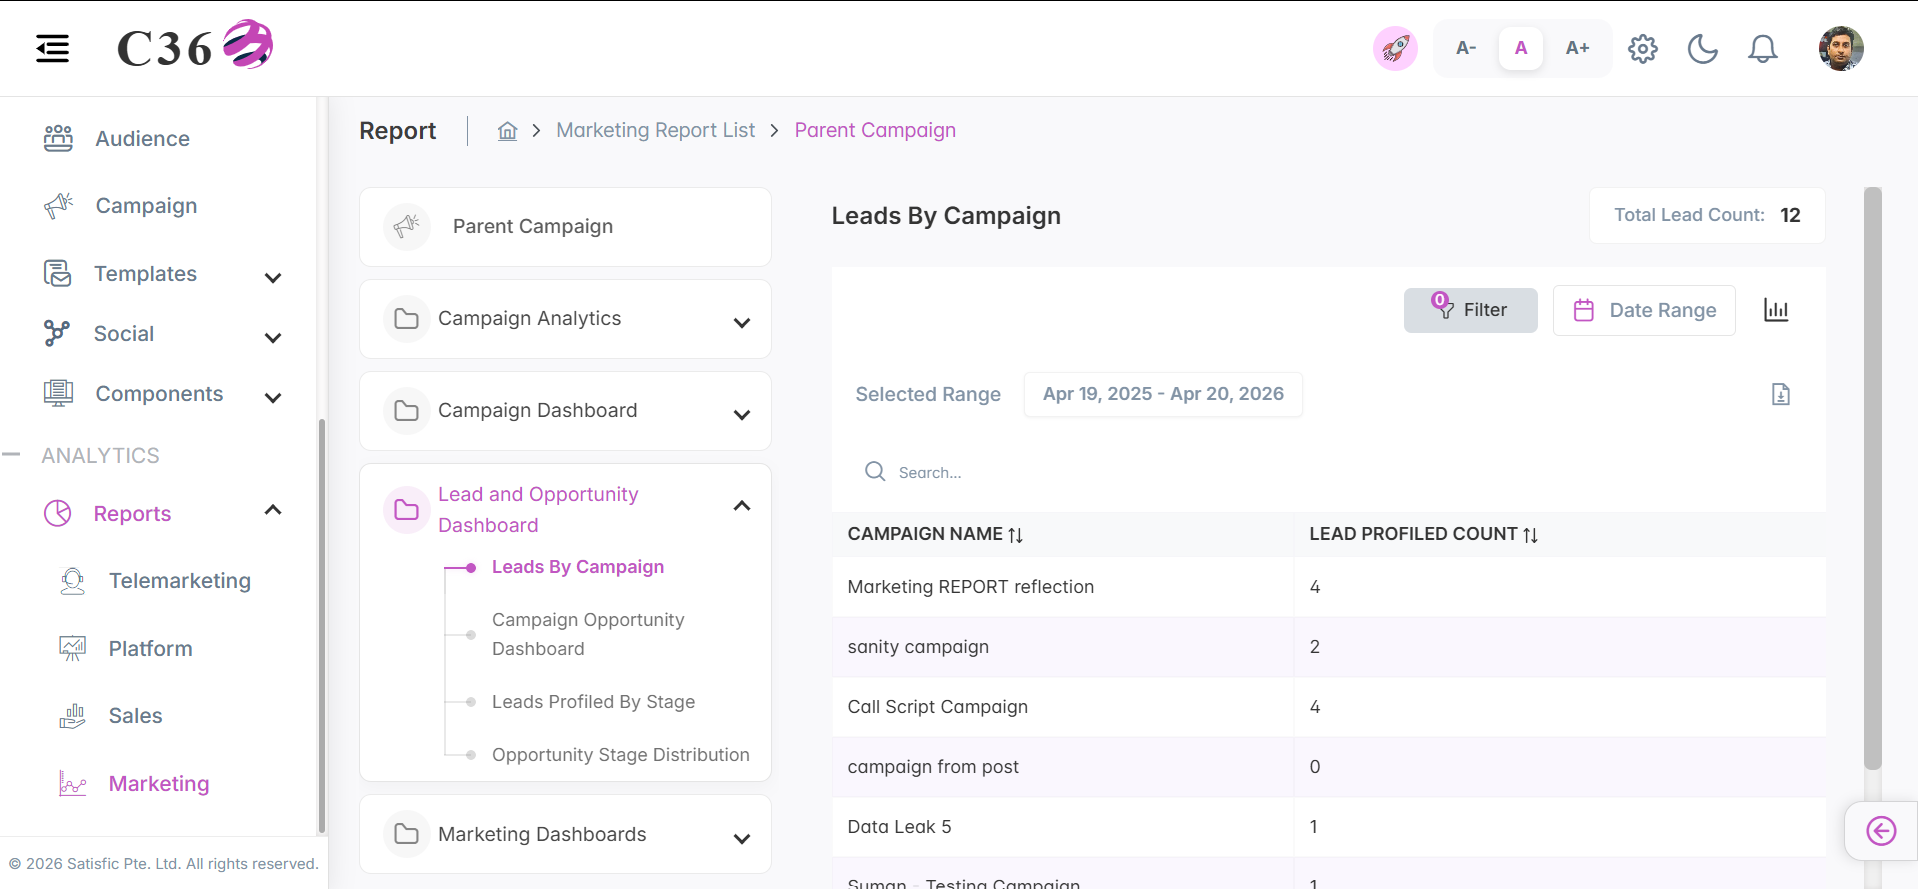
🎯 Leads By Campaign
Breaks down lead generation performance to identify which specific campaigns are driving the most pipeline growth.
- 📊 Chart View
- 📋 Table View
Click to see quick actions
- Can Toggle between Table view and Chart view.
- Can Export/Download the report.
- Can Filter by Date Range.
- Can Filter by Country, Company and Users.
- Toggle between Line chart and Bar chart.
- Save the Chart as an image.
- Can Restore the bar chart.
Click to see quick actions
- Can Toggle between Table view and Chart view.
- Can Export/Download the report.
- Can perform search in the table.
- Can Filter by Date Range.
- Can Filter by Country, Company and Users.
🧾 Columns included in the table view
| Field Name | Description |
|---|---|
| Campaign Name | Unique name assigned to identify and track a marketing campaign. |
| Lead Profiled Count | Number of leads that have been captured, enriched, or profiled through campaign interactions. |
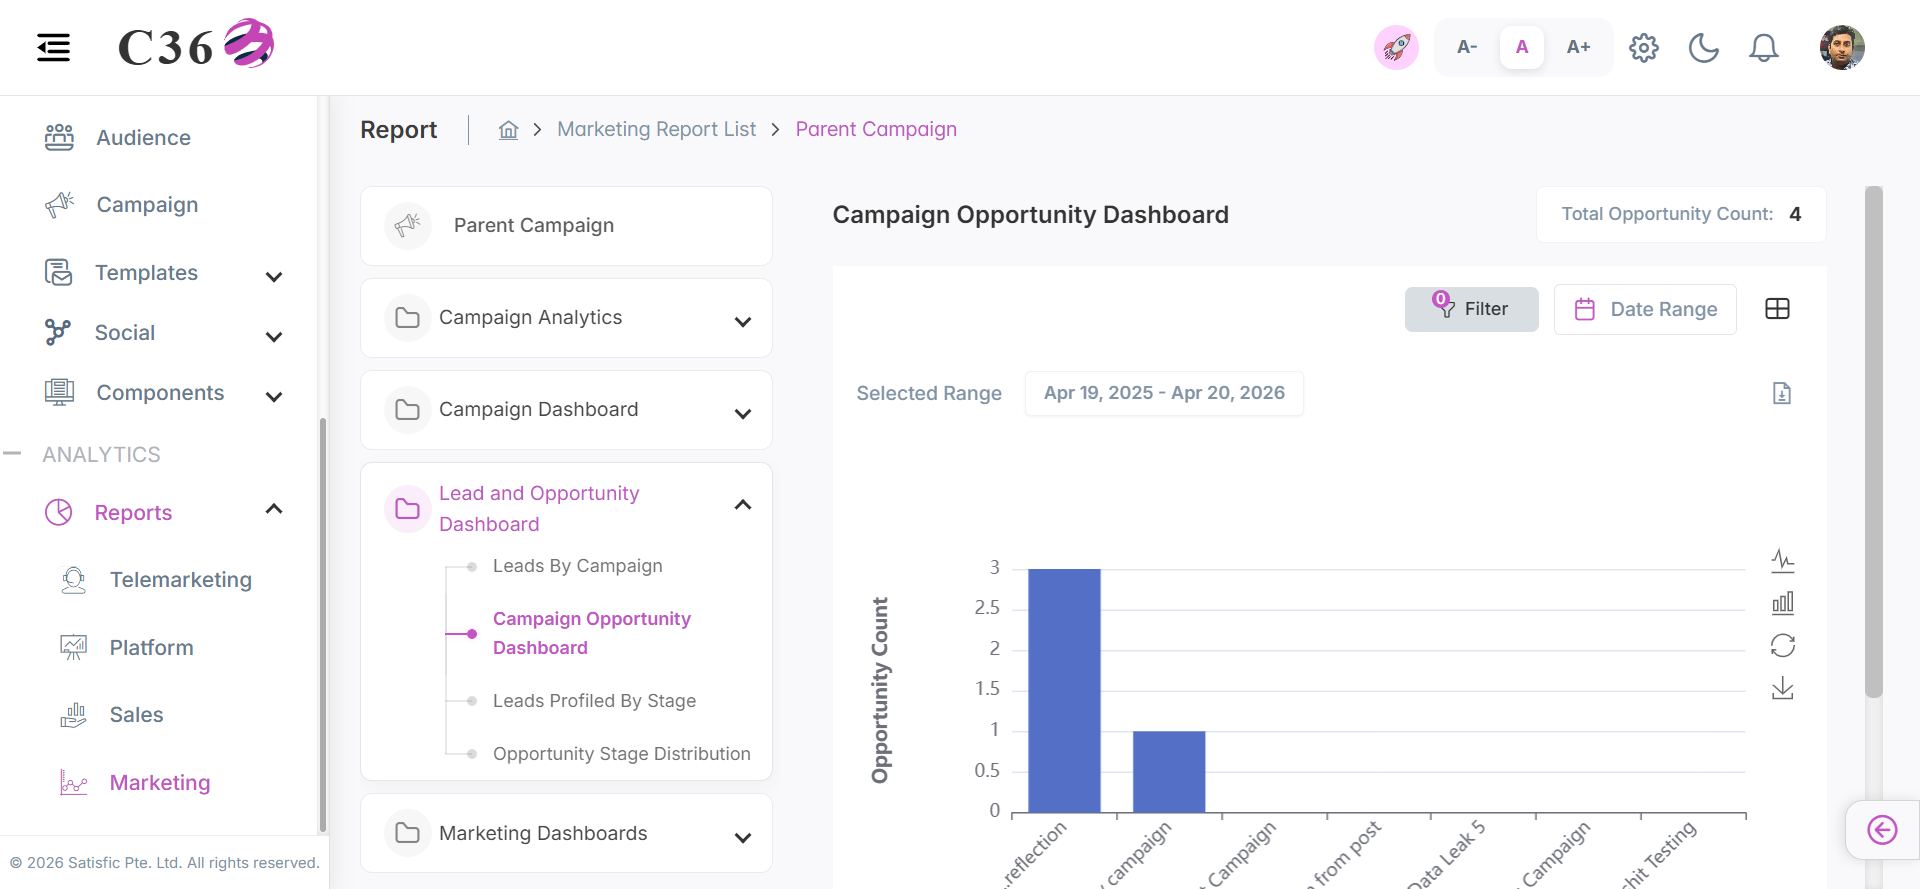
📊 Campaign Opportunity Dashboard
Monitors the potential value and progression of sales opportunities generated directly from marketing efforts.
- 📊 Chart View
- 📋 Table View
Click to see quick actions
- Can Toggle between Table view and Chart view.
- Can Export/Download the report.
- Can Filter by Date Range.
- Can Filter by Country, Company and Users.
- Toggle between Line chart and Bar chart.
- Save the Chart as an image.
- Can Restore the bar chart.
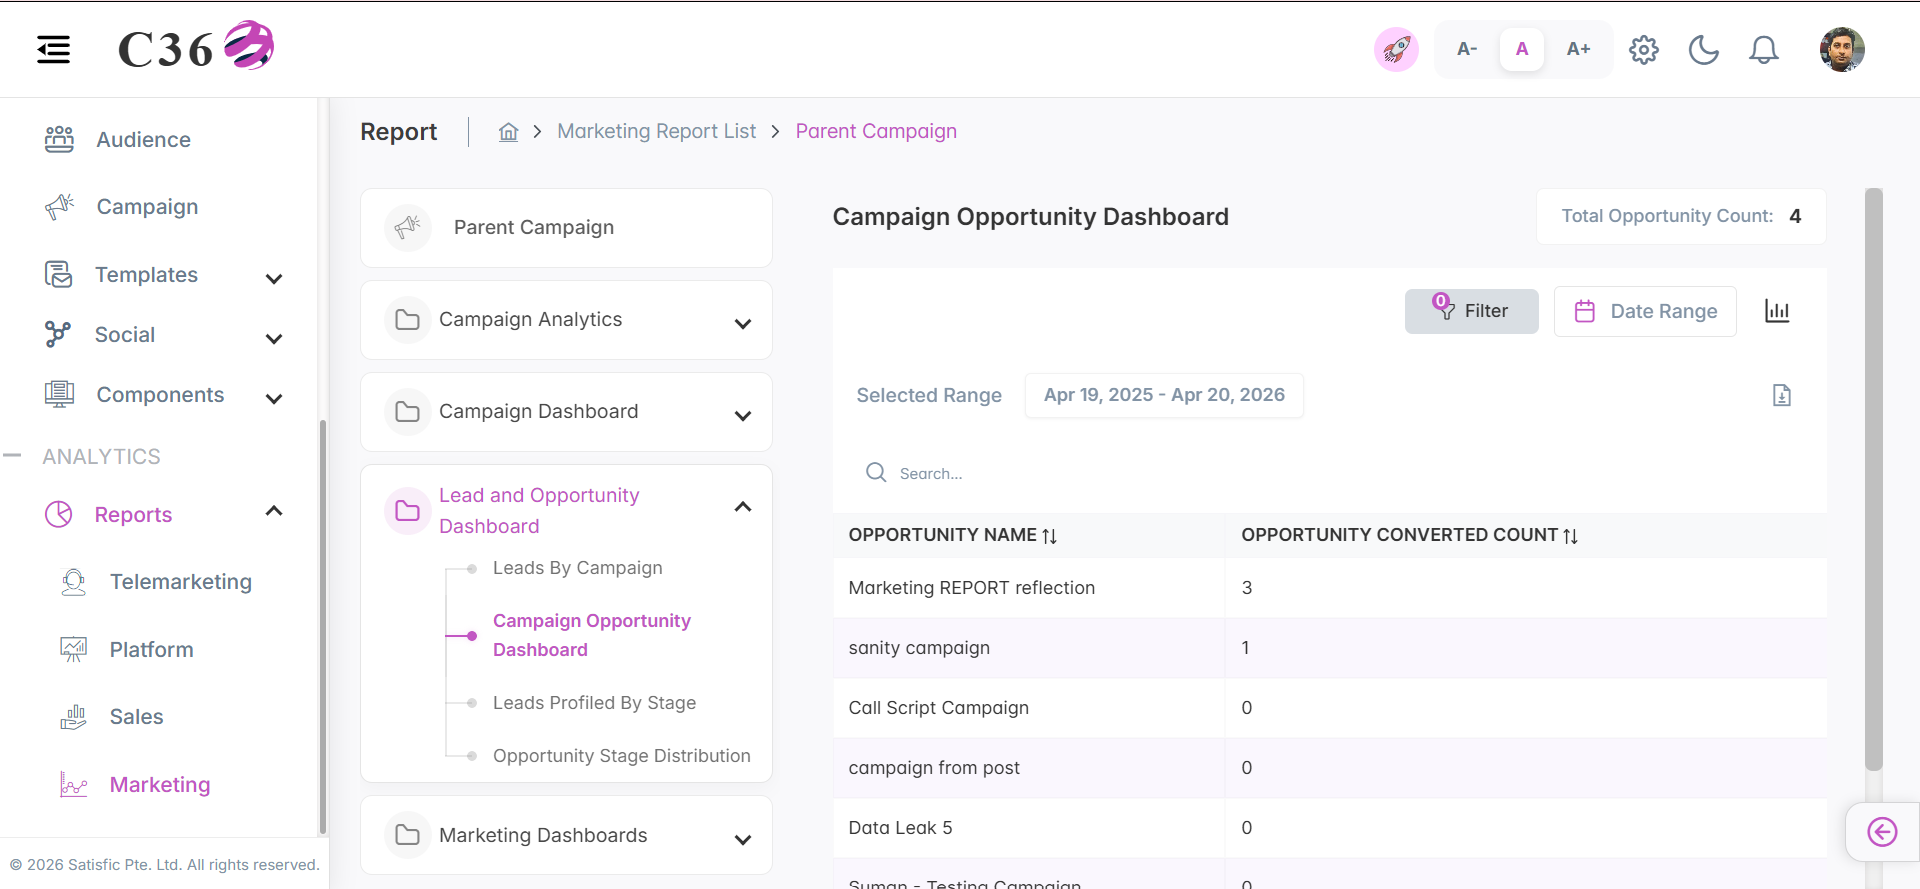
Click to see quick actions
- Can Toggle between Table view and Chart view.
- Can Export/Download the report.
- Can perform search in the table.
- Can Filter by Date Range.
- Can Filter by Country, Company and Users.
🧾 Columns included in the table view
| Field Name | Description |
|---|---|
| Opportunity Name | Unique identifier assigned to a sales opportunity for tracking and management. |
| Opportunity Converted Count | Total number of opportunities successfully converted, indicating closed or progressed deals. |
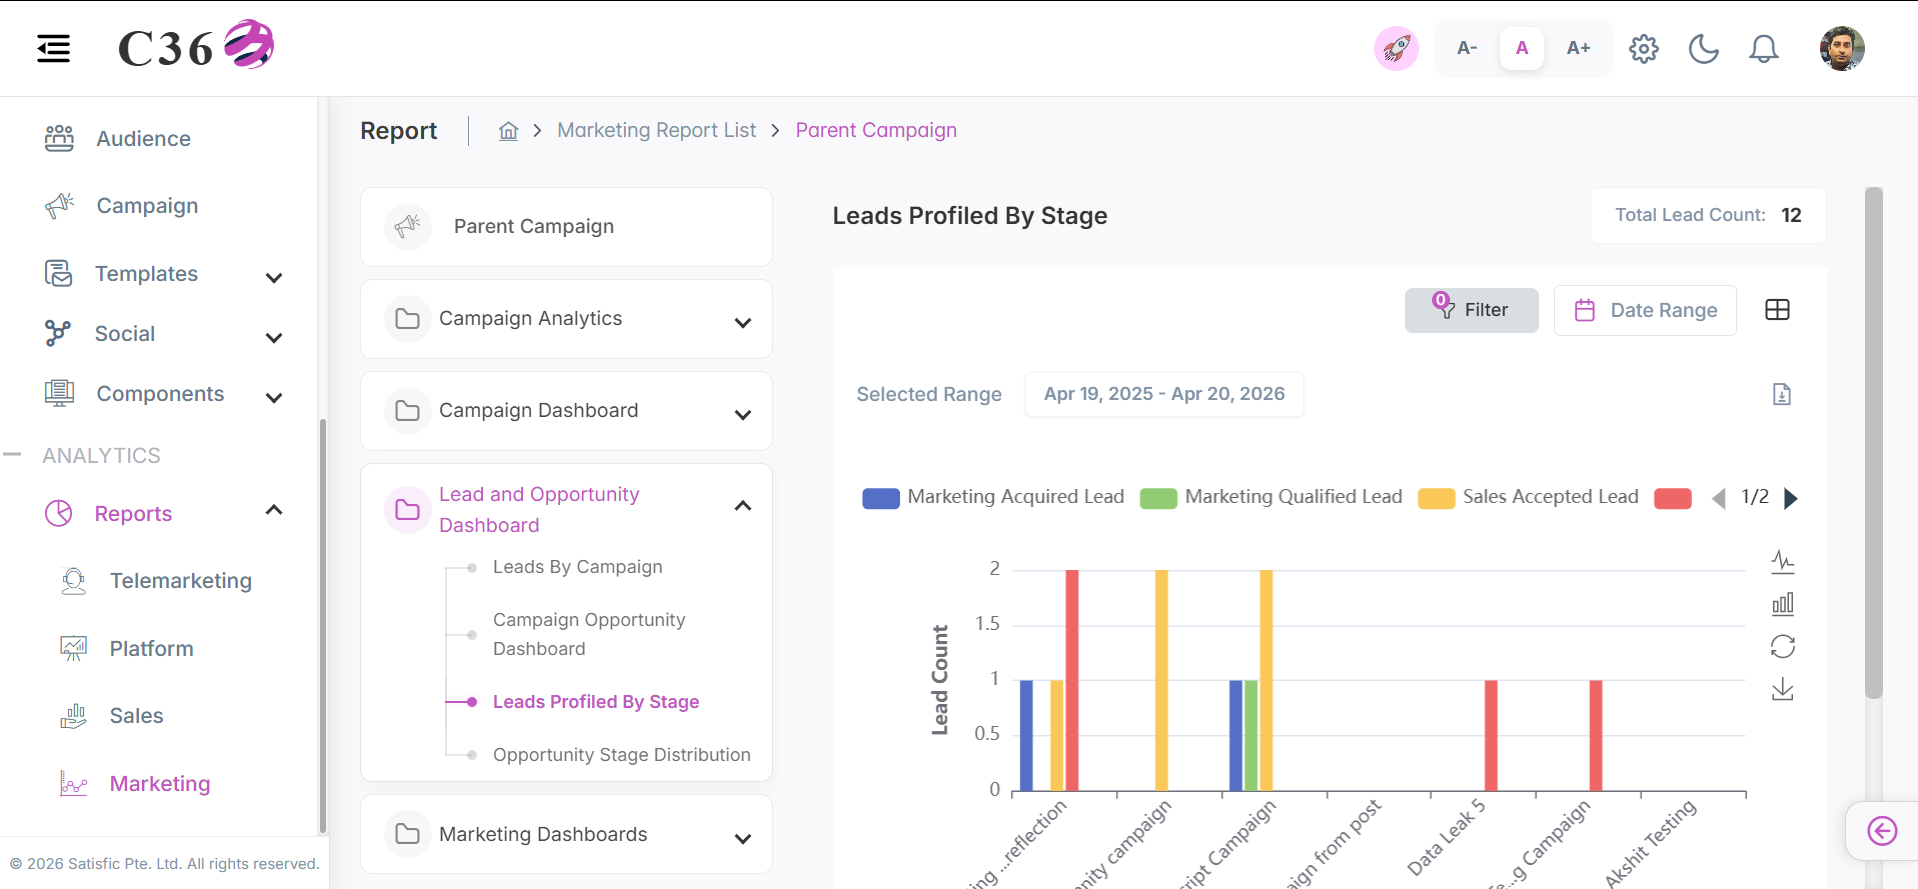
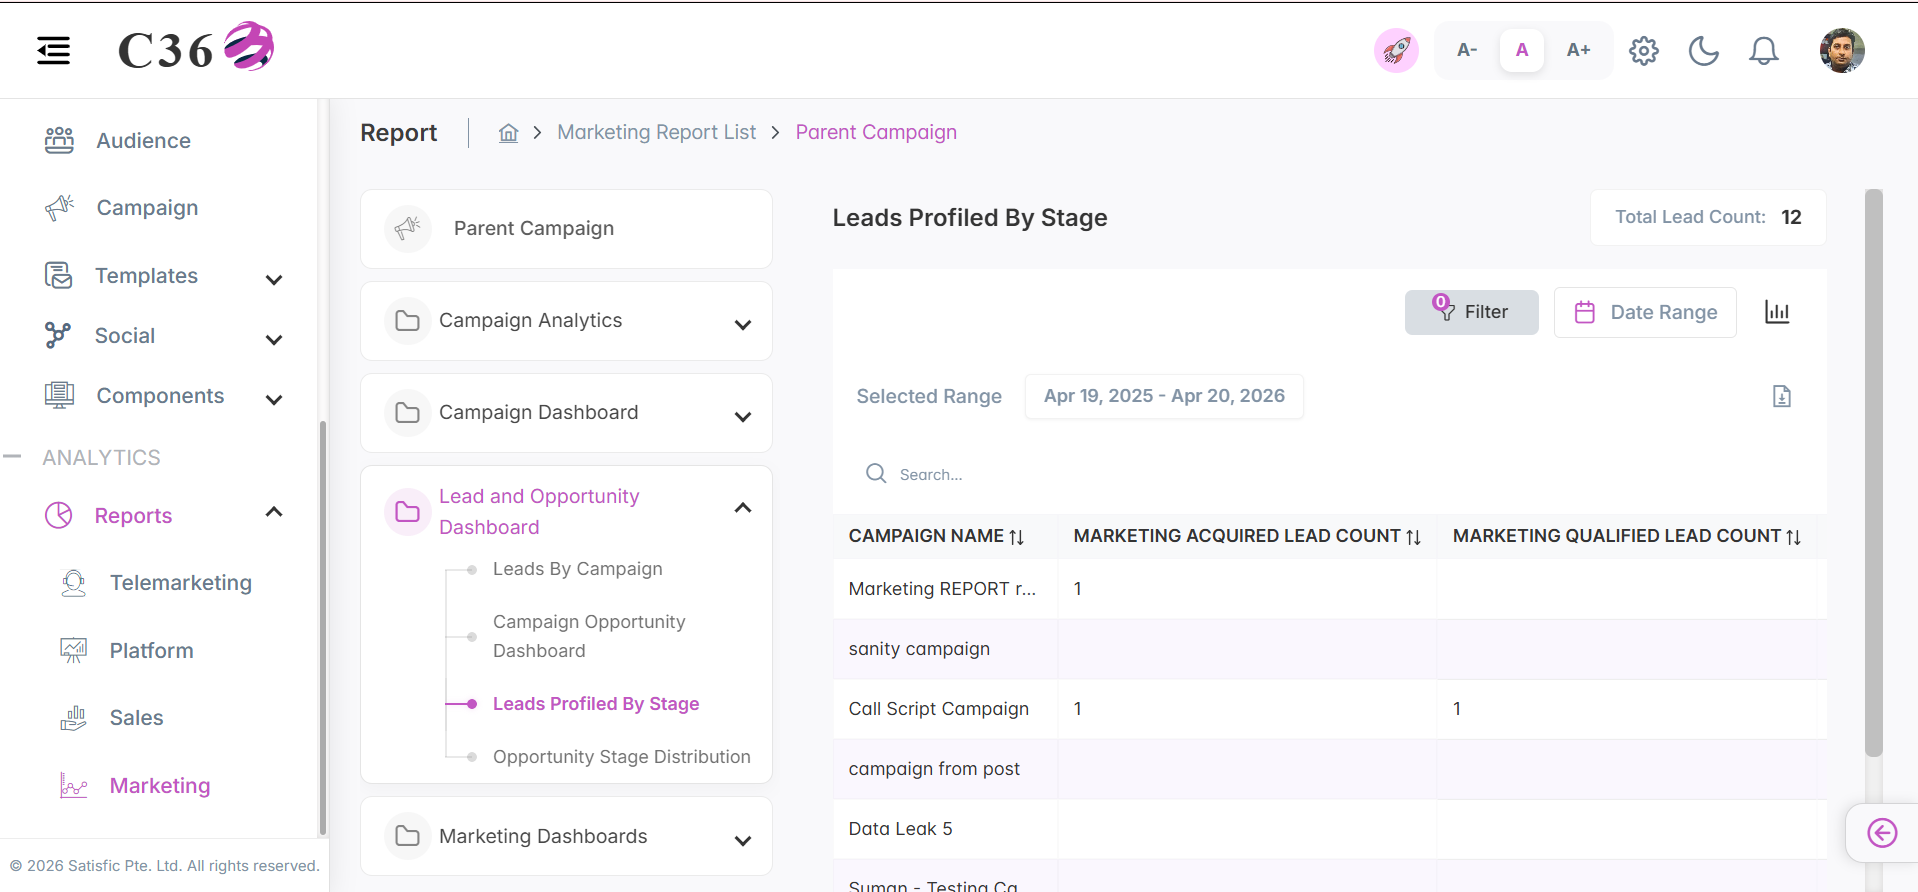
🔍 Leads Profiled By Stage
Provides a snapshot of lead distribution across various funnel stages to identify conversion bottlenecks.
- 📊 Chart View
- 📋 Table View
Click to see quick actions
- Can Toggle between Table view and Chart view.
- Can Filter the chart by selecting and unselecting the color buttons.
- Can Export/Download the report.
- Can Filter by Date Range.
- Can Filter by Country, Company and Users.
- Toggle between Line chart and Bar chart.
- Save the Chart as an image.
- Can Restore the bar chart.
Click to see quick actions
- Can Toggle between Table view and Chart view.
- Can Export/Download the report.
- Can perform search in the table.
- Can Filter by Date Range.
- Can Filter by Country, Company and Users.
🧾 Columns included in the table view
| Field Name | Description |
|---|---|
| Campaign Name | Unique name assigned to identify and track a marketing campaign. |
| Marketing Acquired Lead Count | Number of leads generated or acquired through marketing efforts for the campaign. |
| Marketing Qualified Lead Count | Number of leads that meet predefined marketing qualification criteria. |
| Sales Accepted Lead Count | Number of marketing-qualified leads accepted by the sales team for further follow-up. |
| Sales Qualified Lead Count | Number of leads validated by sales as having high potential for conversion. |
| Tele-Sales Meeting Count | Number of meetings or calls scheduled and conducted by the tele-sales team. |
| Sales Accepted Opportunity Count | Number of opportunities accepted by sales for active pursuit. |
| Total Lead Profiled Count | Total number of leads that have been captured, enriched, or profiled during the campaign. |
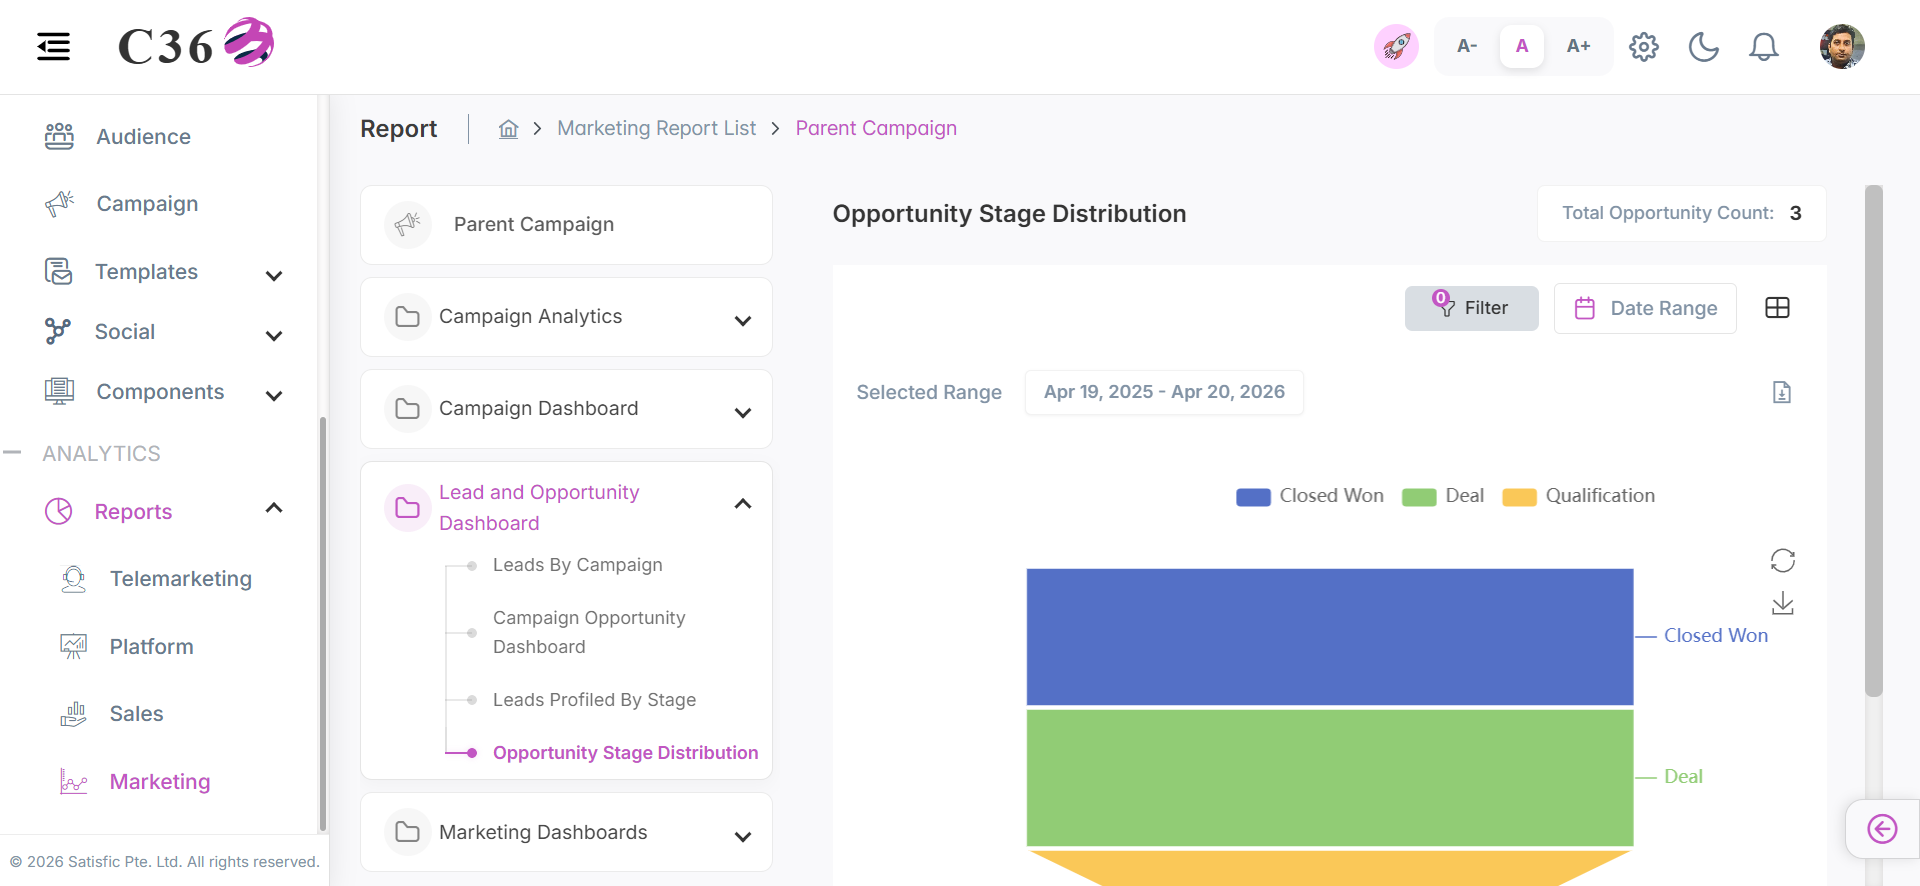
📉 Opportunity Stage Distribution
Visualizes the concentration of opportunities within the pipeline stages to aid in revenue forecasting.
- 📊 Chart View
- 📋 Table View
Click to see quick actions
- Can Toggle between Table view and Chart view.
- Can Filter the chart by selecting and unselecting the color buttons.
- Can Export/Download the report.
- Can Filter by Date Range.
- Can Filter by Country, Company and Users.
- Save the Chart as an image.
- Can Restore the bar chart.
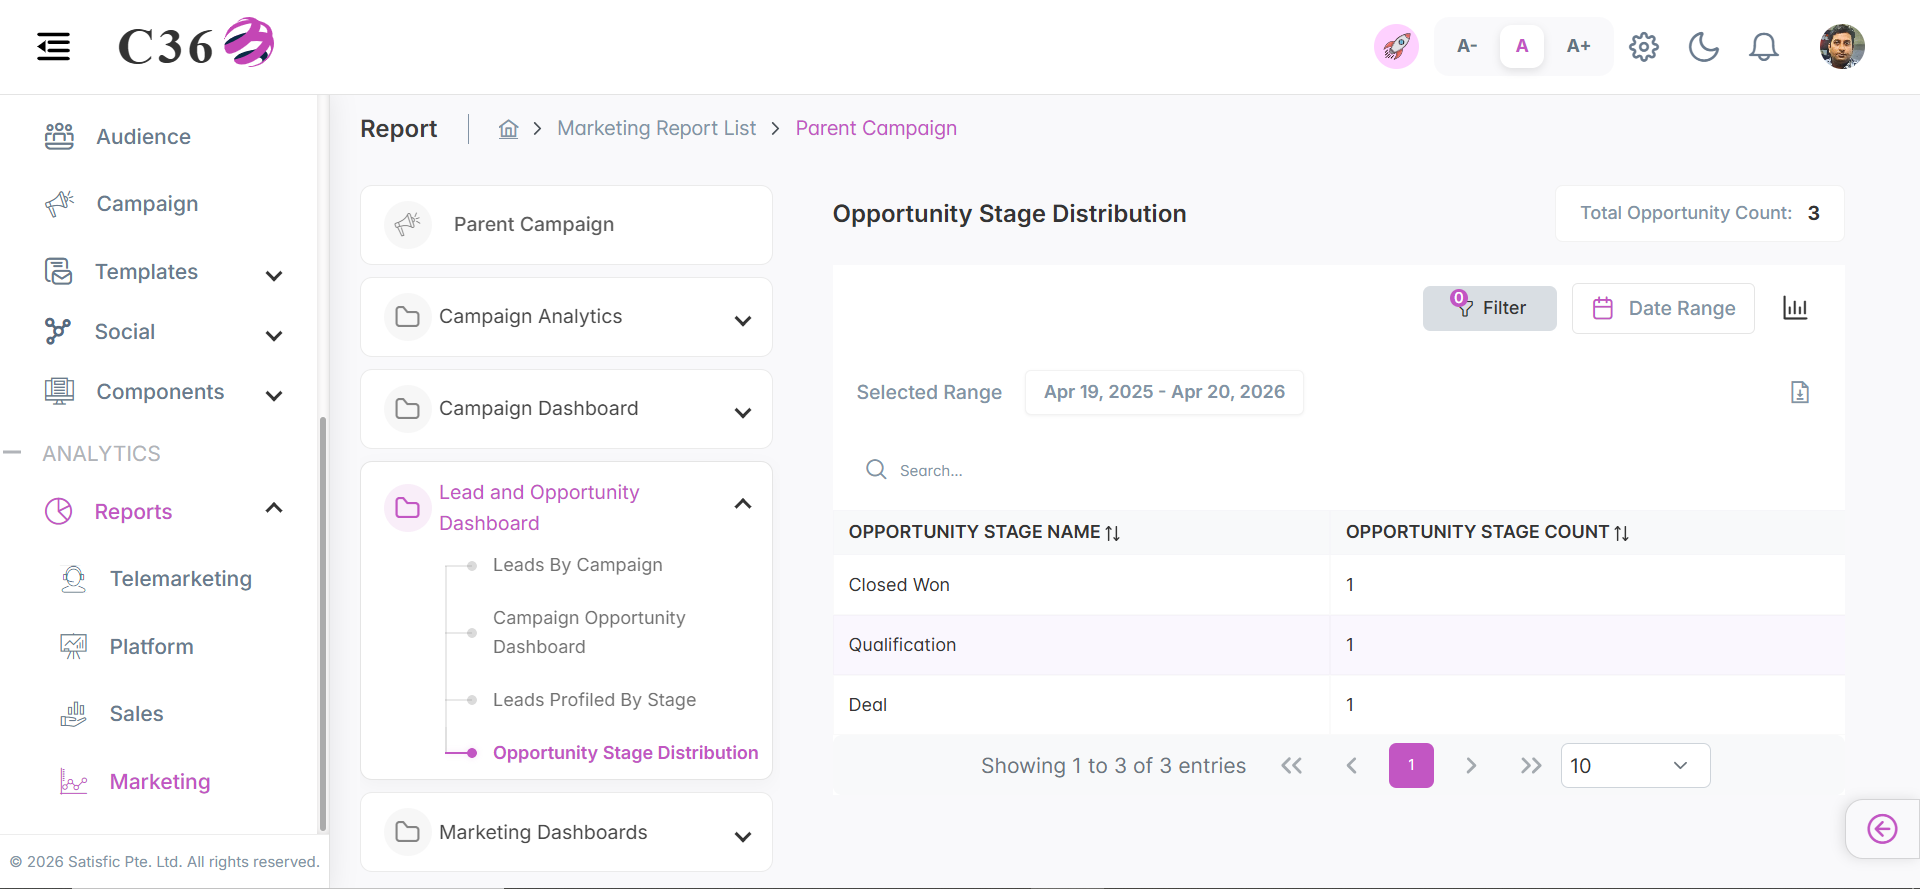
Click to see quick actions
- Can Toggle between Table view and Chart view.
- Can Export/Download the report.
- Can perform search in the table.
- Can Filter by Date Range.
- Can Filter by Country, Company and Users.
🧾 Columns included in the table view
| Field Name | Description |
|---|---|
| Opportunity Stage Name | Name of the current stage in the sales pipeline representing the progress of an opportunity. |
| Opportunity Stage Count | Total number of opportunities present in each stage of the sales pipeline. |
━━━━━━━━━━━━━━━━━━━━━━━━━━━━━━━━━━━━━━━━━━━━━━━━━━━━━━━━━━━━━━━━━━━━━━━━━━━━━━━━━━━━━
📊 Marketing Dashboard
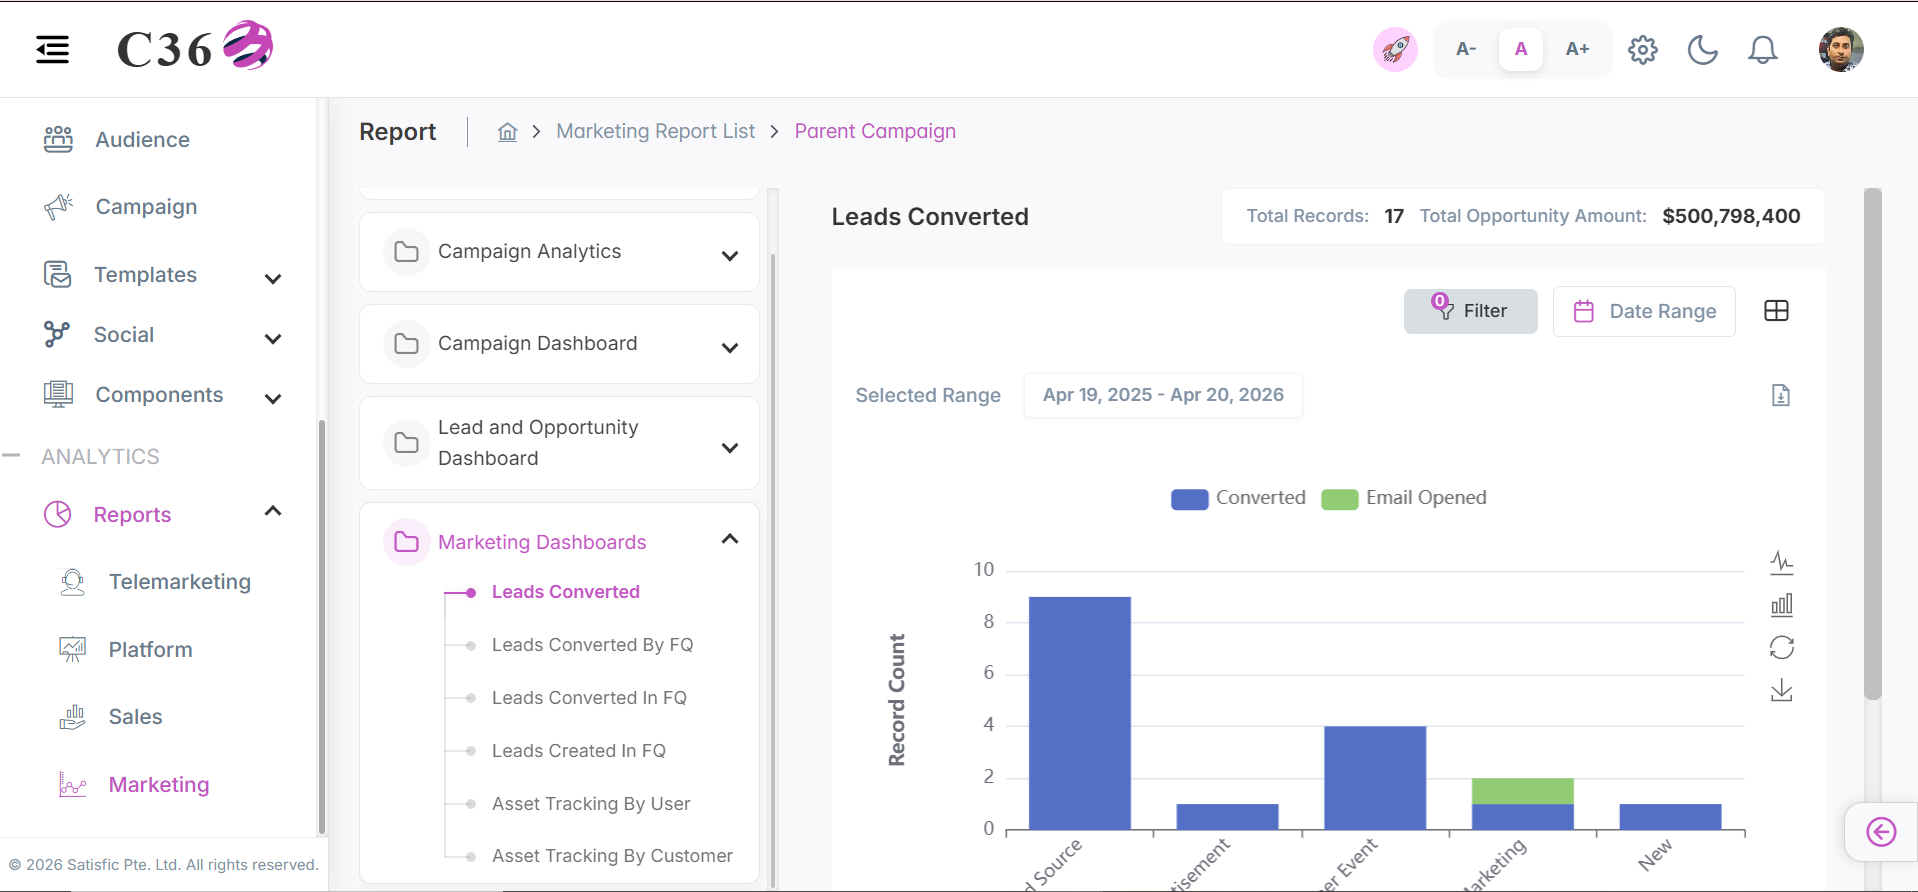
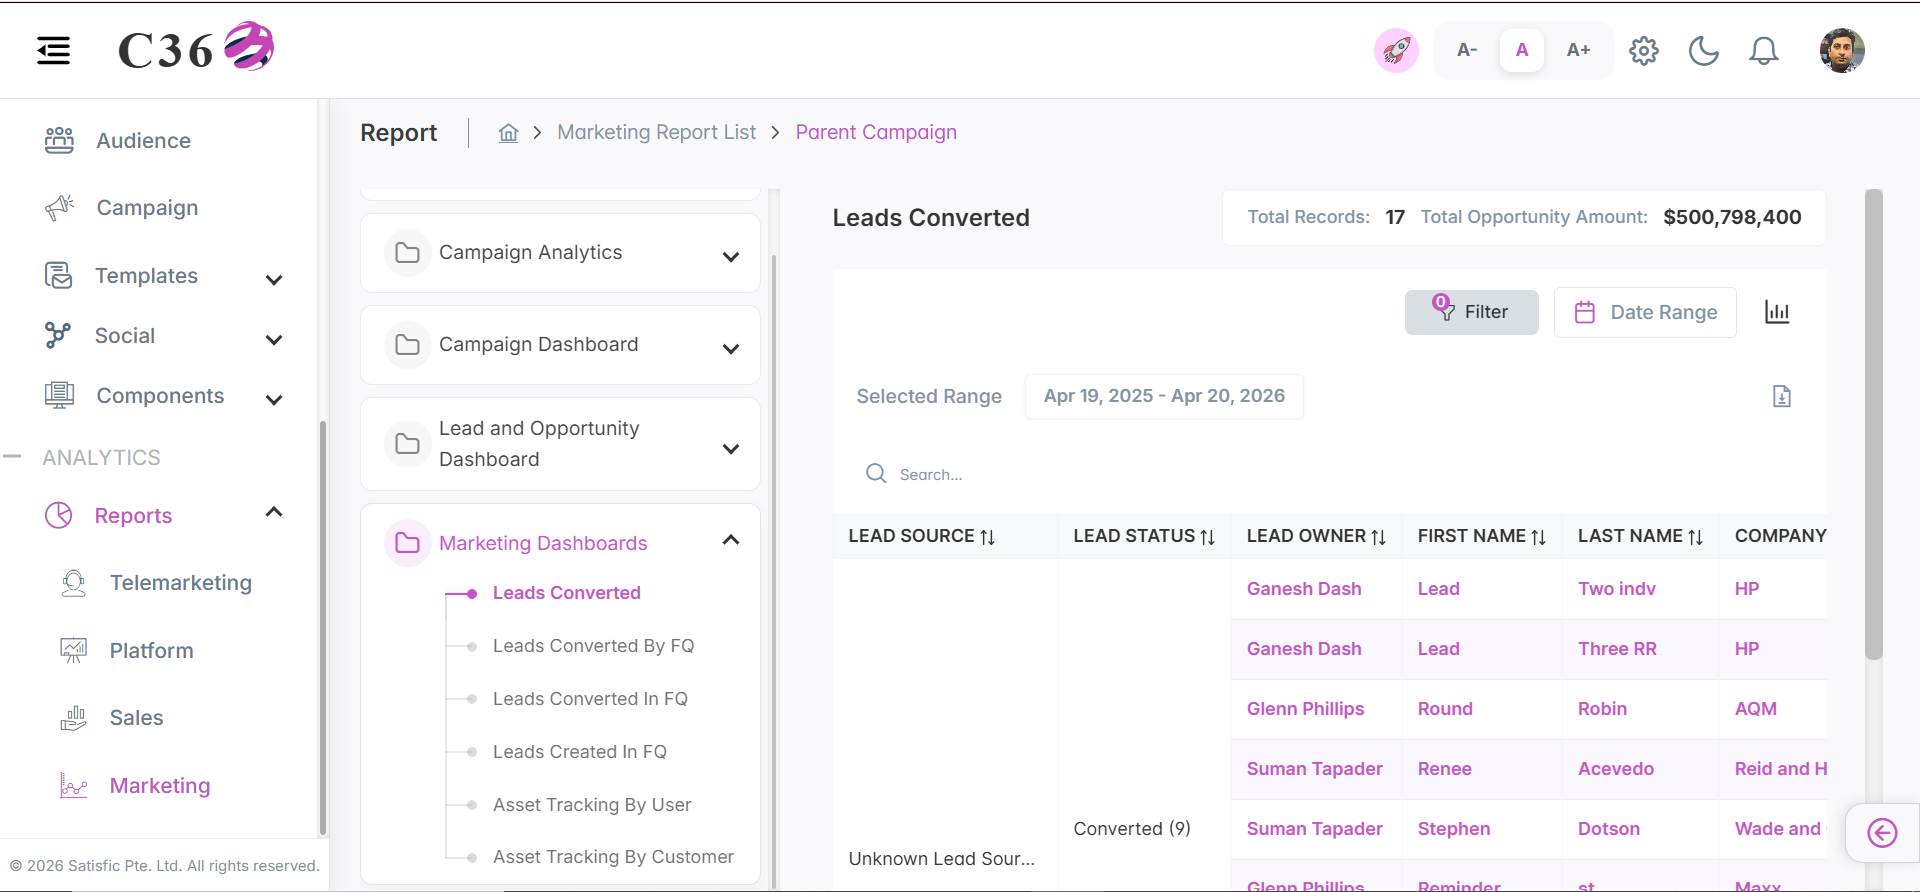
✅ Leads Converted
Tracks the total volume of generated leads that have successfully transitioned into qualified opportunities or customers.
- 📊 Chart View
- 📋 Table View
Click to see quick actions
- Can Toggle between Table view and Chart view.
- Can Export/Download the report.
- Can Filter the chart by selecting and unselecting the color buttons.
- Can Filter by Date Range.
- Can Filter by Country, Company and Users.
- Toggle between Line chart and Bar chart.
- Save the Chart as an image.
- Can Restore the bar chart.
Click to see quick actions
- Can Toggle between Table view and Chart view.
- Can Export/Download the report.
- Can perform search in the table.
- Can Filter by Date Range.
- Can Filter by Country, Company and Users.
🧾 Columns included in the table view
| Field Name | Description |
|---|---|
| Lead Source | Origin of the lead, indicating how the lead was acquired (e.g., campaign, website, referral). |
| Lead Status | Current status of the lead within the lifecycle (e.g., New, Contacted, Qualified, Converted). |
| Lead Owner | User responsible for managing and following up with the lead. |
| First Name | First name of the lead or contact. |
| Last Name | Last name of the lead or contact. |
| Company/Account | Organization or company associated with the lead or opportunity. |
| Opportunity Amount | Estimated monetary value of the associated opportunity. |
| Created Date | Date when the record was initially created in the system. |
| Last Modified Date | Most recent date when the record was updated. |
| Converted Date | Date when the lead was successfully converted into an opportunity or customer. |
| Opportunity Owner | User responsible for managing the opportunity. |
| Opportunity Name | Unique name assigned to the opportunity for identification and tracking. |
| Opportunity: Account | Account associated with the opportunity. |
| Opportunity Close Date | Expected or actual date when the opportunity is closed. |
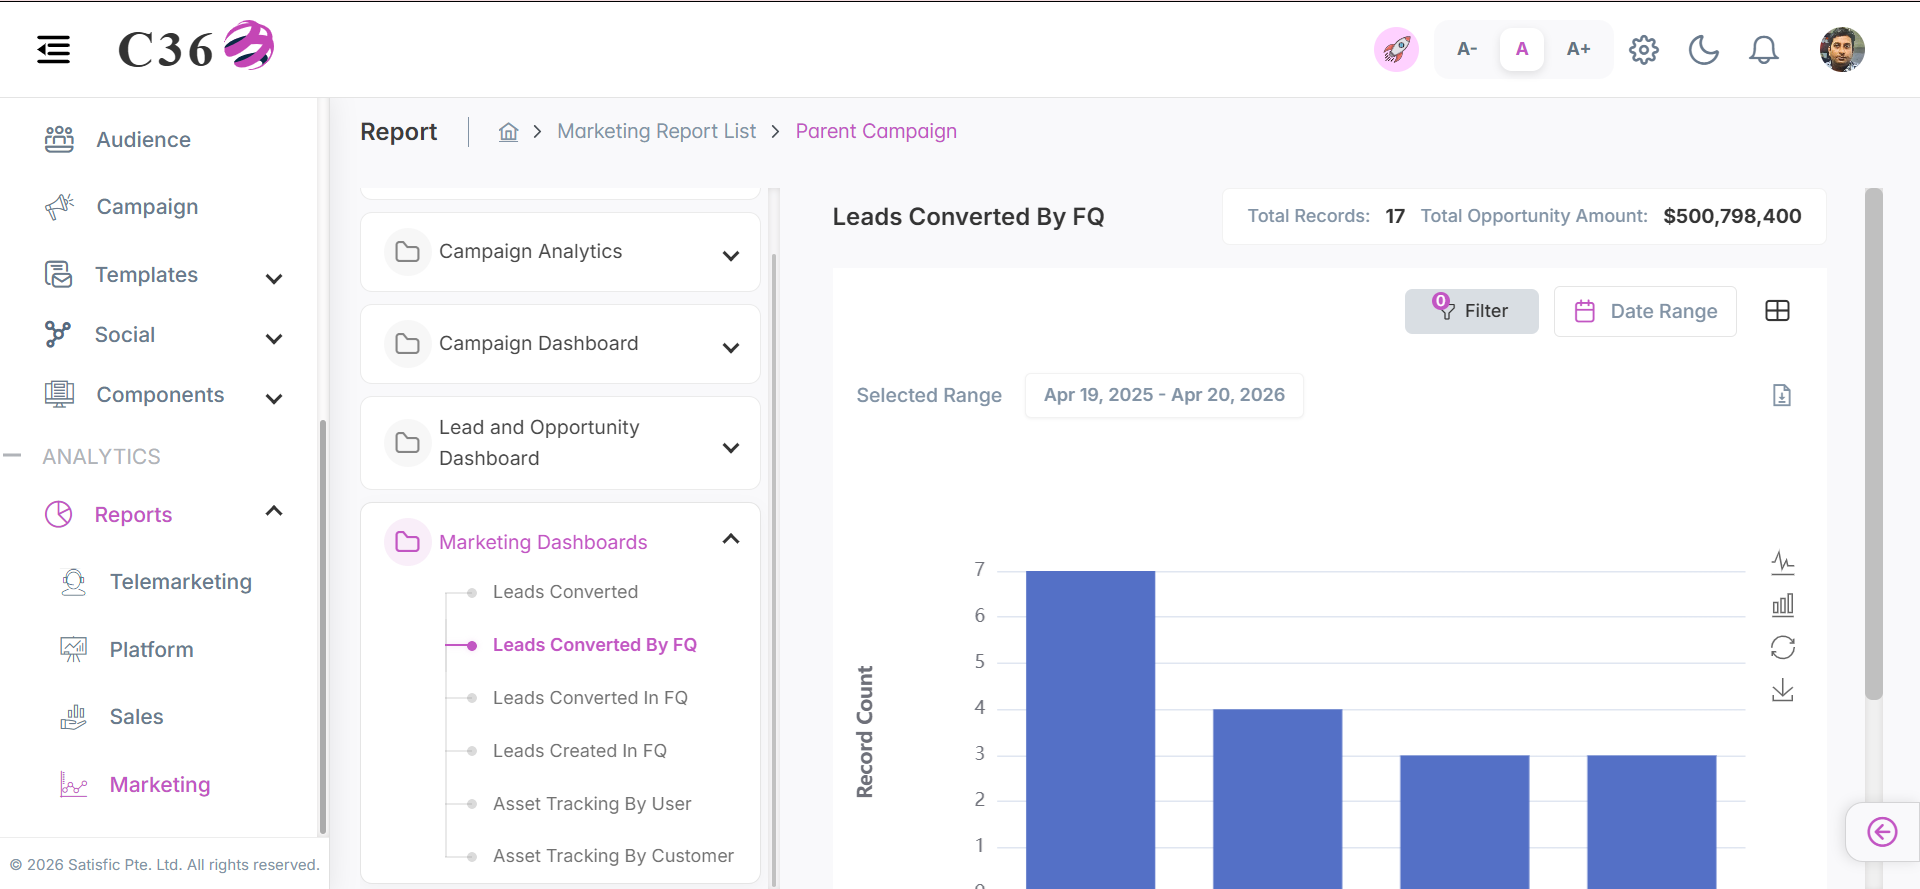
📅 Leads Converted By FQ
Analyzes the historical trend of successful lead conversions segmented by financial quarters.
- 📊 Chart View
- 📋 Table View
Click to see quick actions
- Can Toggle between Table view and Chart view.
- Can Export/Download the report.
- Can Filter by Date Range.
- Can Filter by Country, Company and Users.
- Toggle between Line chart and Bar chart.
- Save the Chart as an image.
- Can Restore the bar chart.
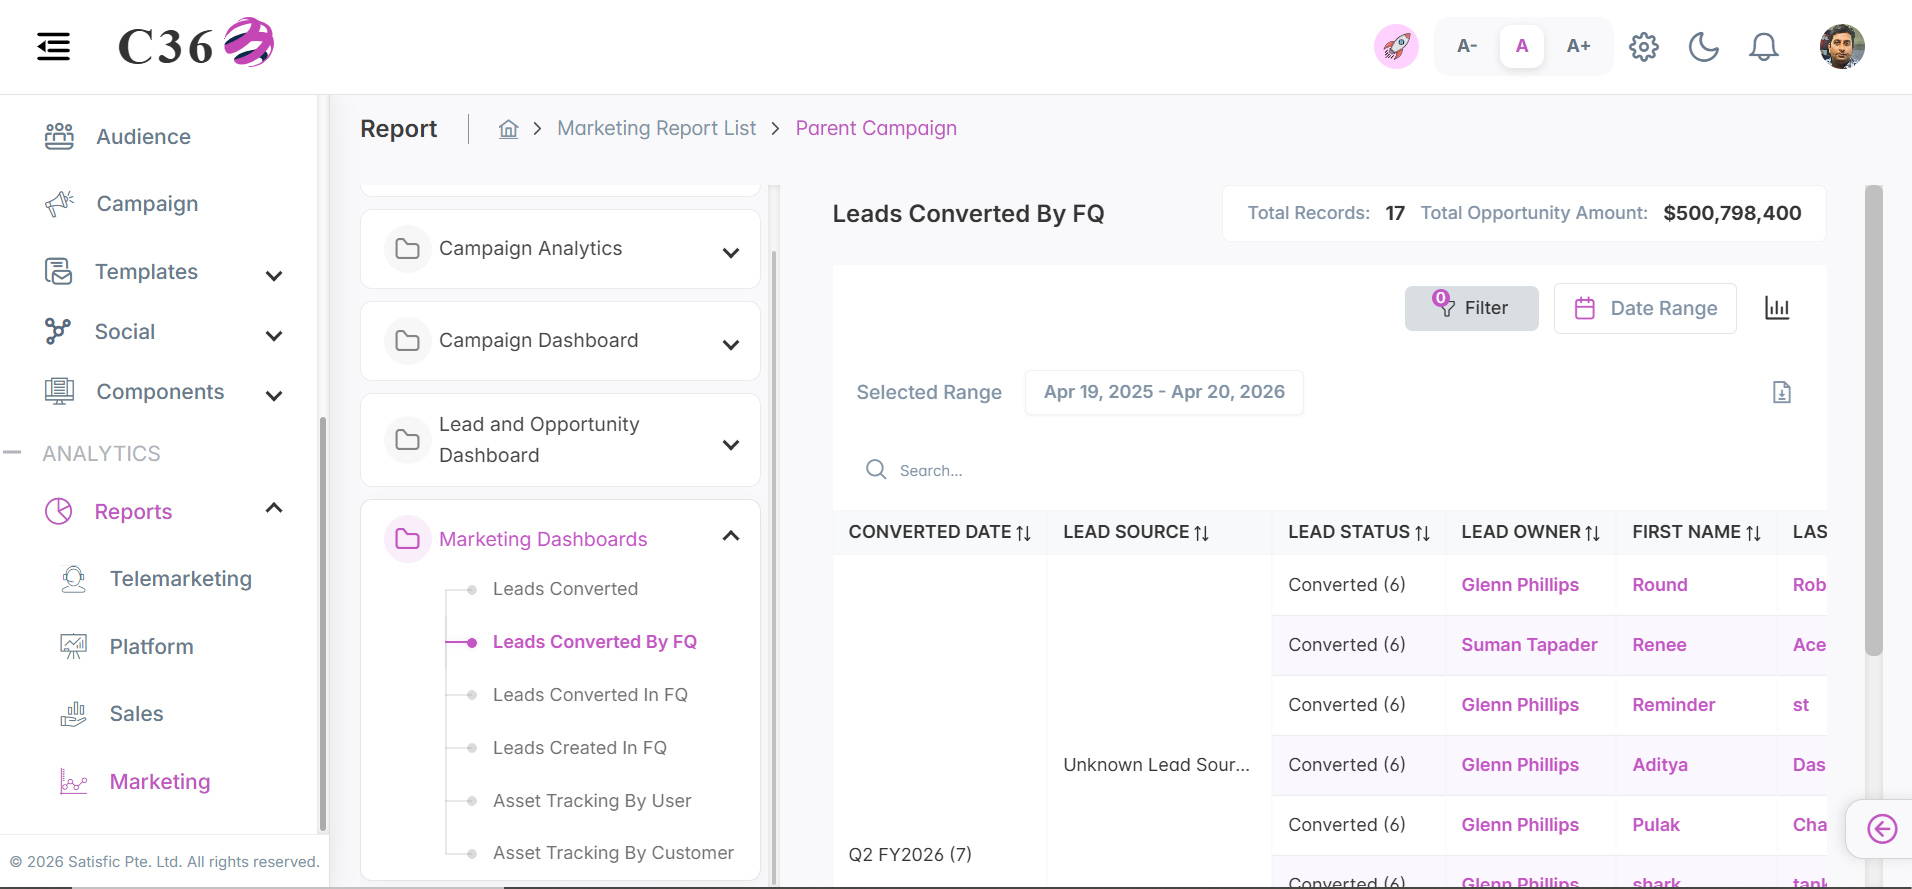
Click to see quick actions
- Can Toggle between Table view and Chart view.
- Can Export/Download the report.
- Can perform search in the table.
- Can Filter by Date Range.
- Can Filter by Country, Company and Users.
🧾 Columns included in the table view
| Field Name | Description |
|---|---|
| Converted Date | Date when the lead was successfully converted into an opportunity or customer. |
| Lead Source | Origin of the lead, indicating how it was acquired (e.g., campaign, website, referral). |
| Lead Status | Current stage of the lead in the lifecycle (e.g., New, Contacted, Qualified, Converted). |
| Lead Owner | User responsible for managing and following up with the lead. |
| First Name | First name of the lead or contact. |
| Last Name | Last name of the lead or contact. |
| Company/Account | Organization or company associated with the lead or opportunity. |
| Opportunity Amount | Estimated monetary value of the associated opportunity. |
| Created Date | Date when the record was initially created in the system. |
| Last Modified Date | Most recent date when the record was updated. |
| Opportunity Owner | User responsible for managing the opportunity. |
| Opportunity Name | Unique name assigned to the opportunity for identification and tracking. |
| Opportunity: Account | Account associated with the opportunity. |
| Opportunity Close Date | Expected or actual date when the opportunity is closed. |
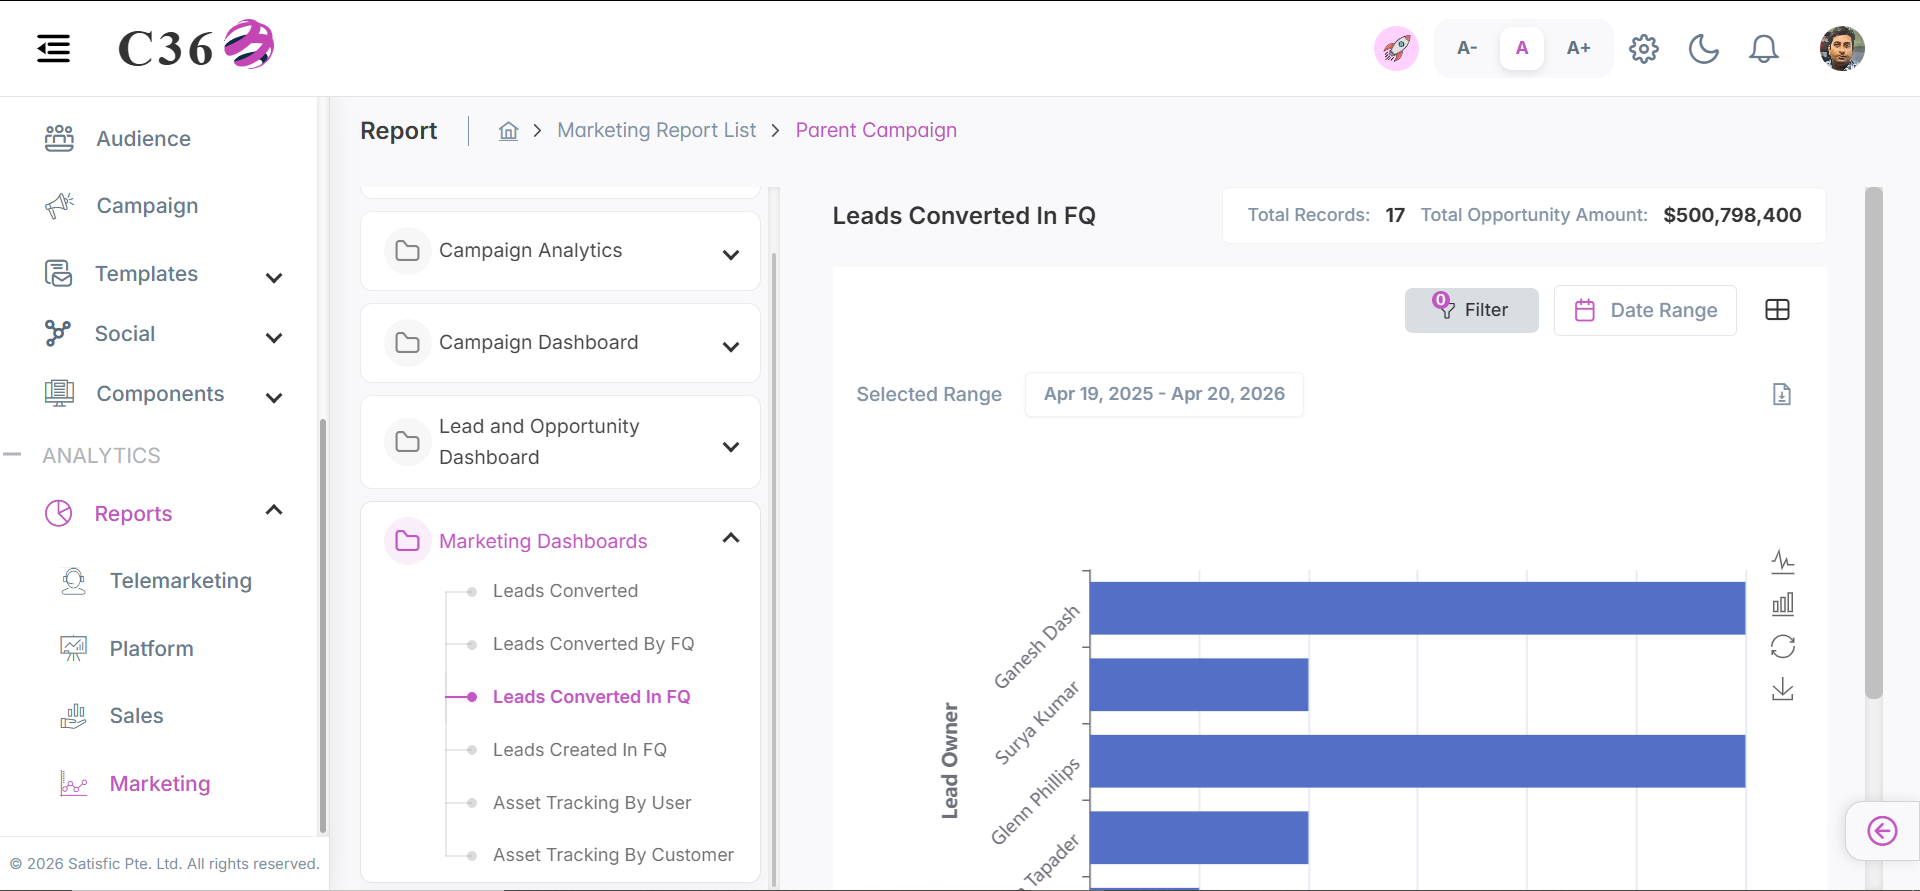
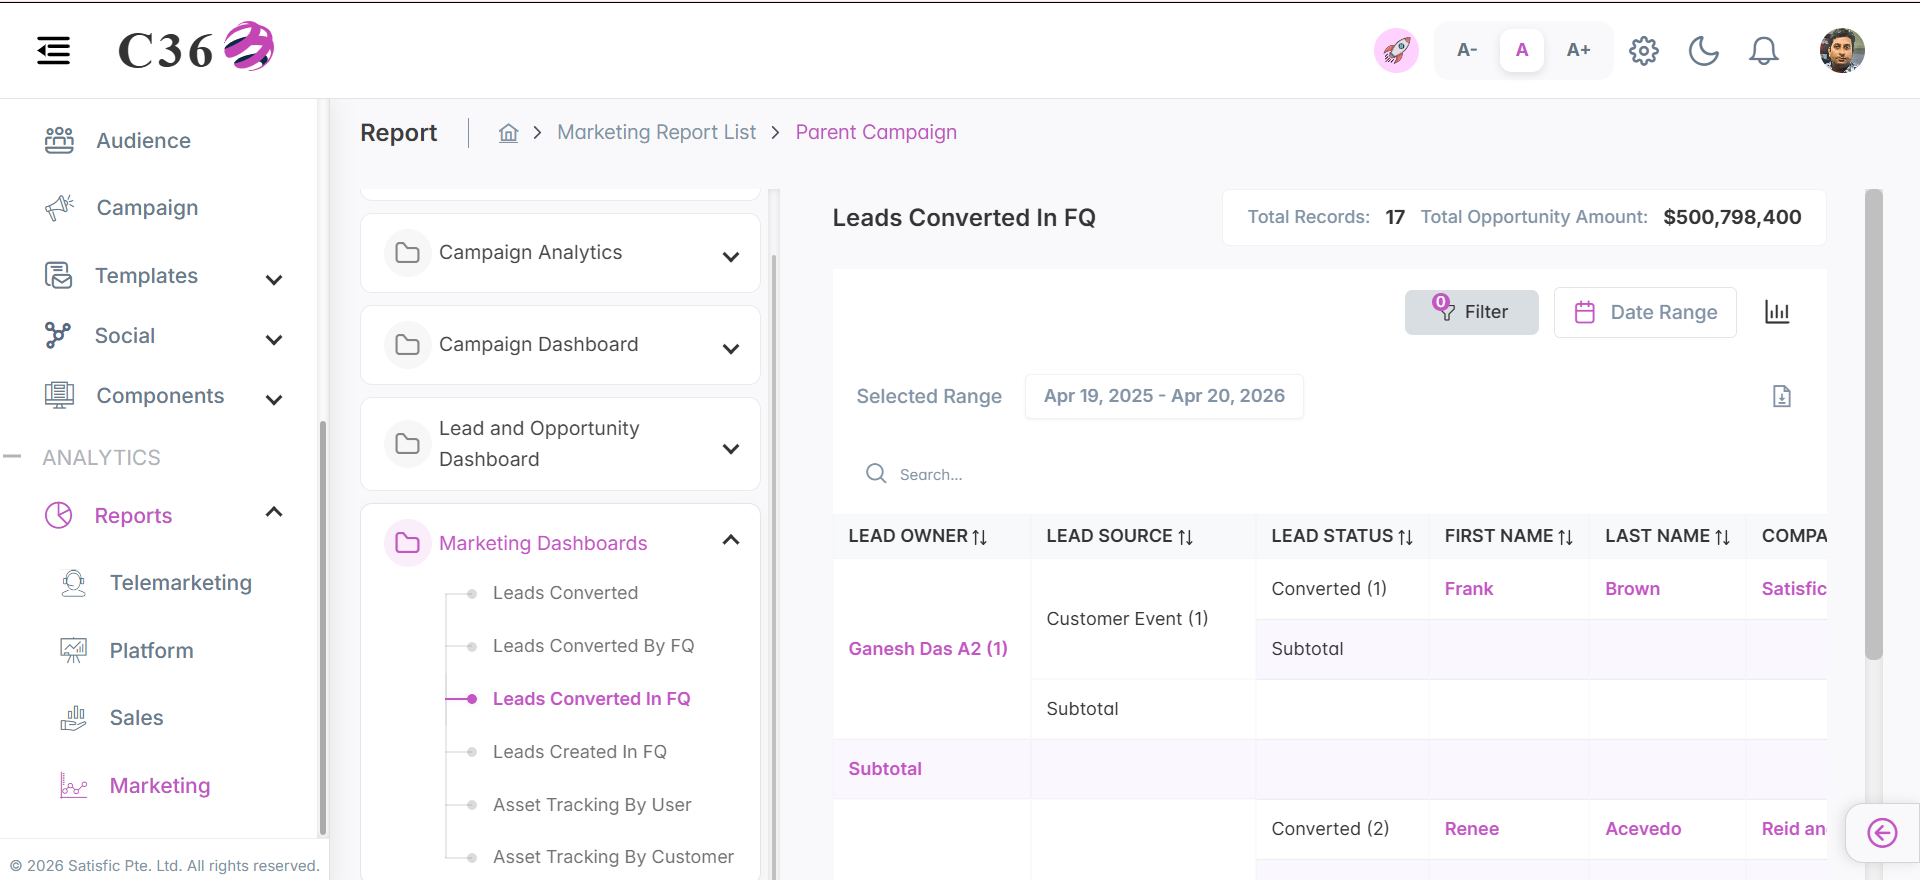
📆 Leads Converted In FQ
Monitors the real-time conversion rate of leads specifically within the current financial quarter.
- 📊 Chart View
- 📋 Table View
Click to see quick actions
- Can Toggle between Table view and Chart view.
- Can Export/Download the report.
- Can Filter by Date Range.
- Can Filter by Country, Company and Users.
- Toggle between Line chart and Bar chart.
- Save the Chart as an image.
- Can Restore the bar chart.
Click to see quick actions
- Can Toggle between Table view and Chart view.
- Can Export/Download the report.
- Can perform search in the table.
- Can Filter by Date Range.
- Can Filter by Country, Company and Users.
🧾 Columns included in the table view
| Field Name | Description |
|---|---|
| Lead Source | Origin of the lead, indicating how the lead was acquired (e.g., campaign, website, referral). |
| Lead Status | Current status of the lead within the lifecycle (e.g., New, Contacted, Qualified, Converted). |
| Lead Owner | User responsible for managing and following up with the lead. |
| First Name | First name of the lead or contact. |
| Last Name | Last name of the lead or contact. |
| Company/Account | Organization or company associated with the lead or opportunity. |
| Opportunity Amount | Estimated monetary value of the associated opportunity. |
| Created Date | Date when the record was initially created in the system. |
| Last Modified Date | Most recent date when the record was updated. |
| Converted Date | Date when the lead was successfully converted into an opportunity or customer. |
| Opportunity Owner | User responsible for managing the opportunity. |
| Opportunity Name | Unique name assigned to the opportunity for identification and tracking. |
| Opportunity: Account | Account associated with the opportunity. |
| Opportunity Close Date | Expected or actual date when the opportunity is closed. |
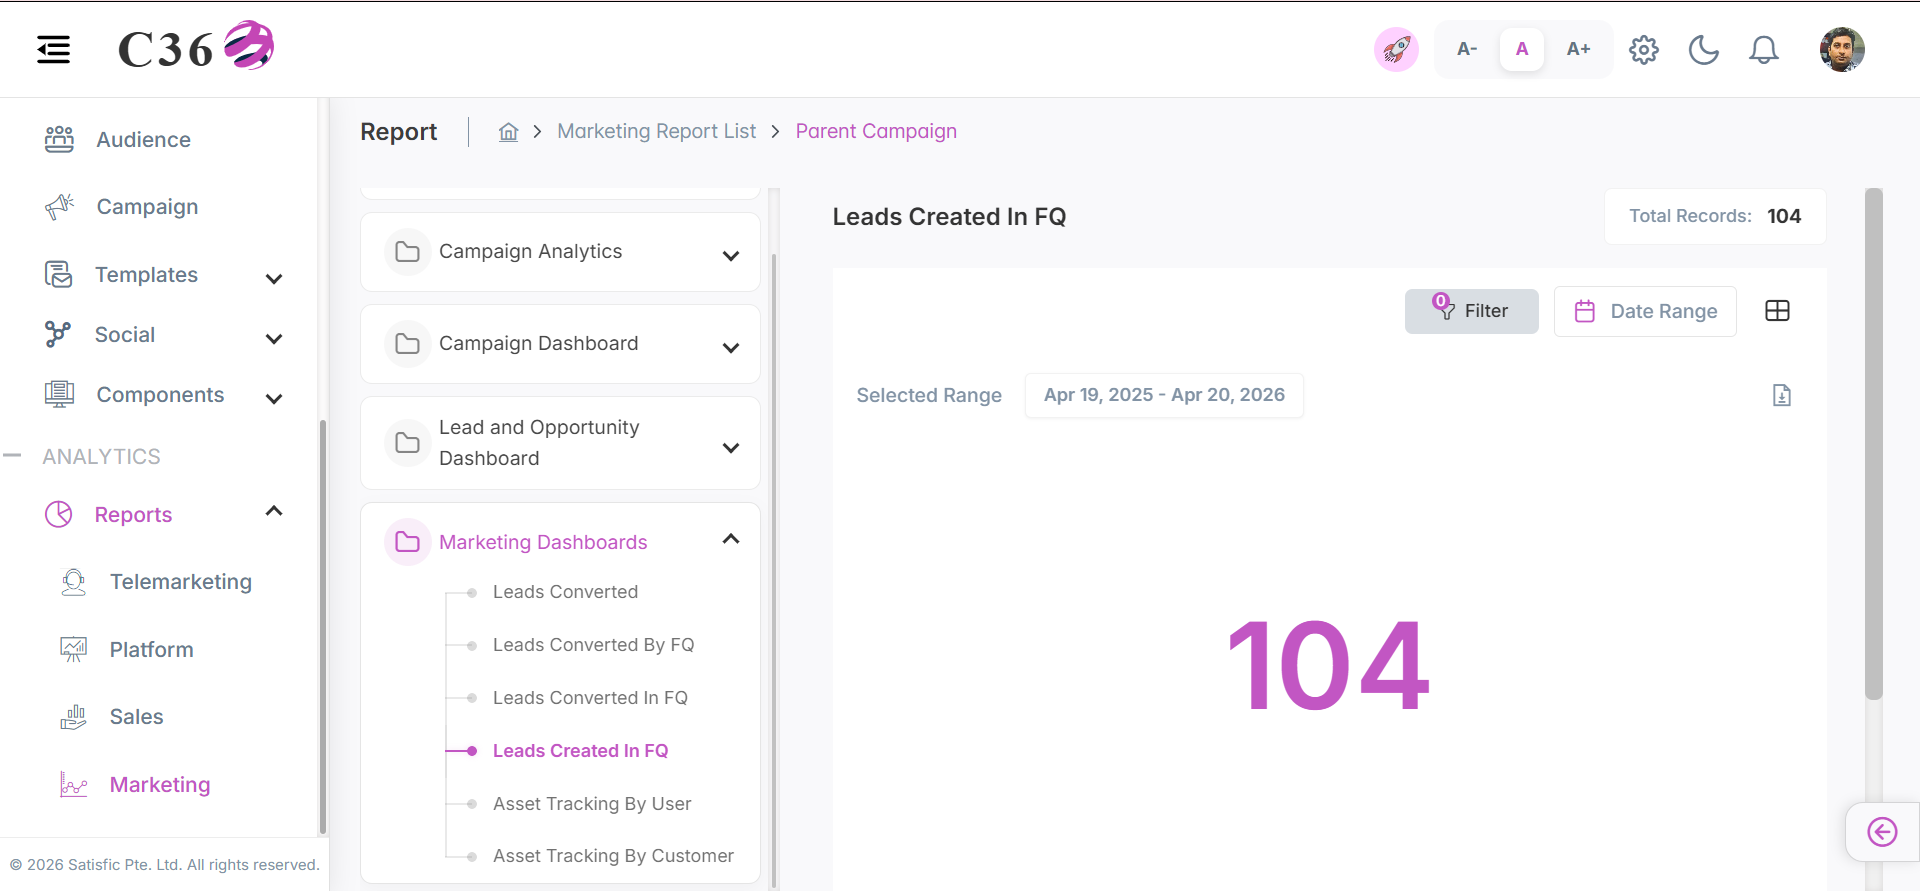
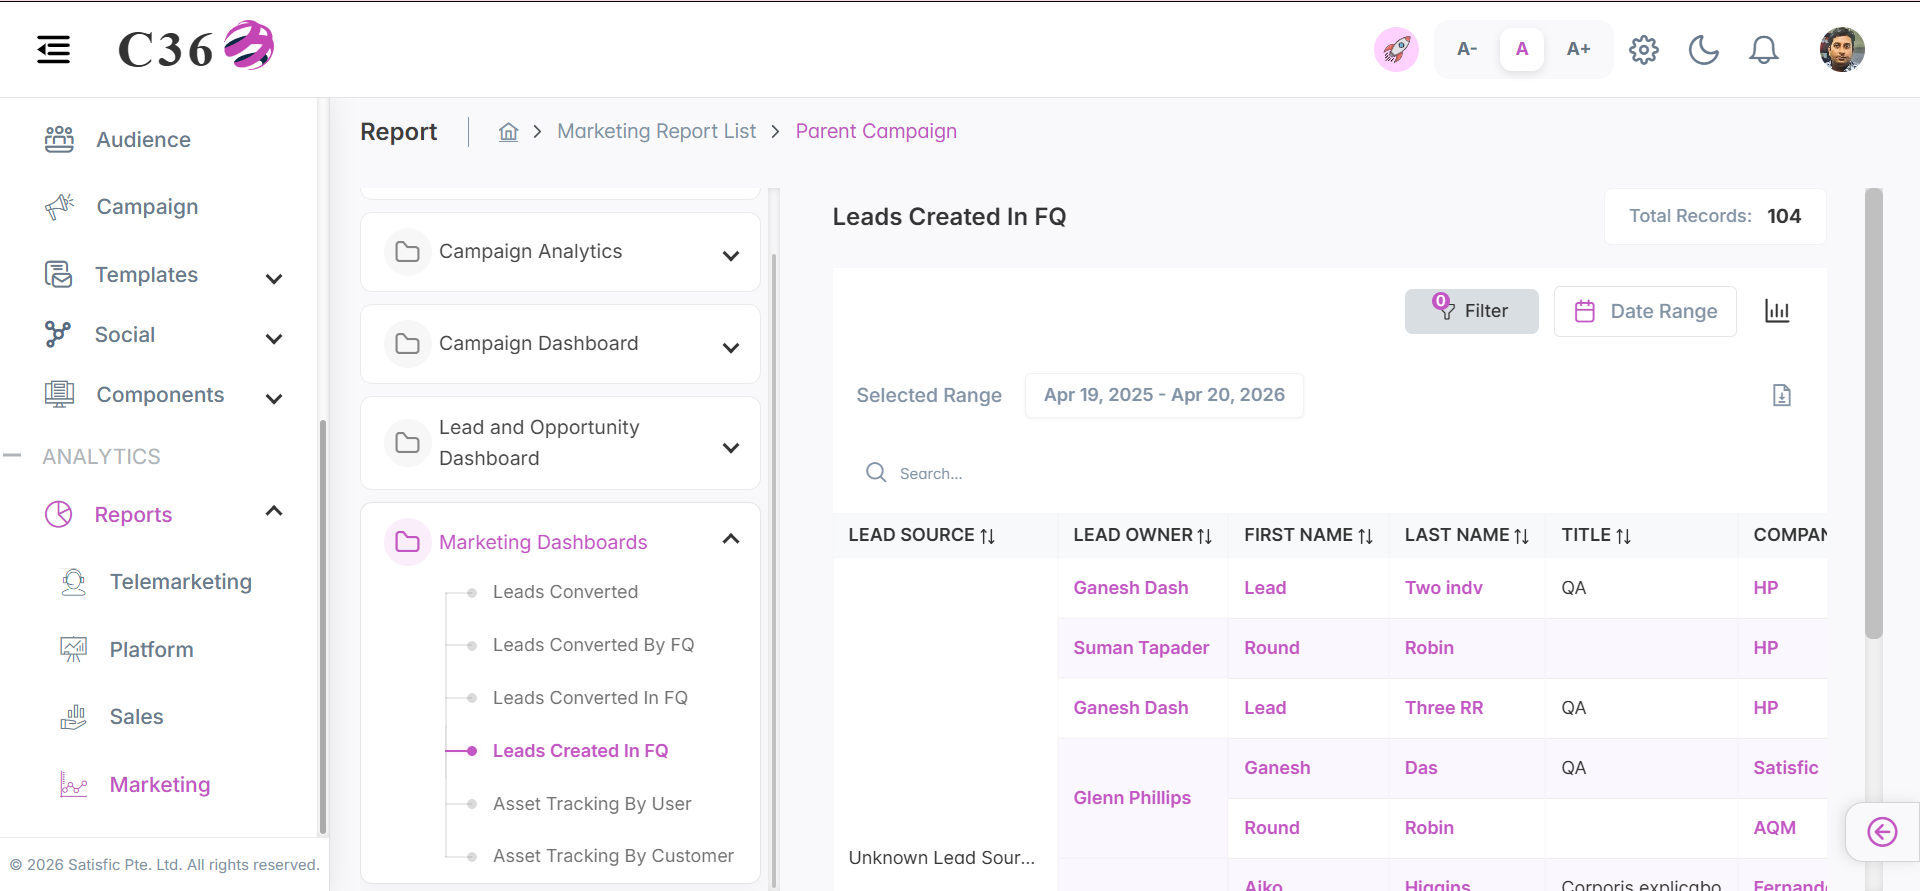
➕ Leads Created In FQ
Measures the total volume of net new leads generated during the active financial quarter.
- 📊 Chart View
- 📋 Table View
Click to see quick actions
- Can Toggle between Table view and Chart view.
- Can Export/Download the report.
- Can Filter by Date Range.
- Can Filter by Country, Company and Users.
Click to see quick actions
- Can Toggle between Table view and Chart view.
- Can Export/Download the report.
- Can perform search in the table.
- Can Filter by Date Range.
- Can Filter by Country, Company and Users.
🧾 Columns included in the table view
| Field Name | Description |
|---|---|
| Lead Source | Origin of the lead, indicating how the lead was acquired (e.g., campaign, website, referral). |
| Lead Owner | User responsible for managing and following up with the lead. |
| First Name | First name of the lead. |
| Last Name | Last name of the lead. |
| Title | Job title or designation of the lead within their organization. |
| Company/Account | Organization or company associated with the lead. |
| Stage | Current stage of the lead in the lifecycle (e.g., New, Contacted, Qualified). |
| Street | Street address of the lead. |
| Email address of the lead for communication. |
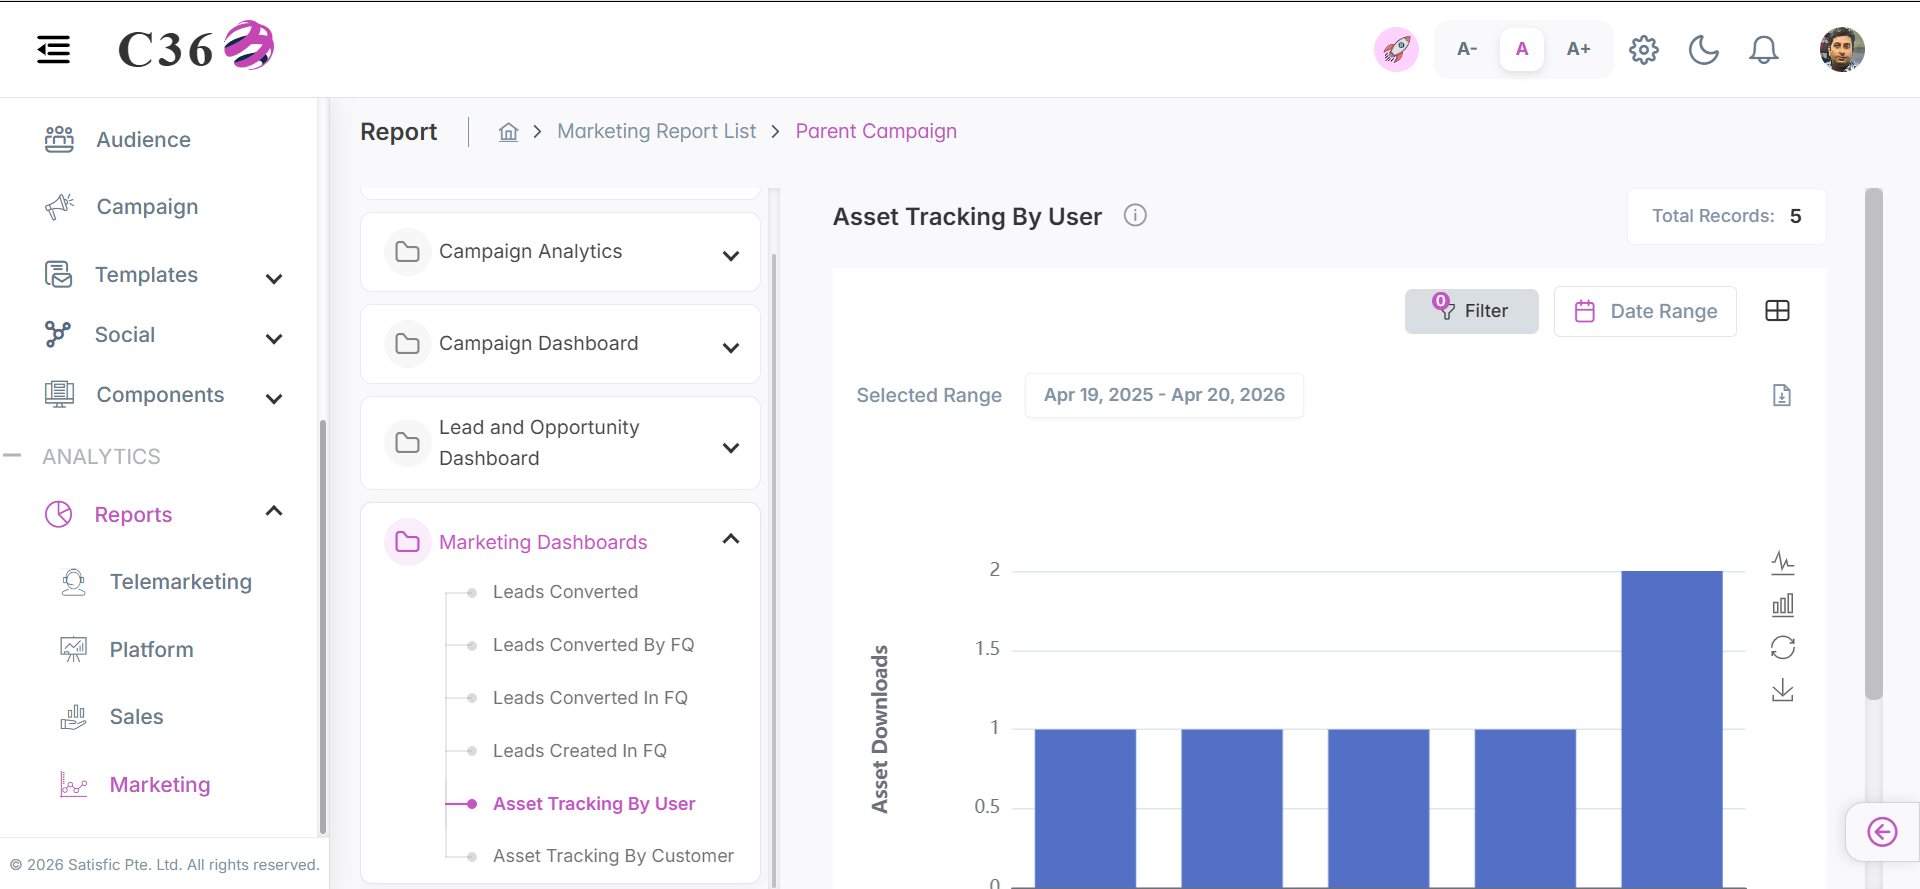
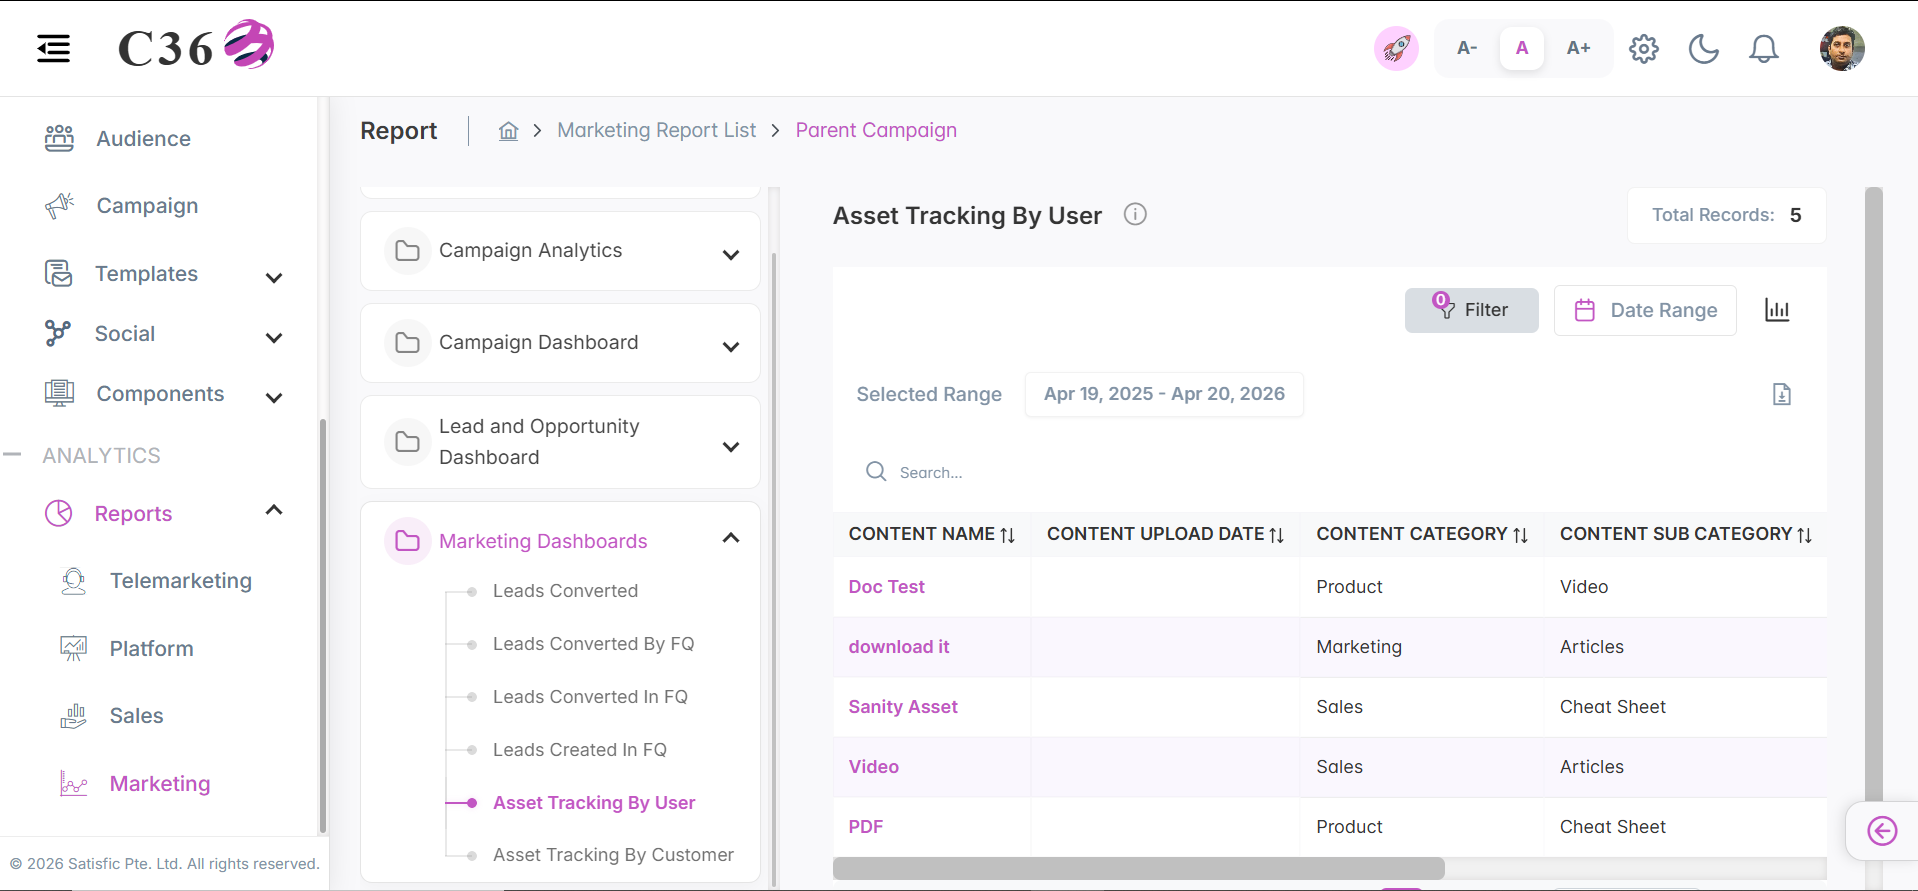
👤 Asset Tracking By User
Illustrates how individual team members or users are engaging with distributed marketing materials.
- 📊 Chart View
- 📋 Table View
Click to see quick actions
- Can Toggle between Table view and Chart view.
- Can Export/Download the report.
- Can Filter by Date Range.
- Can Filter by Country, Company and Users.
- Toggle between Line chart and Bar chart.
- Save the Chart as an image.
- Can Restore the bar chart.
Click to see quick actions
- Can Toggle between Table view and Chart view.
- Can Export/Download the report.
- Can perform search in the table.
- Can Filter by Date Range.
- Can Filter by Country, Company and Users.
🧾 Columns included in the table view
| Field Name | Description |
|---|---|
| Content Name | Name or title of the uploaded content used for identification and reference. |
| Content Upload Date | Date when the content was uploaded to the system. |
| Content Category | Primary classification of the content (e.g., brochure, whitepaper, video). |
| Content Sub Category | Secondary classification providing more detailed grouping of the content. |
| Most Recent Views | Number of views recorded in the most recent activity period. |
| Total Content Download | Total number of times the content has been downloaded by users. |
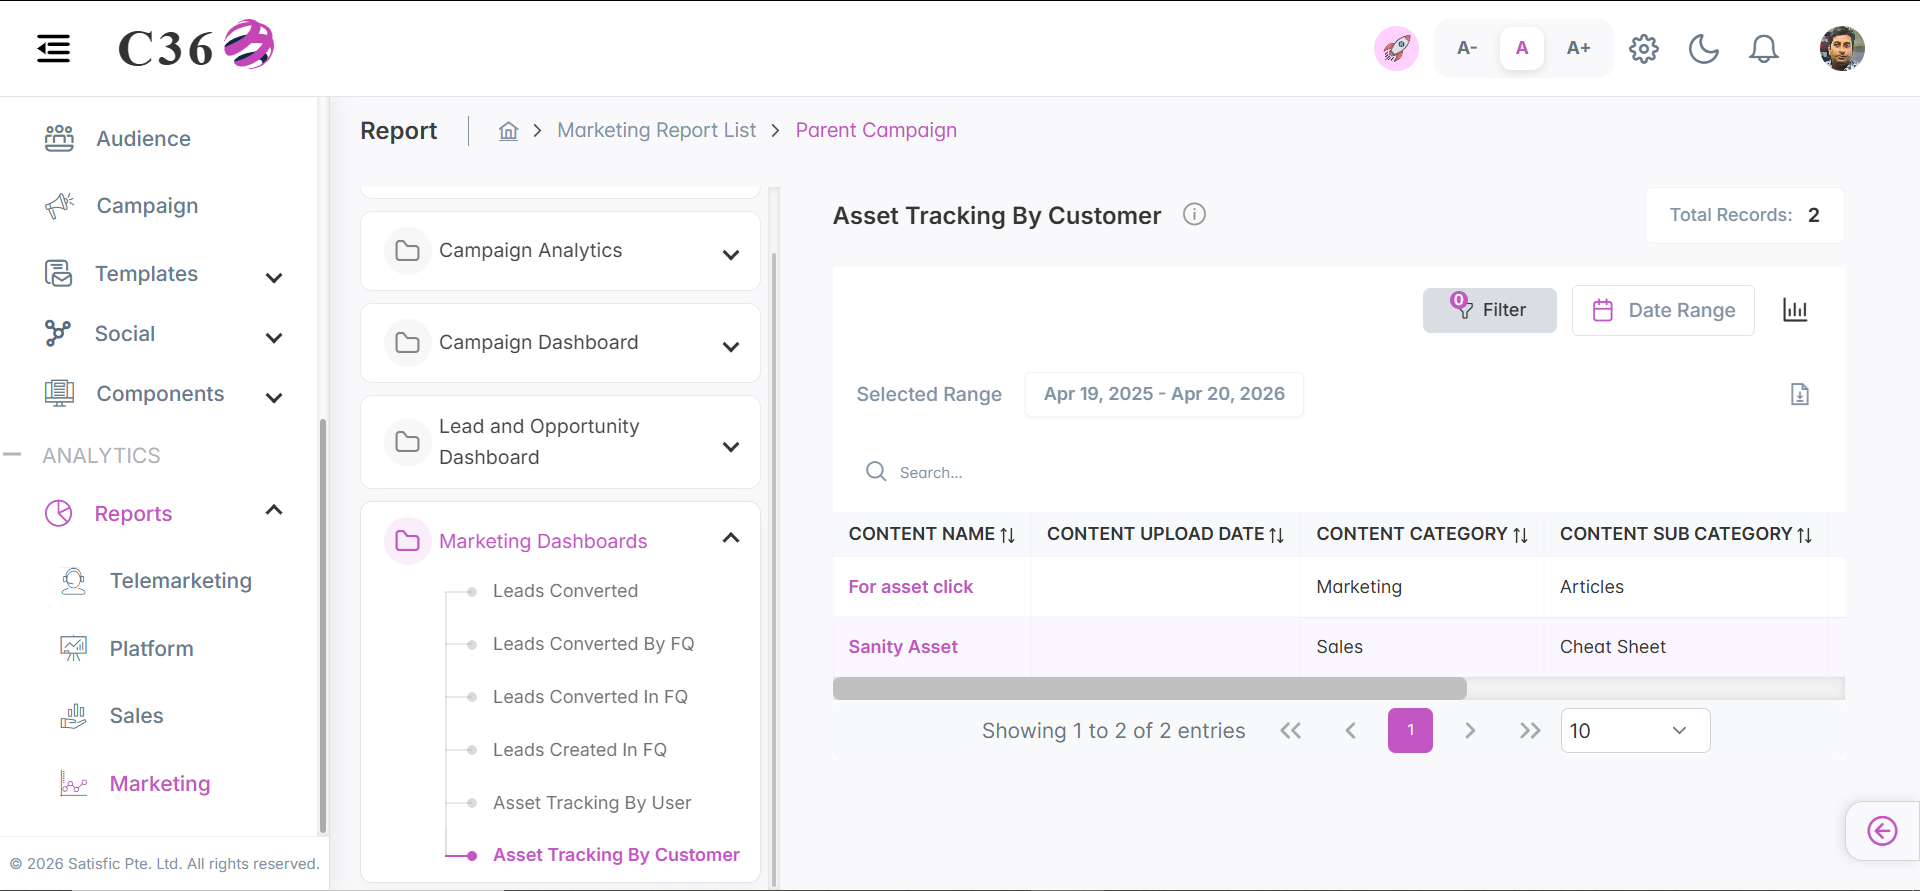
🏢 Asset Tracking By Customer
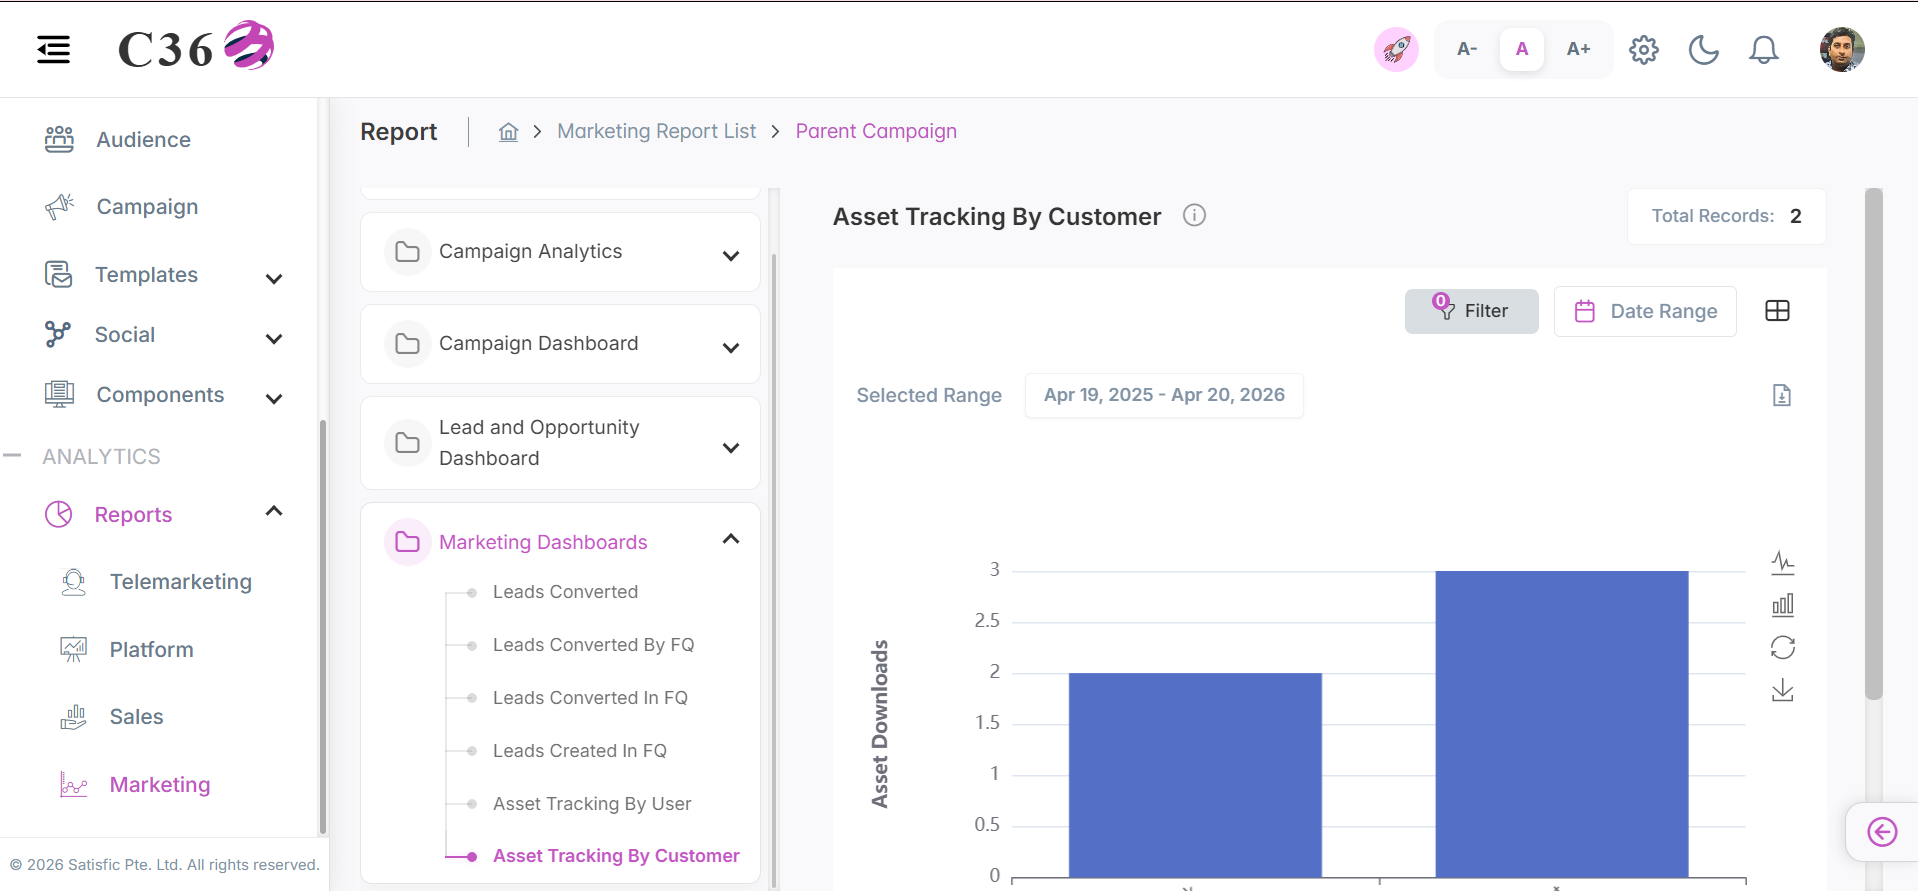
Evaluates the effectiveness of marketing assets based on direct interactions and engagement from customers.
- 📊 Chart View
- 📋 Table View
Click to see quick actions
- Can Toggle between Table view and Chart view.
- Can Export/Download the report.
- Can Filter by Date Range.
- Can Filter by Country, Company and Users.
- Toggle between Line chart and Bar chart.
- Save the Chart as an image.
- Can Restore the bar chart.
Click to see quick actions
- Can Toggle between Table view and Chart view.
- Can Export/Download the report.
- Can perform search in the table.
- Can Filter by Date Range.
- Can Filter by Country, Company and Users.
🧾 Columns included in the table view
| Field Name | Description |
|---|---|
| Content Name | Name or title of the uploaded content used for identification and reference. |
| Content Upload Date | Date when the content was uploaded to the system. |
| Content Category | Primary classification of the content (e.g., brochure, whitepaper, video). |
| Content Sub Category | Secondary classification providing more detailed grouping of the content. |
| Most Recent Views | Number of views recorded in the most recent activity period. |
| Total Content Download | Total number of times the content has been downloaded by users. |